Hubble Views a Dim but Distinct Galaxy

Hubble Views a Dim but Distinct Galaxy

2 min read

Hubble Views a Dim but Distinct Galaxy

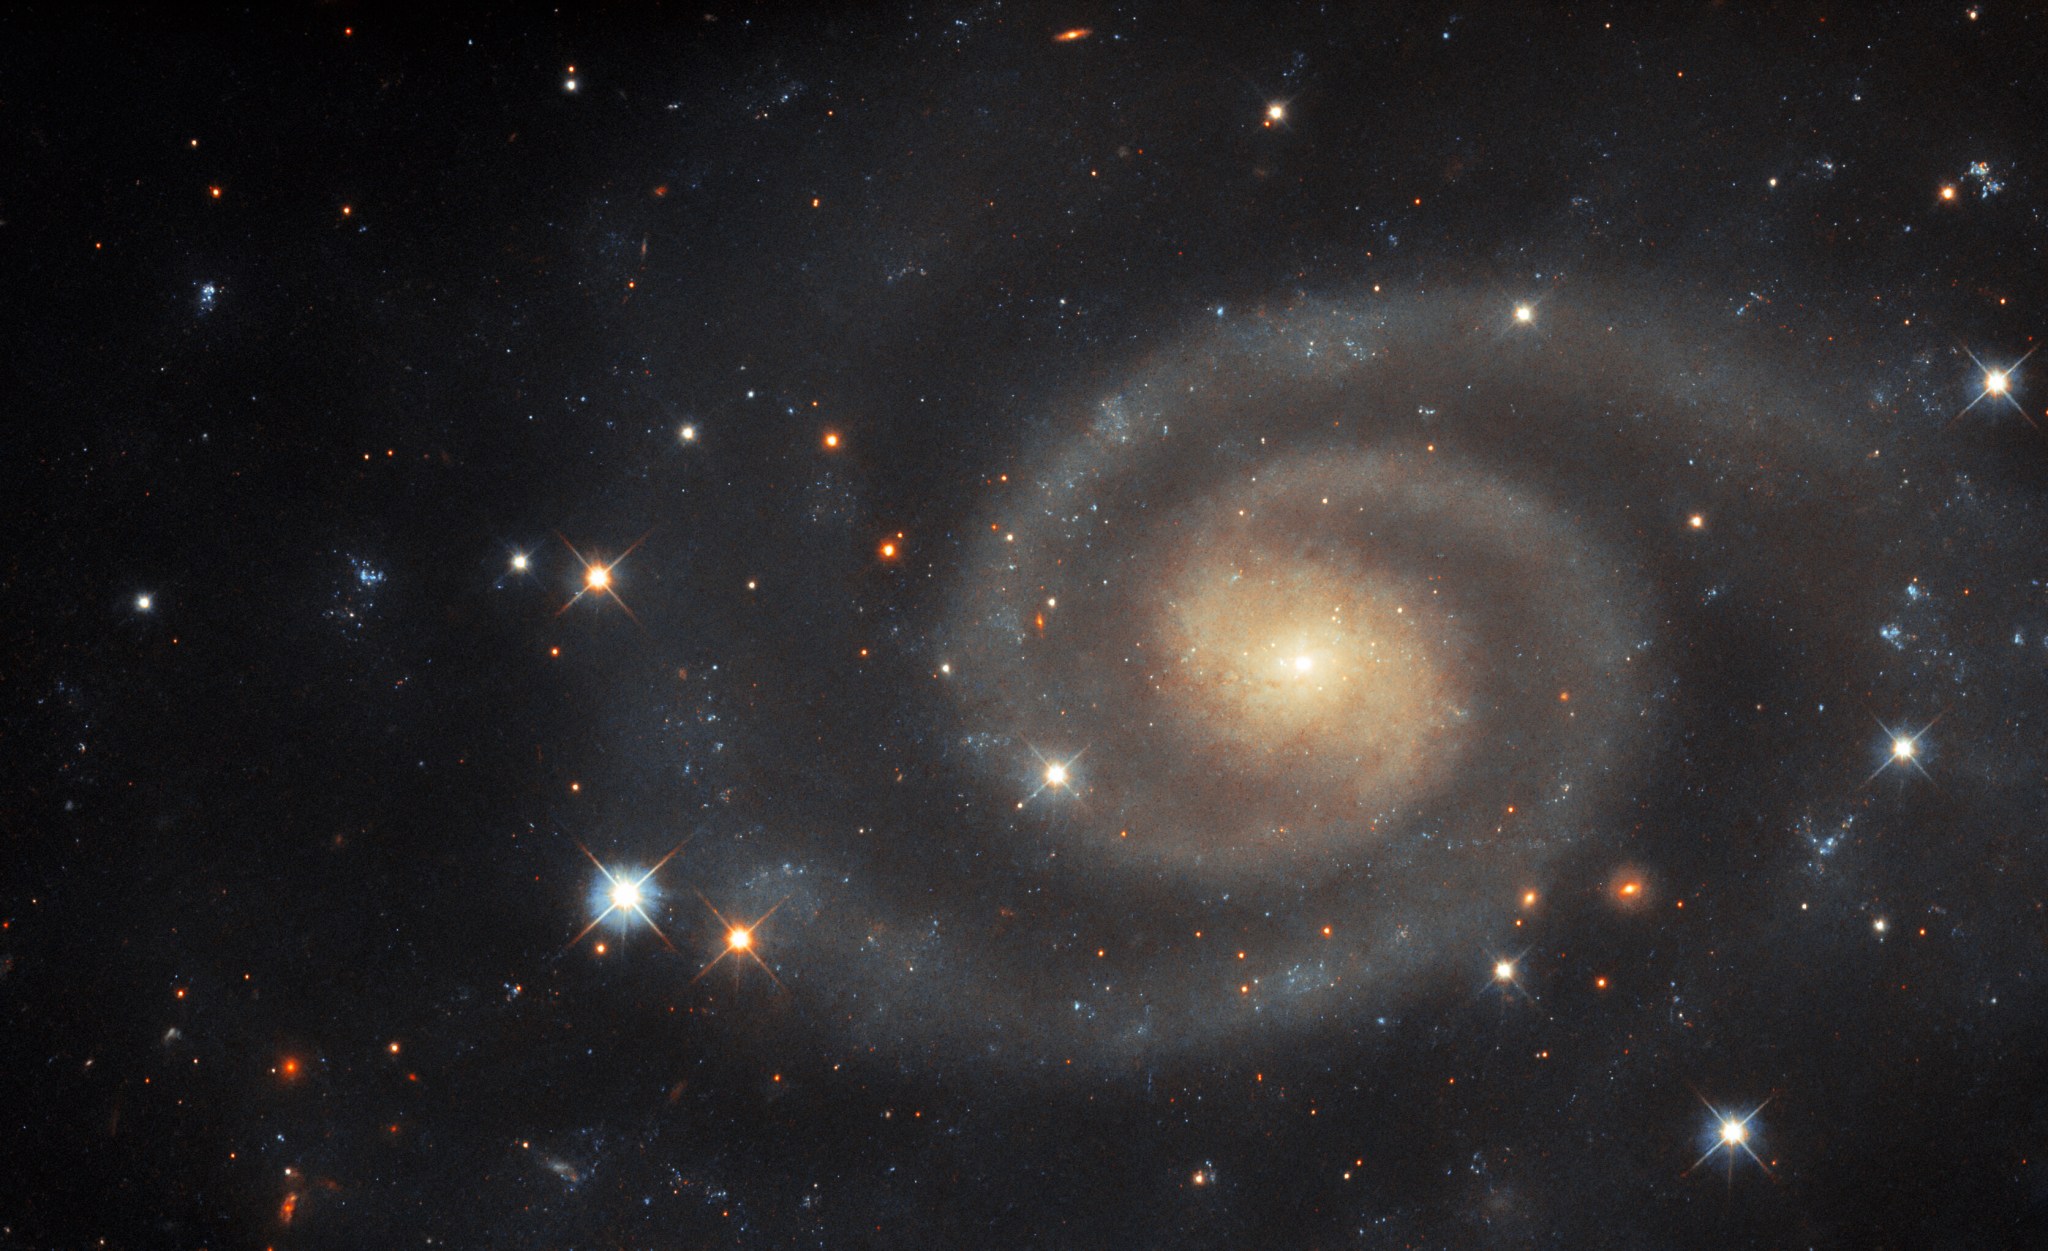
A spiral galaxy, with two prominent, tightly wound arms around the brighter core. The arms disperse into a wide halo of stars and dust at their ends, giving the galaxy an oval shape. A number of bright, foreground stars appear to flank the galaxy, each holding the signature cross of diffracting light. The image also holds a few distant background galaxies.
Both visible and ultraviolet wavelengths of light comprise this Hubble Space Telescope image of the spiral galaxy UGC 11105.
ESA/Hubble & NASA, R. J. Foley (UC Santa Cruz)

This image of the softly luminous spiral galaxy UGC 11105 is from the NASA/ESA Hubble Space Telescope. It lies about 110 million light-years from Earth in the constellation Hercules.

Astronomers have different ways of quantifying how bright celestial objects are. Apparent magnitude is one of those methods. It describes how bright an object appears to an observer on Earth, which is not the same thing as measuring how bright an object actually is; or its intrinsic brightness. Apparent magnitude depends heavily on an object’s proximity to Earth.

To better understand how apparent magnitude works, consider streetlights; each lamppost is putting out the same amount of light, but the light that is closer to you is much brighter than one several blocks away. Although their intrinsic brightness is the same, their apparent brightness is different.

UGC 11105 has an apparent magnitude, or brightness, of around 13.6 in the light our eyes are sensitive to, called visible or optical light. However, this image also holds ultraviolet data, allowing us to see wavelengths beyond those that the human eye can see. Because of its proximity and our perspective here on Earth, the Sun appears to be about 14 thousand trillion times brighter than UGC 11105, even though UGC 11105 is an entire galaxy. Hubble’s sensitivity and location above Earth’s light-distorting atmosphere allows the observatory to see extraordinarily dim objects in visible light, ultraviolet light, and a small portion of infrared light.

Text credit: European Space Agency (ESA)

Media Contact:

Claire Andreoli
NASA’s Goddard Space Flight Center, Greenbelt, MD
claire.andreoli@nasa.gov

Share

Details

Last Updated
Feb 02, 2024
Editor
Andrea Gianopoulos
Location
Goddard Space Flight Center

Powered by WPeMatico

Get The Details…

Hubble Sees a Merged Galaxy

Hubble Sees a Merged Galaxy

2 min read

Hubble Sees a Merged Galaxy

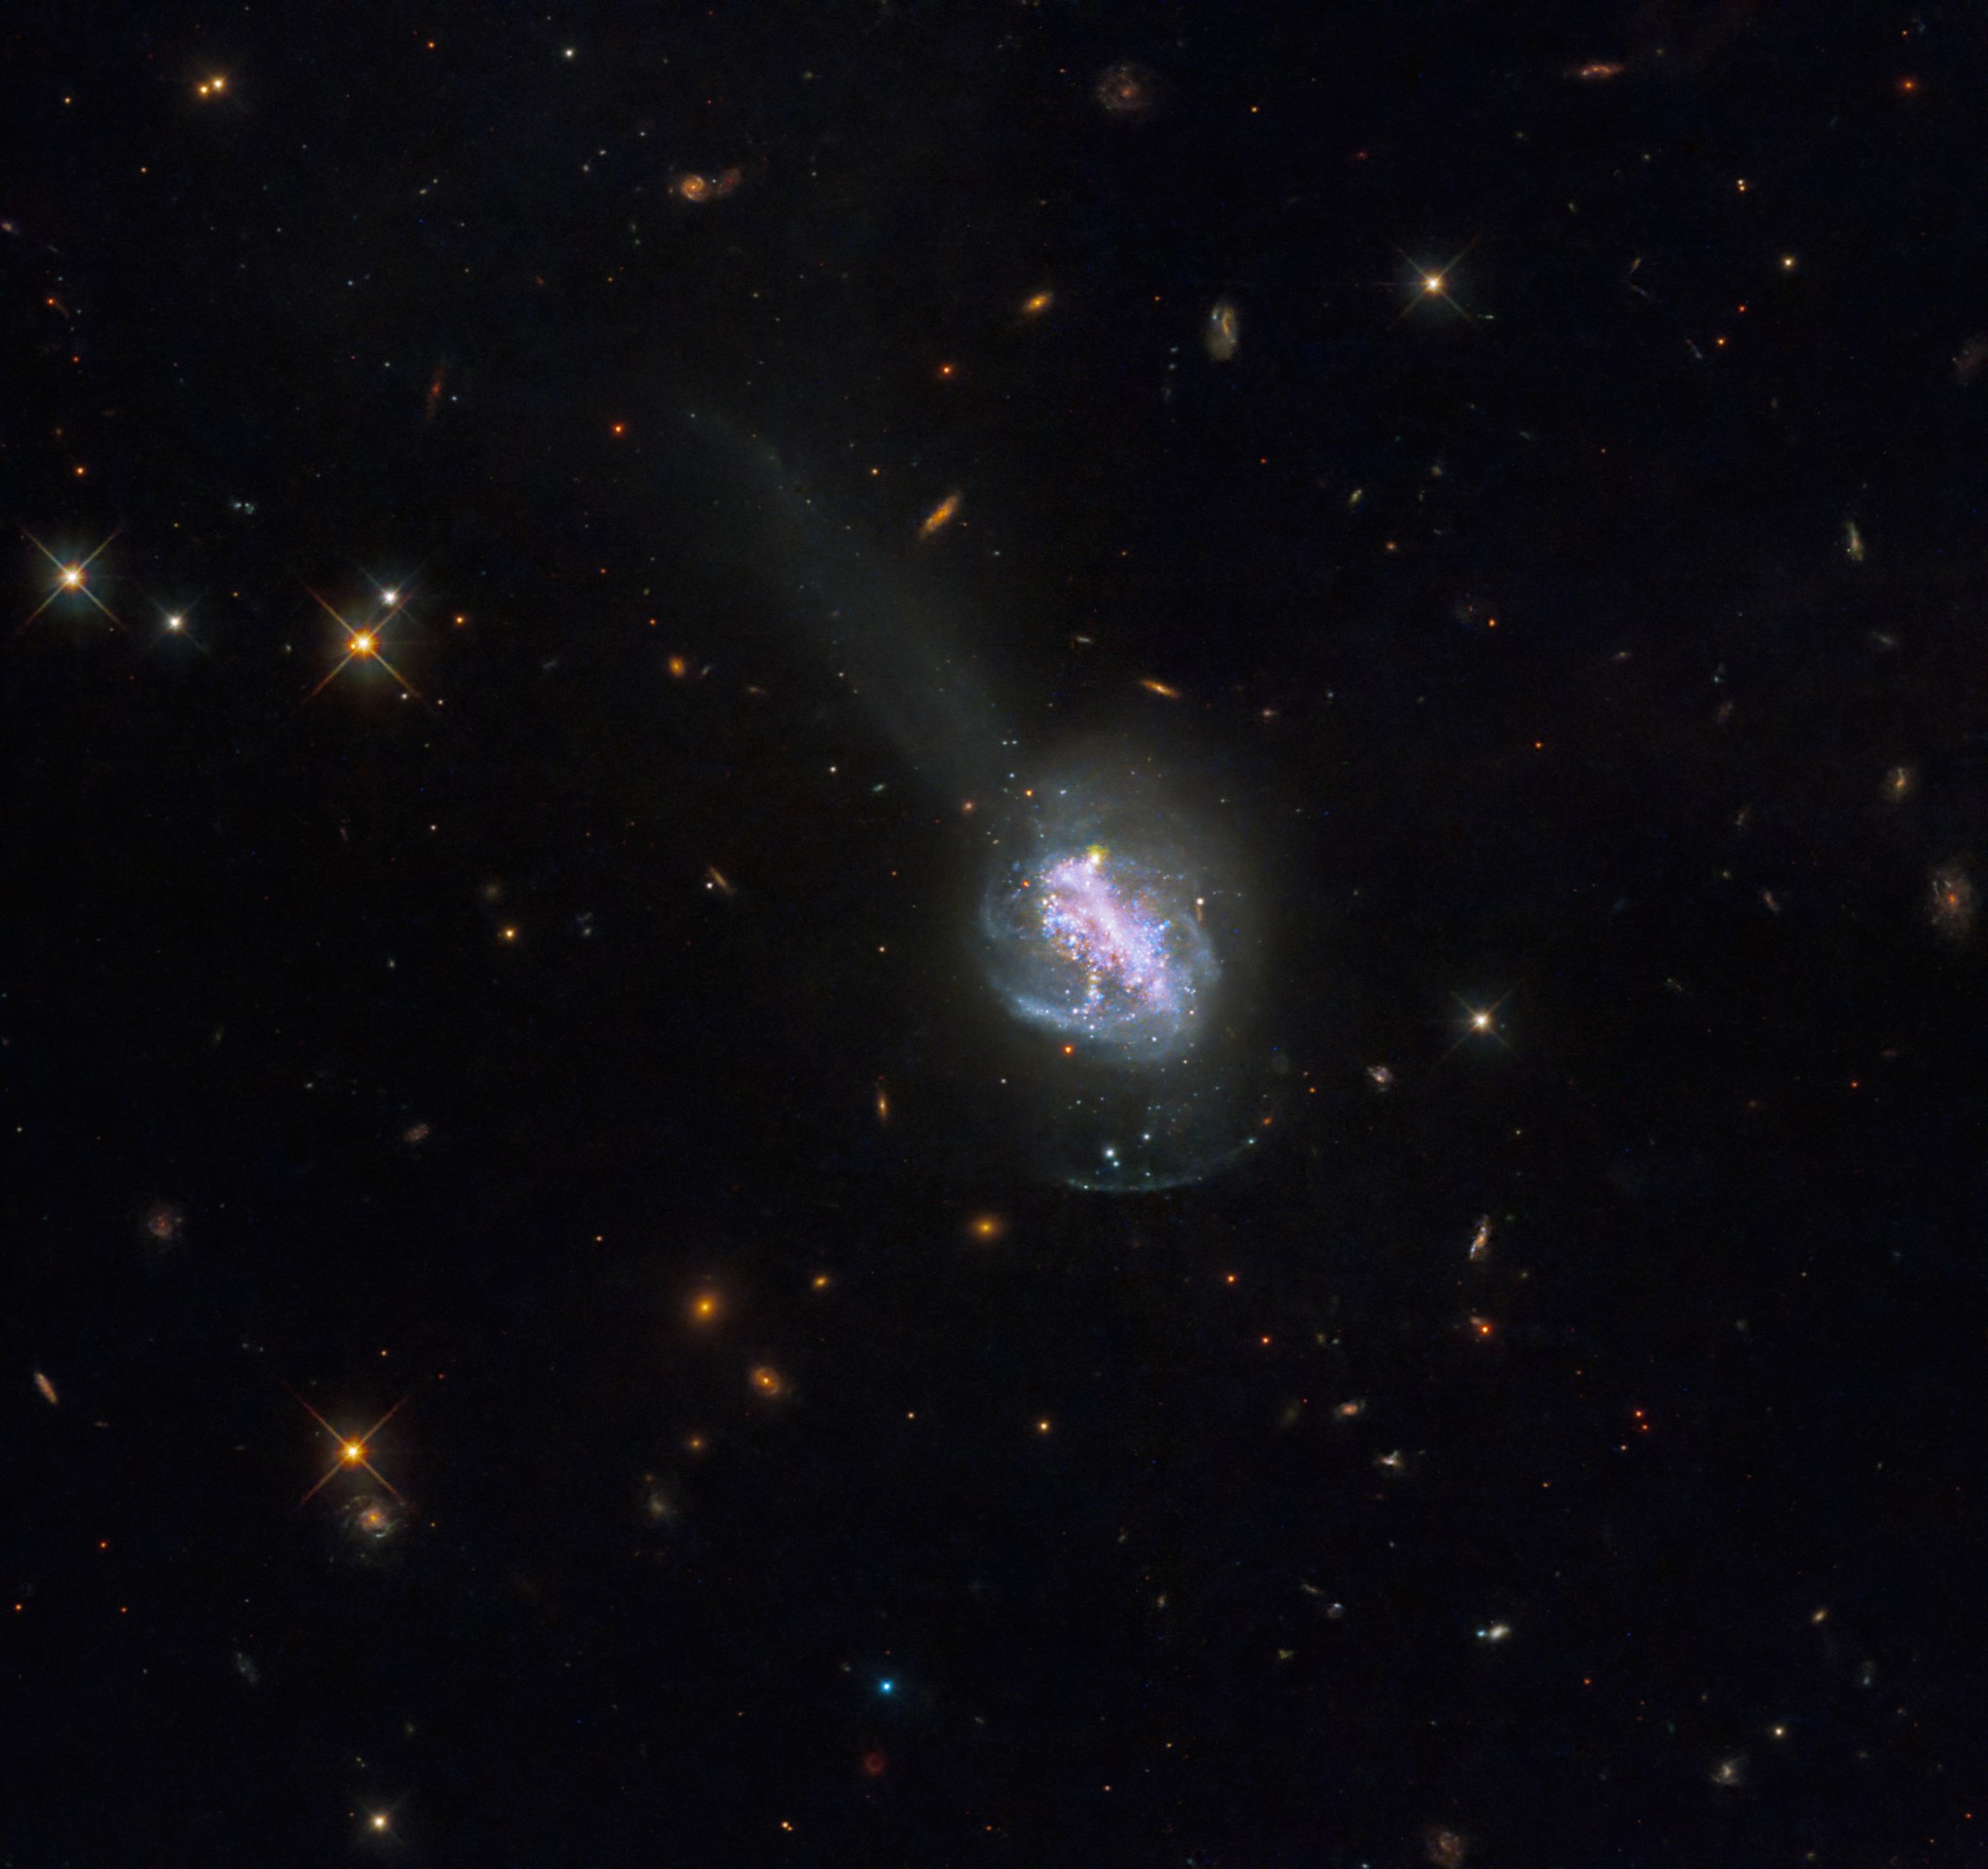
A bright, purplish galaxy glows at the image’s center, with blue stars interspersed and a blue-white haze extending outward, all against black space dotted with stars and distant galaxies.
This new NASA Hubble Space Telescope image reveals the luminous blue compact galaxy called ESO 185-IG013.
NASA, ESA, and R. Chandar (University of Toledo); Processing: Gladys Kober (NASA/Catholic University of America)

This new NASA Hubble Space Telescope image shows ESO 185-IG013, a luminous blue compact galaxy (BCG). BCGs are nearby galaxies that show an intense burst of star formation. They are unusually blue in visible light, which sets them apart from other high-starburst galaxies that emit more infrared light. Astrophysicists study BCGs because they provide a relatively close-by equivalent for galaxies from the early universe. This means that BCGs can help scientists learn about galaxy formation and evolution that may have been happening billions of years ago.

Hubble imaged ESO 185-IG013 in ultraviolet, visible, and infrared wavelengths to reveal details about its past. Hundreds of young star clusters, many of which are younger than 100 million years, populate the galaxy. A large number of star clusters are only 3.5 million years old – relative infants compared to the timescale of our universe. Scientists predict that many of these youngest clusters will not last, since young clusters can often perish after expelling too much of their gas. The large number of young star clusters indicates that this galaxy was part of a recent galaxy collision and merger. The perturbed structure of the galaxy, which likely occurred from the violent interactions of gas and dust during the collision, is another sign. The merger supplied the system with lots of fuel for star formation, which continues to take place today.

ESO 185-IG013 also contains a tidal shell, the diffuse glow surrounding its bright center, which is a common signal of galaxy mergers. Scientists believe that in a galaxy merger, the smaller of the two interacting galaxies gets disrupted by the larger galaxy, losing most of its material. This releases the material, which then gets pulled in again by the gravity of the larger galaxy. The dense area where the material gets repositioned is called the shell, and it contains many star clusters. In addition to the shell, ESO 185-IG013 boasts a tail of gas in the northeast.

All of the stars in the system have a combined mass more than 7 billion times that of our Sun. The system is located about 260 million light-years away.

LEARN MORE:

Media Contact:

Claire Andreoli
NASA’s Goddard Space Flight Center, Greenbelt, MD
claire.andreoli@nasa.gov

Share

Details

Last Updated
Feb 01, 2024
Editor
Andrea Gianopoulos
Location
Goddard Space Flight Center

Powered by WPeMatico

Get The Details…

NASA Science Arrives on Cygnus; Private Astronauts Prepare for Return

NASA Science Arrives on Cygnus; Private Astronauts Prepare for Return

The Cygnus space freighter, with its two cymbal-shaped UltraFlex solar arrays, is pictured in the grips of the Canadarm2 robotic arm after its capture on Feb. 1, 2024.

As part of NASA’s commercial resupply services, Northrop Grumman’s Cygnus cargo craft arrived at the International Space Station today packed with science and supplies for the Expedition 70 crew. The seven orbital outpost residents now turn their attention to the departure of four Axiom Mission 3 (Ax-3) visitors.

Cygnus was captured with the Canadarm2 robotic arm controlled by NASA Flight Engineer Loral O’Hara at 4:59 a.m. EST on Thursday. Shortly afterward, mission controllers on the ground took over control of the Canadarm2 and installed Cygnus to the Unity module’s Earth-facing port at 7:14 a.m.

About three hours later, O’Hara and NASA Flight Engineer Jasmin Moghbeli equalized pressure between Cygnus and the space station then opened Cygnus’ hatch to begin six months of cargo operations. They were followed by Commander Andreas Mogensen of ESA (European Space Agency) and Flight Engineer Satoshi Furukawa of JAXA (Japan Aerospace  Exploration Agency) who began unpacking new research samples and stowing them inside lab freezers for upcoming science investigations.

Mogensen also helped the four Ax-3 astronauts prepare for their departure from the station aboard the SpaceX Dragon Freedom spacecraft for no earlier than Saturday morning. Mission managers from Axiom Space, SpaceX, and NASA are monitoring weather conditions at the splashdown site off the coast of Florida before making a final undocking decision.

Ax-3 astronauts Michael López-Alegría and Walter Villadei packed completed science experiments in lab freezers and prepared them for stowage aboard their Dragon spacecraft Thursday morning. The duo then joined fellow Ax-3 crewmates Alper Gezeravcı and Marcus Wandt for a conference with mission controllers discussing the cargo that will be returning with them aboard Dragon.

All four private astronauts will join the seven-member Expedition 70 crew at 9:50 a.m. Friday, Feb. 2, for a farewell ceremony aboard the space station. The event will be broadcast live on the NASA+ streaming service, NASA TV, the NASA app, YouTube, and the agency’s website. Learn how to stream NASA TV through a variety of platforms, including social media.

The orbiting lab’s three cosmonauts worked throughout Thursday on their complement of science and cargo activities in the station’s Roscosmos segment. Flight Engineers Nikolai Chub and Konstantin Borisov carried out an Earth observation experiment to support educational and commercial opportunities on Earth. Afterward, Chub conducted a fluid physics study while Borisov began a 24-hour blood pressure monitoring session. Borisov later installed an ultraviolet camera to capture nighttime imagery of Earth’s atmosphere. Veteran cosmonaut Oleg Kononenko inventoried cargo in the Prichal docking module then stowed cargo inside the Progress 85 resupply ship docked to the rear of the Zvezda service module.

NASA will share more on Axiom Mission 3’s departure as available following the next weather review. The mission is the third private astronaut mission to the space station enabled by NASA.


Learn more about station activities by following the space station blog, @space_station and @ISS_Research on X, as well as the ISS Facebook and ISS Instagram accounts.

Get weekly video highlights at: https://roundupreads.jsc.nasa.gov/videoupdate/

Get the latest from NASA delivered every week. Subscribe here: www.nasa.gov/subscribe

Powered by WPeMatico

Get The Details…
Mark Garcia

First Hot Fire Test of the Year for Artemis

First Hot Fire Test of the Year for Artemis

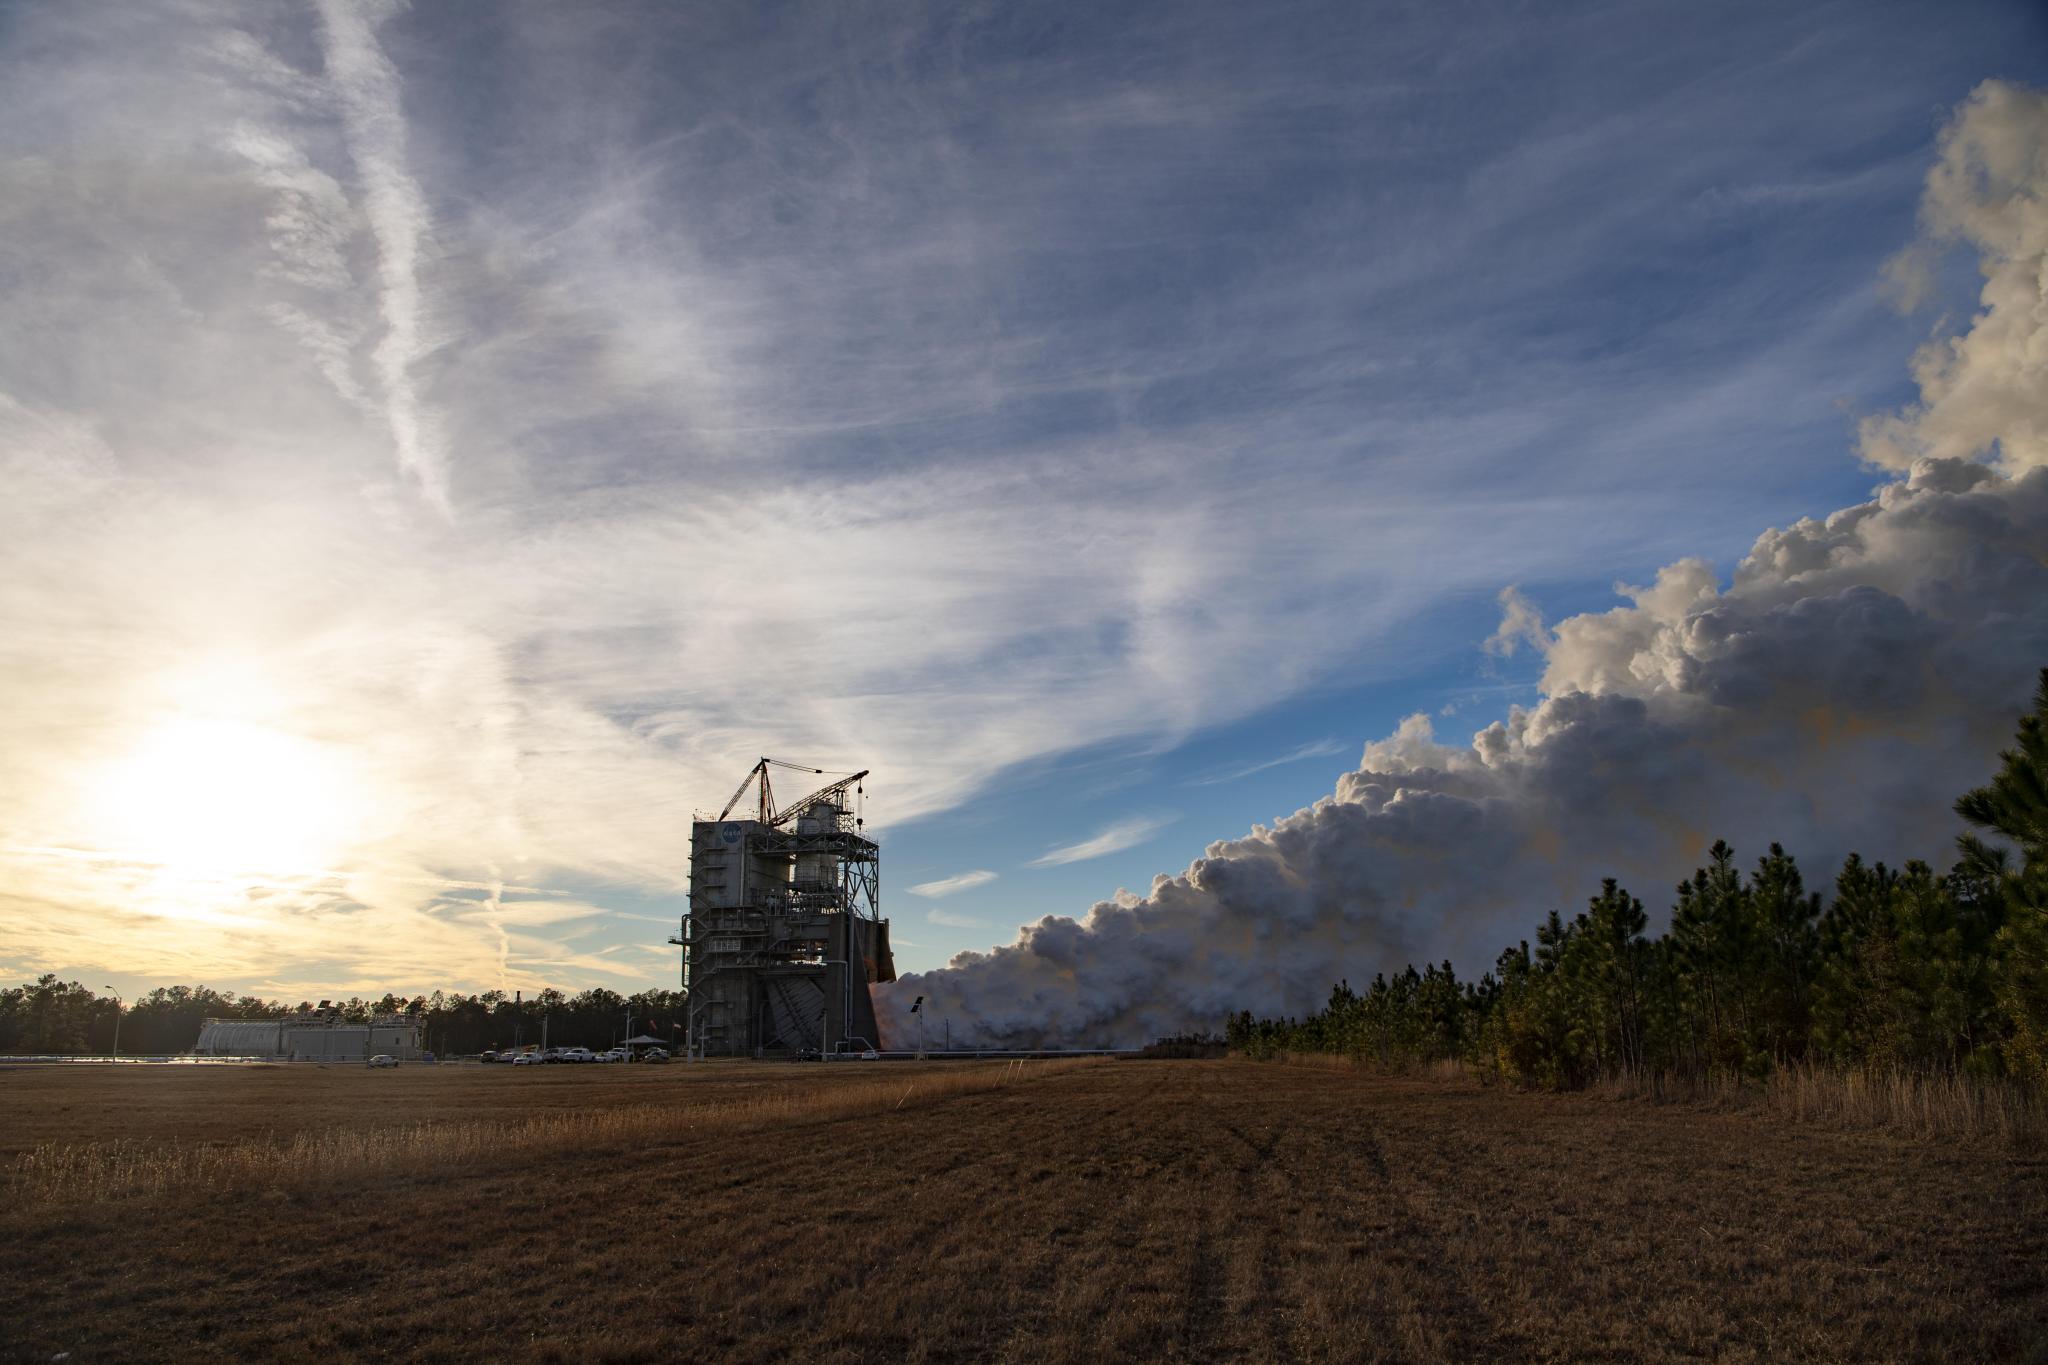
White vapor clouds billow up and to the right of this image during a hot fire test. The sun is a diffuse, bright yellow spot, covered by wispy clouds that dominate the sky.
NASA/Danny Nowlin

Clouds of white vapor pile up at NASA’s Stennis Space Center in Bay St. Louis, Mississippi, during a full-duration, 500-second hot fire of an RS-25 certification engine Jan. 17, 2024. This test series is critical for future flights of NASA’s SLS (Space Launch System) rocket in support of the Artemis campaign.

During the Jan. 17 test, operators followed a “test like you fly” approach, firing the engine for the same amount of time – almost eight-and-a-half minutes (500 seconds) – needed to launch SLS and at power levels ranging between 80% to 113%.

Image Credit: NASA/Danny Nowlin

Powered by WPeMatico

Get The Details…
Monika Luabeya

OpenET Moisture Measurement Tool is Proving Highly Accurate

OpenET Moisture Measurement Tool is Proving Highly Accurate

5 min read

OpenET Moisture Measurement Tool is Proving Highly Accurate

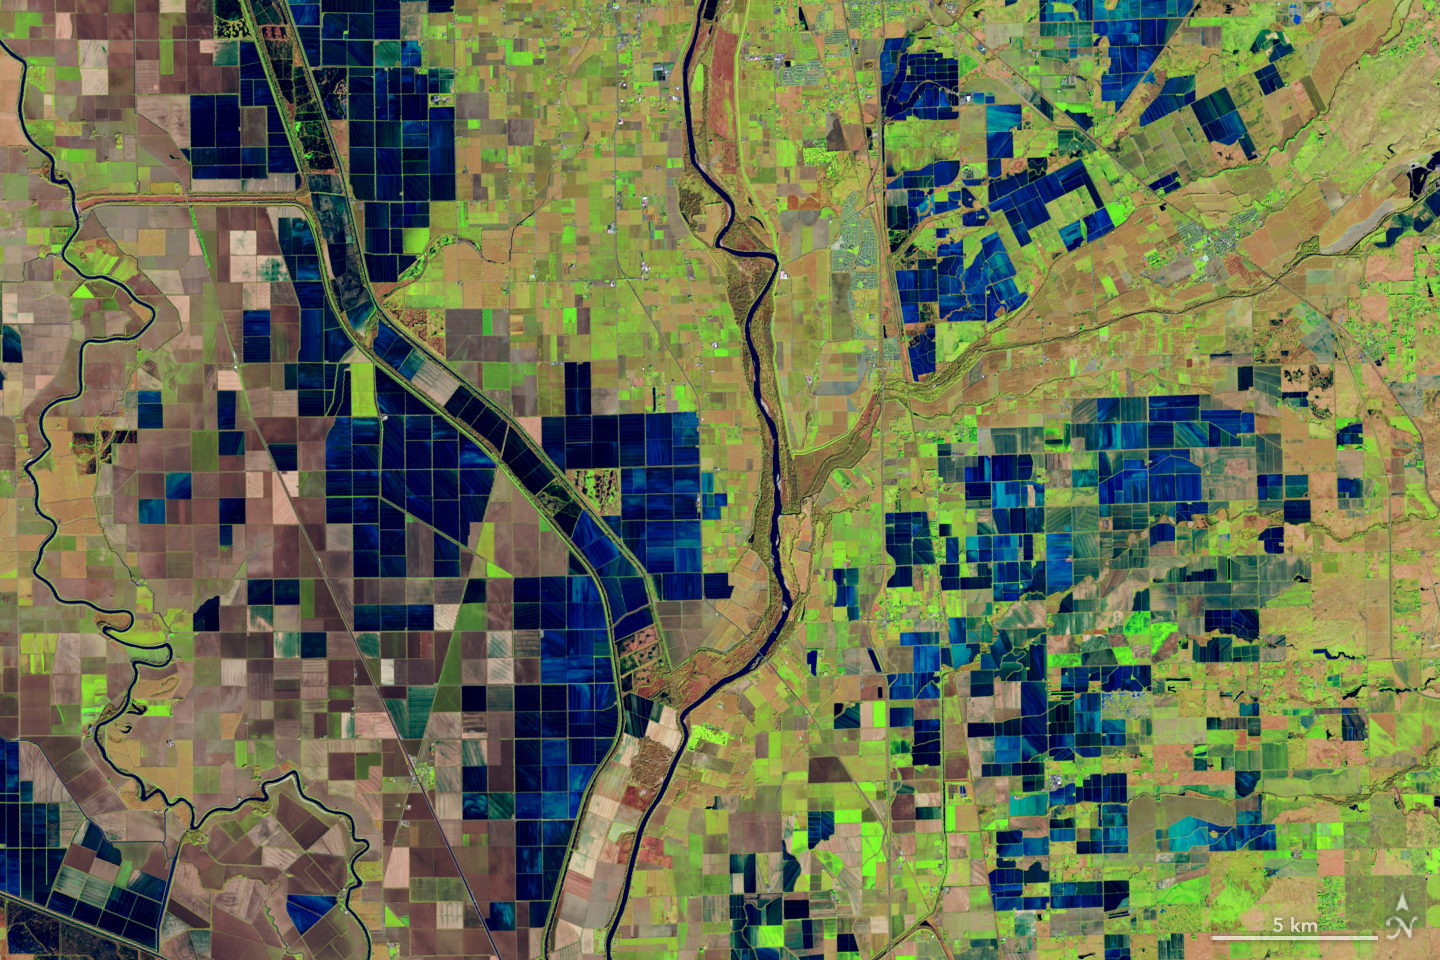
This satellite image centers the meandering Sacramento river surrounded by rice fields. The fields are broken into primarily square and rectangular areas with the fields nearest the river being full of green and brown vegetation, and farther from the river they are flooded and appear dark blue.
This is a false-color image, acquired December 26, 2018, with the OLI (Operational Land Imager) on Landsat 8, and shows flooded rice fields along the Sacramento and Feather Rivers. Inundated fields appear dark blue; vegetation is bright green.  
NASA Earth Observatory / Lauren Dauphin

As the world looks for sustainable solutions, a system tapping into NASA satellite data for water management has passed a critical test.

Called OpenET, the system uses an ensemble of six satellite-driven models that harness publicly available data from the Landsat program to calculate evapotranspiration (ET)—the movement of water vapor from soil and plant leaves into the atmosphere. OpenET does this on a field-level scale that is greatly improving the way farmers, ranchers, and water resource managers steward one of Earth’s most precious resources.

Researchers have now conducted a large-scale analysis of how well OpenET is tracking evapotranspiration over crops and natural landscapes. The team compared OpenET data with measurements from 152 sites with ground-based instruments across the United States. In agricultural areas, OpenET calculated evapotranspiration with high accuracy, especially for annual crops such as wheat, corn, soy, and rice. The researchers reported their findings on January 15 in Nature Water.

“I was pleasantly surprised by the results,” said John Volk, lead author of the study and assistant research scientist and software engineer at Desert Research Institute in Reno, Nev. “The accuracy in croplands was quite strong, particularly in western arid regions, which are important areas for agriculture and have water sustainability challenges.”

That’s welcome news for regions where OpenET data is already being put to work. In Northern California’s Sacramento-San Joaquin Delta, water resource managers are using OpenET to help farmers comply with state rules requiring them to report aspects of their water use. The new study “gives us more confidence that these numbers are accurate, and that OpenET is continually improving over time,” said Lindsay Kammeier, a senior engineer with the California State Water Board in Sacramento, who was not involved in the new research.

“ET is notoriously difficult to calculate,” she added. “Having a really accurate number helps us to make decisions to manage the environment, manage for agricultural uses, and manage for urban uses better and from a common understanding.”

Tracking the Invisible Movement of Water

While many people are familiar with what one inch of rainfall means, few stop to think about one inch of evapotranspiration returning to the atmosphere, said Forrest Melton, the OpenET project scientist at NASA’s Ames Research Center in California’s Silicon Valley. “OpenET is working to make the unseen process of evapotranspiration as easy to track as checking the amount of rainfall in the daily weather forecast.”

Evapotranspiration is the natural process in which water moves to the atmosphere from the surface. The term combines evaporation—water changing from liquid to gas (vapor) and rising from soil, lakes, and oceans—and transpiration, the “exhaling” by plants as they release moisture back into the air. After precipitation, evapotranspiration is one of the most important factors for estimating how much water is available for crops or other plants.

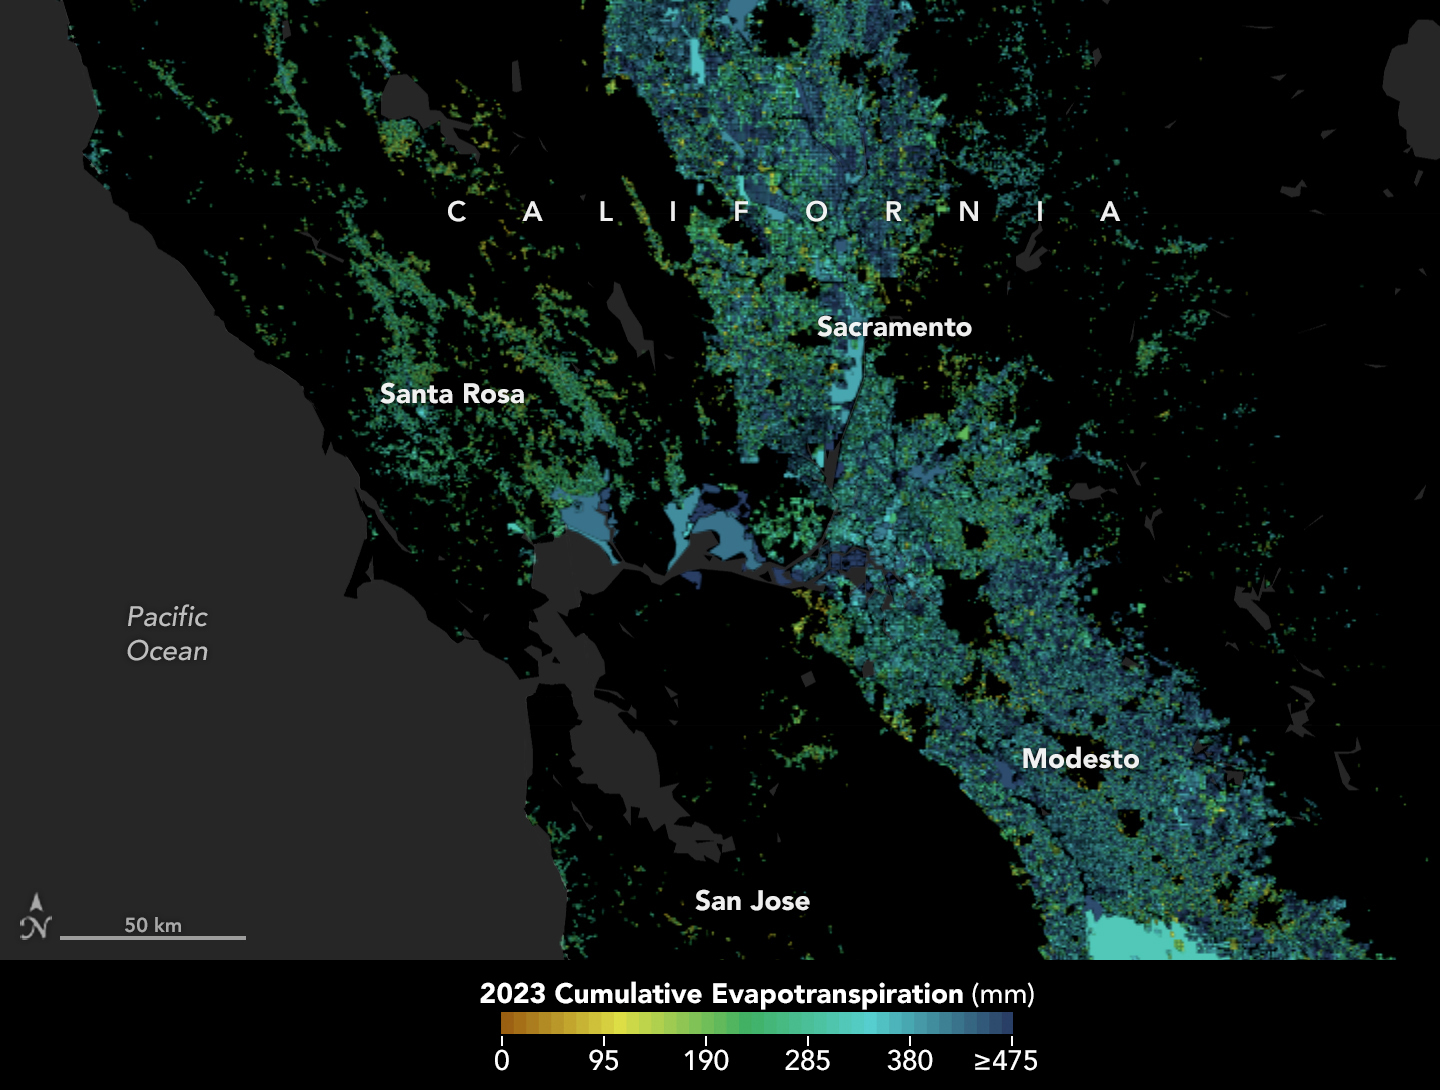
This map shows evapotranspiration levels across Central California including the Bay Area. Darker blue can be seen in the Central Valley.
In California, state officials and farmers are using satellite data through OpenET to track evapotranspiration to better manage water resources. The process is a window into the water consumed by plants and crops, such as those grown in the Central Valley.
NASA Earth Observatory using openetdata.org

For farmers and water managers, accurate data provides a measure of the amount of water required through irrigation to replace the water that has been consumed by evapotranspiration. Knowing precisely how much water is available helps people give plants the moisture they need to flourish, without needing to apply too much. And that, in turn, can help save money for water and for the electricity used to pump water for irrigation.

But all that rising water vapor is invisible, making it difficult and expensive to track on the ground.

Farmers, scientists, and others previously relied on estimates of “potential evaporation” based on temperature, humidity, and other weather data. Or they turned to ground-based stations such as flux towers, equipped with sensors that monitor carbon dioxide, water vapor, and the exchange of heat between Earth’s surface and the atmosphere—a process crucial to calculating evapotranspiration.

But while they tend to be highly accurate, flux towers are expensive to set up and maintain, so there are a limited number, and their data is local and cannot represent wider regions. That’s where calculating evapotranspiration from space comes in. Satellites pass over the same areas regularly, offering consistent monitoring.

OpenET’s primary observations come from the Landsat 8 and 9 satellites, a partnership between NASA and the U.S. Geological Survey. The satellites combine data on land surface temperatures and the greenness of plants, among other things. Cooler land surface temperatures over areas with healthier, denser vegetation, for example, usually indicate higher levels of transpiration. 

That data is then fed into models to calculate evapotranspiration at high resolution—about a quarter of an acre for each image pixel.

The new results show that for agricultural lands, OpenET data for monthly, growing season, and annual timescales had an average error rate of about 10-20%.

The OpenET consortium includes NASA, USGS, and the U.S. Department of Agriculture working with Desert Research Institute and nearly a dozen other universities, Environmental Defense Fund, and Google Earth Engine.

For more information, go to: https://openetdata.org/

By: Emily DeMarco, NASA Earth Science Division

About the Author

Emily DeMarco

Share

Details

Last Updated
Feb 01, 2024
Keep Exploring

Discover More Topics From NASA

Powered by WPeMatico

Get The Details…