NASA’s ESCAPADE Snaps Family Portrait of Earth, Moon
On July 3, one of NASA’s two Mars-destined ESCAPADE (Escape and Plasma Acceleration and Dynamics Explorers) spacecraft captured photos of Earth and the Moon in visible and thermal infrared light. At the time, the spacecraft was 363,250 miles (584,600 kilometers) from Earth and 115,600 miles (186,100 kilometers) from the Moon, making the Moon appear relatively large.
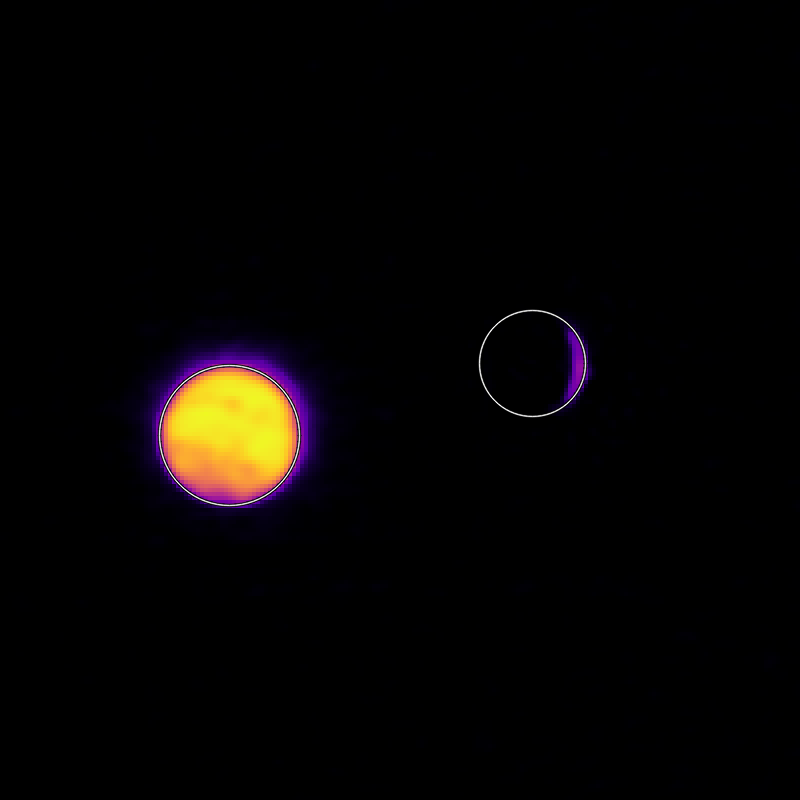
Taken with the Sun only partly illuminating Earth and the Moon, the visible light image shows the two bodies as crescents, with only around 8% of each face sunlit. Yet in the thermal infrared image, the shadowed hemisphere of Earth is illuminated by its own heat from both the atmosphere and surface, glowing at minus 10 to minus 44 degrees Fahrenheit (250 to 280 kelvins). Without the insulating blankets of oceans and atmospheres, the Moon’s far side remains at a much cooler minus 280 degrees Fahrenheit (100 kelvins).


visible light
thermal infrared light
ESCAPADE Photos of Earth and Moon
July 3, 2026
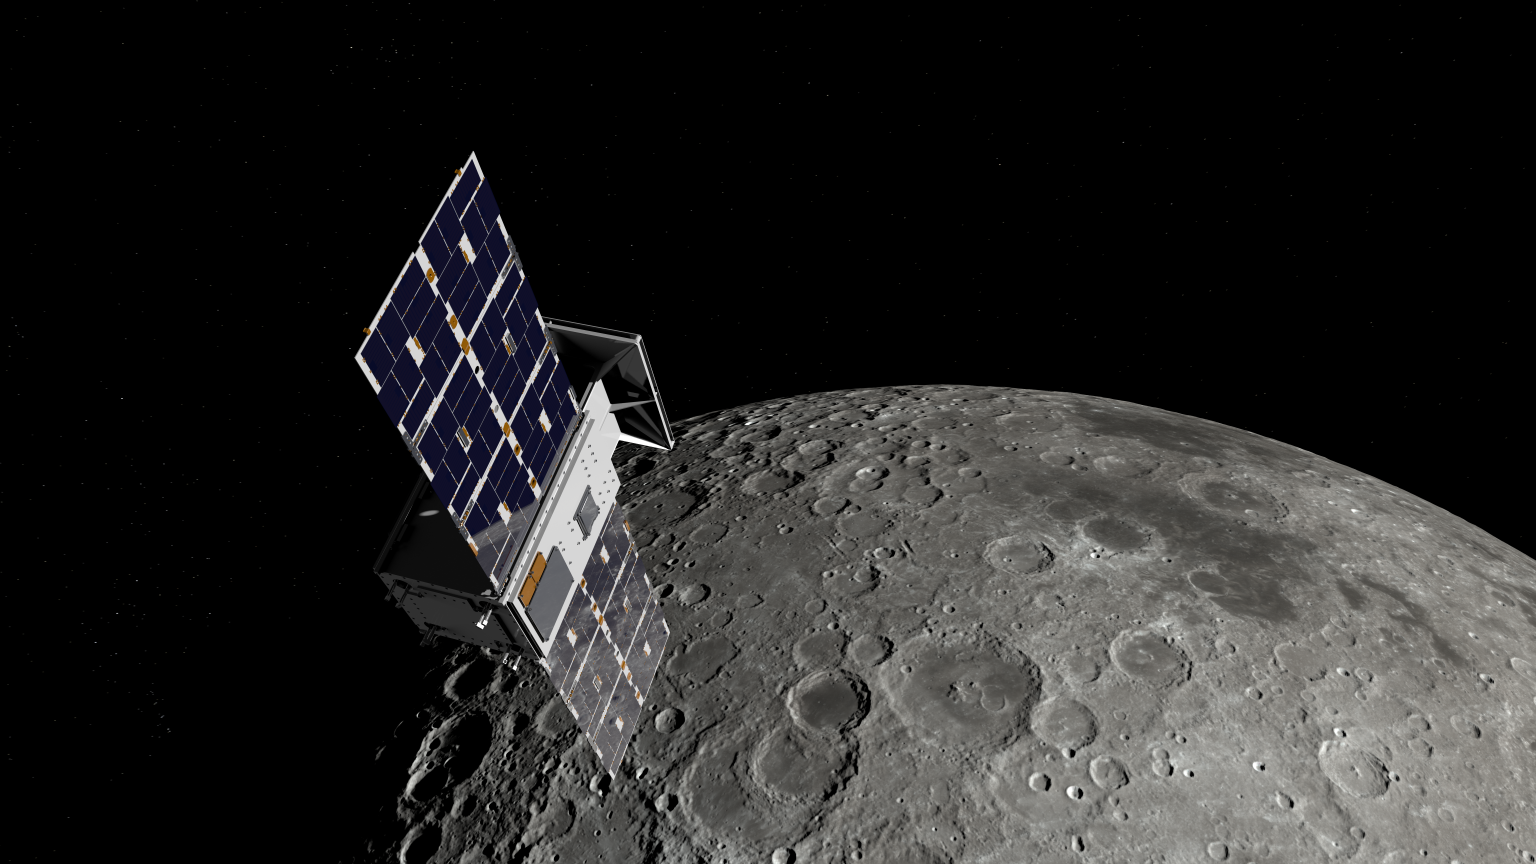
The ESCAPADE mission used its Visible and Infrared Observation System cameras, provided by Northern Arizona University in Flagstaff, to capture the images, which are more than just road trip photo album snaps.
“We are thrilled that ESCAPADE was able to accommodate these excellent space-qualified cameras which will search for visible Martian aurora and investigate thermal properties of the Martian surface and atmosphere,” said Rob Lillis, the mission’s principal investigator at the University of California, Berkeley. “Since Earth and the Moon are well-known targets, imaging them provides an important calibration check for ESCAPADE’s cameras.”
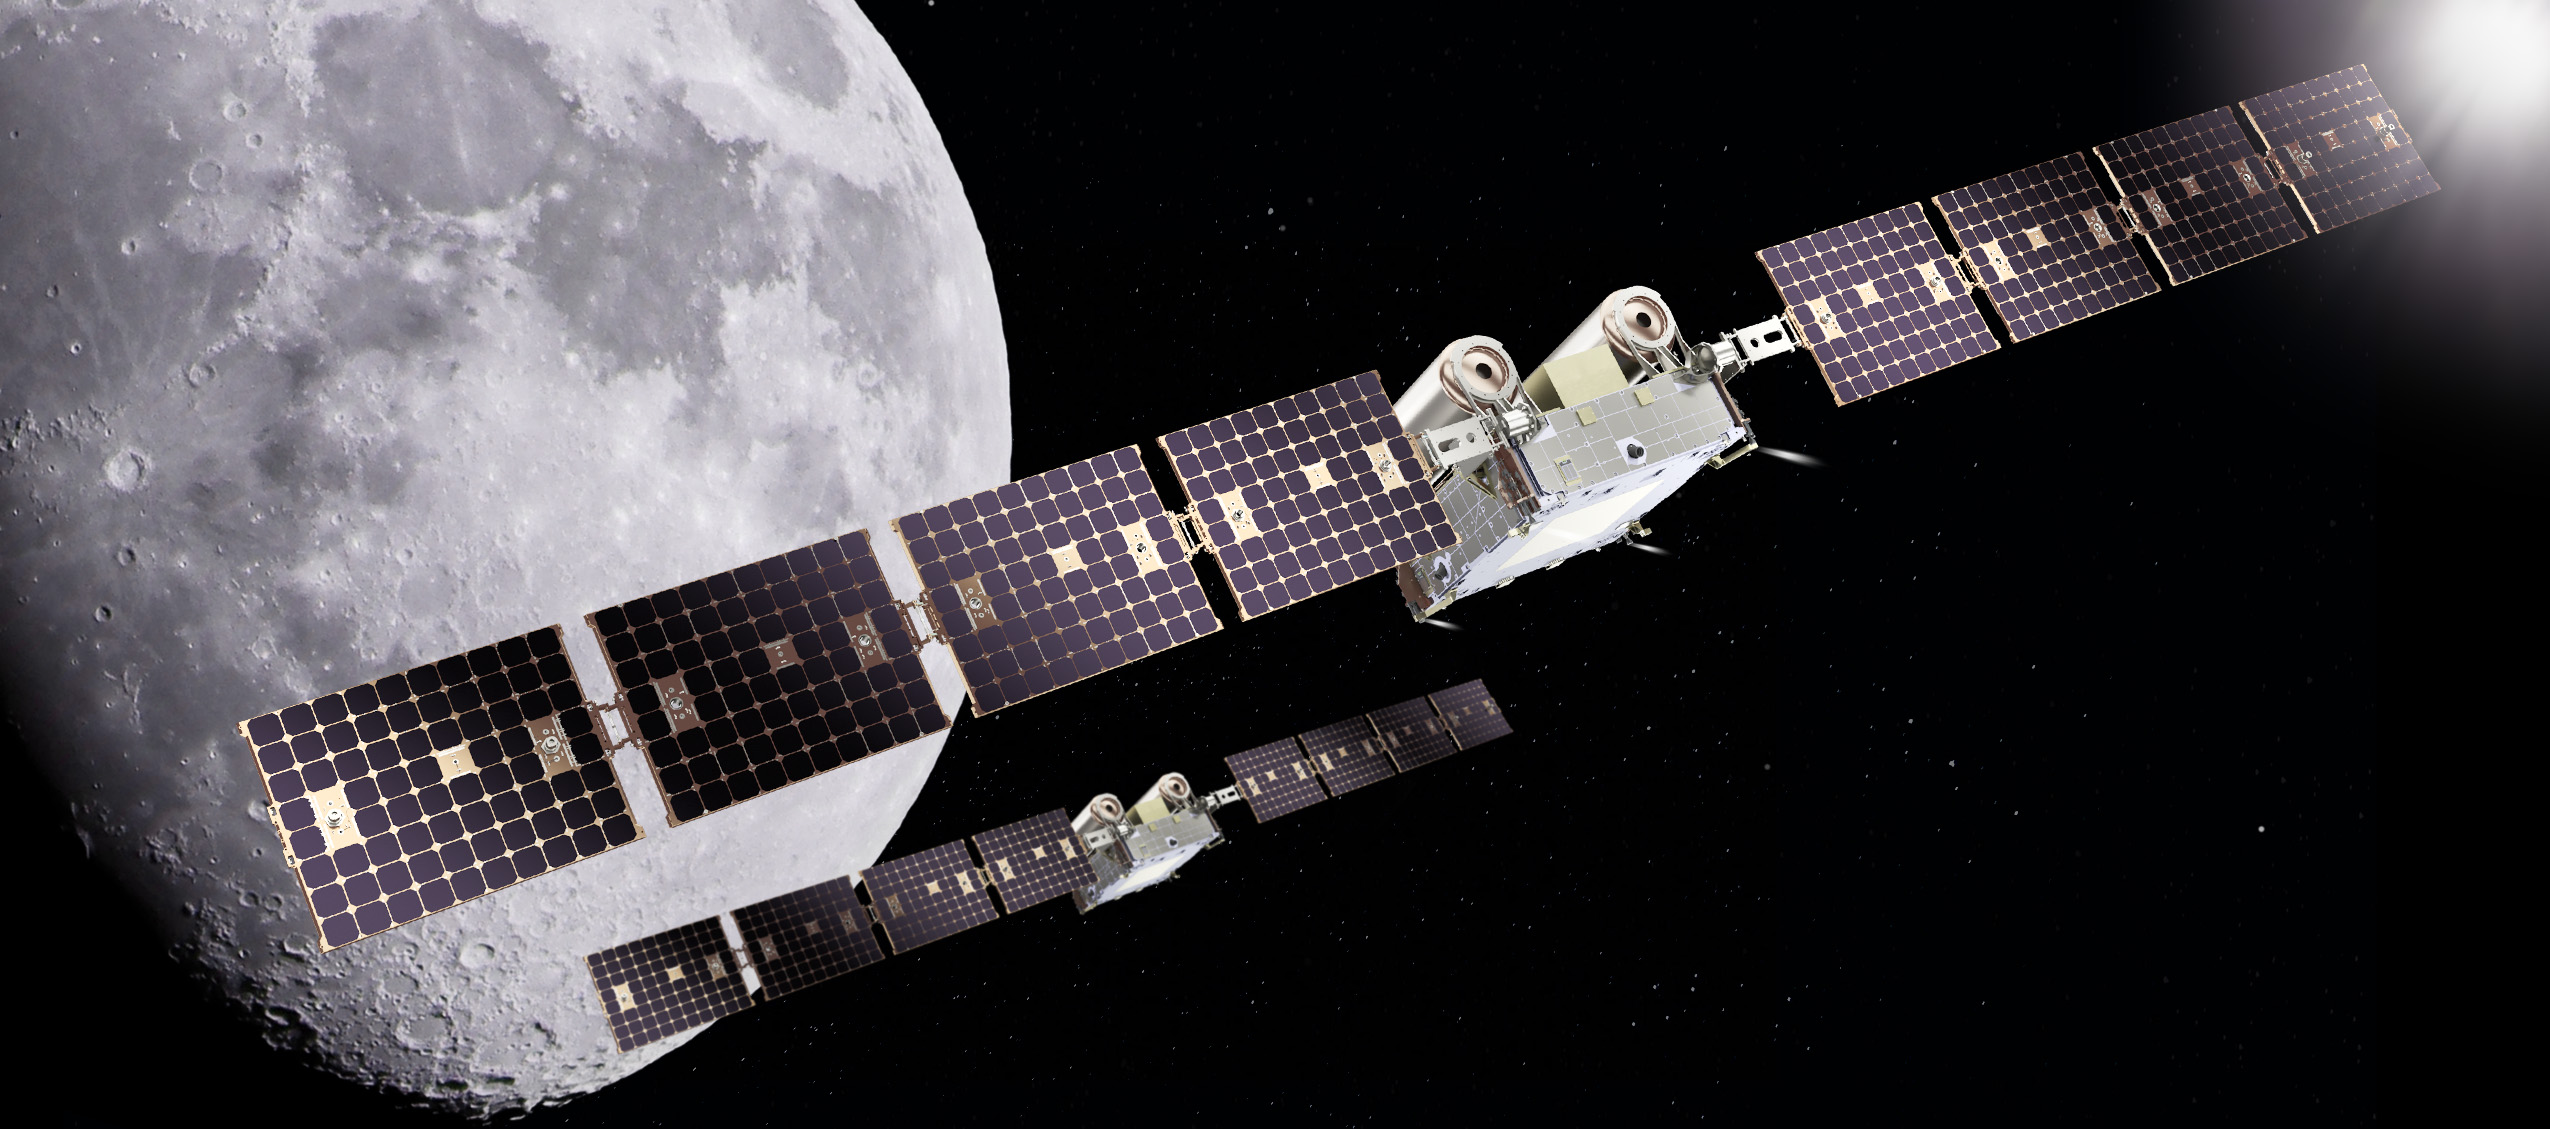
The ESCAPADE spacecraft, which were built by Rocket Lab, are currently in a “loiter” orbit around Lagrange point 2, a location in space about a million miles from Earth. In November 2026, the spacecraft will fly by Earth to use the planet’s gravity to slingshot their way to Mars. When the spacecraft arrive in September 2027, they will study how a million-mile-per-hour stream of material flowing from the Sun, known as solar wind, interacts with the Martian environment and how that drives atmospheric loss at the Red Planet.
The ESCAPADE mission is funded by NASA’s Heliophysics Division and is part of the NASA Small Innovative Missions for Planetary Exploration program. The UC Berkeley’s Space Sciences Laboratory leads the mission with key partners Rocket Lab; NASA’s Goddard Space Flight Center in Greenbelt, Maryland; Embry-Riddle Aeronautical University; Advanced Space; and Blue Origin.
By Mara Johnson-Groh
NASA’s Goddard Space Flight Center, Greenbelt, Md.
Powered by WPeMatico