NASA Mission Excels at Spotting Greenhouse Gas Emission Sources

NASA Mission Excels at Spotting Greenhouse Gas Emission Sources

5 min read

NASA Mission Excels at Spotting Greenhouse Gas Emission Sources
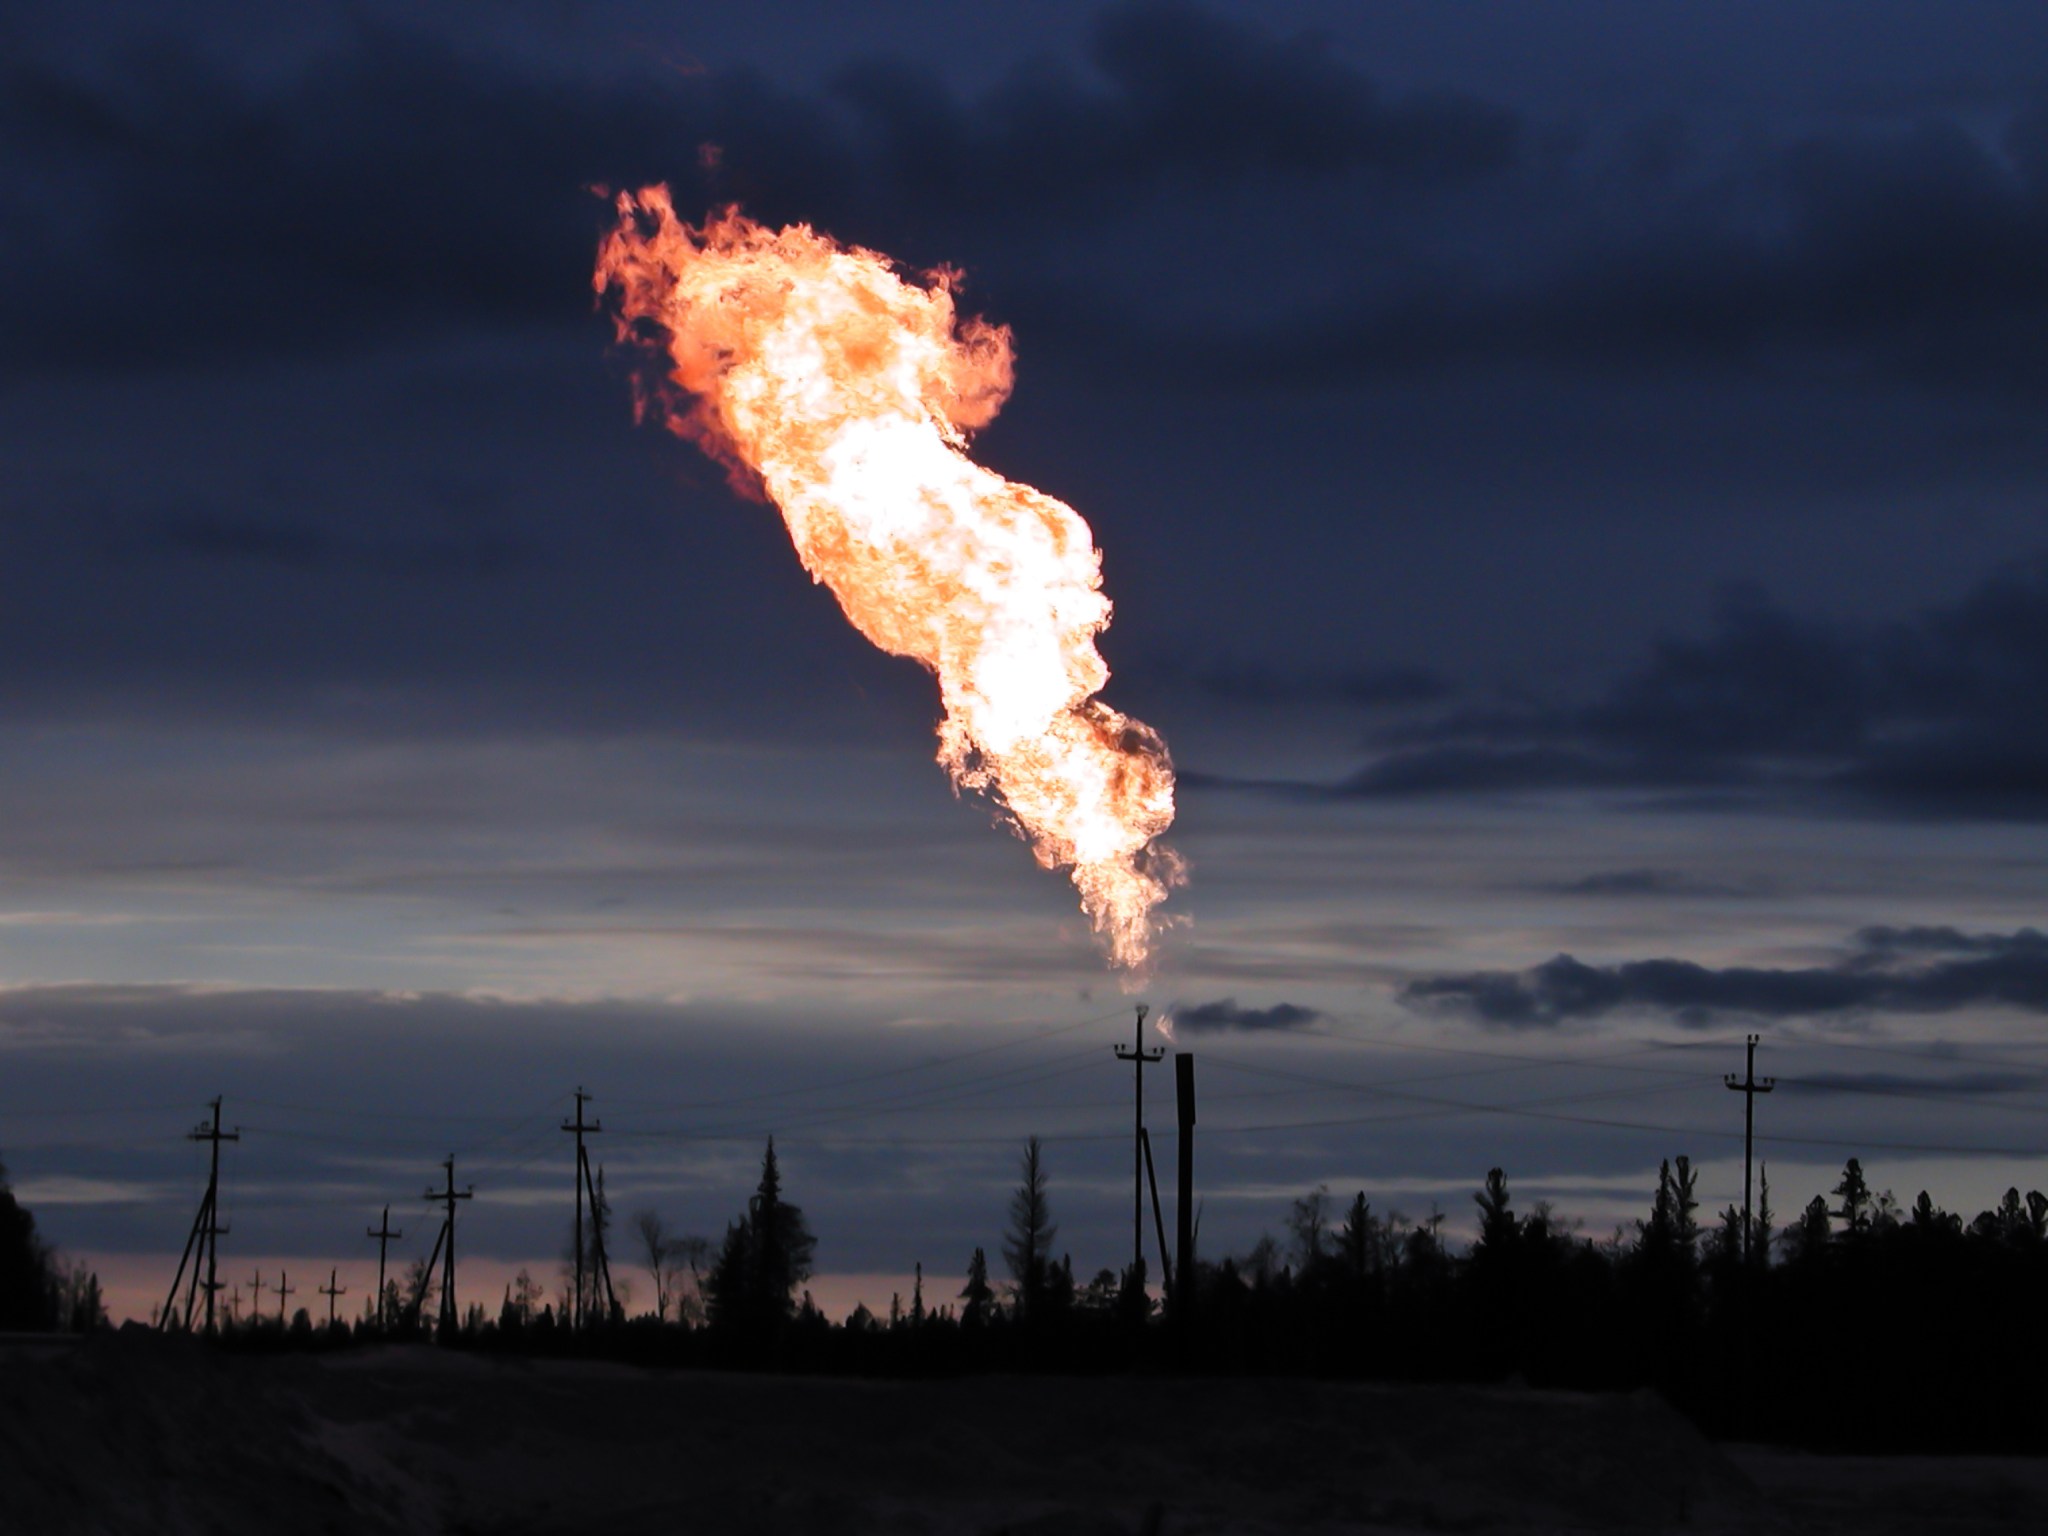
Picture of burning oil gas flare outdoors
Flaring, in which excess natural gas is intentionally burned into the air, is one way methane is released from oil and gas facilities. NASA’s EMIT mission, in more than a year in operation, has shown a proficiency at spotting emissions of methane and other greenhouse gases from space.
Adobe Stock/Ilya Glovatskiy

Since launching 16 months ago, the EMIT imaging spectrometer aboard the International Space Station has shown an ability to detect more than just surface minerals.

More than a year after first detecting methane plumes from its perch aboard the International Space Station, data from NASA’s EMIT instrument is now being used to identify point-source emissions of greenhouse gases with a proficiency that has surprised even its designers.

Short for Earth Surface Mineral Dust Source Investigation, EMIT was launched in July 2022 to map 10 key minerals on the surface of the world’s arid regions. Those mineral-related observations, which are already available to researchers and the public, will help improve understanding of how dust that gets lofted into the atmosphere affects climate.

Detecting methane was not part of EMIT’s primary mission, but the instrument’s designers did expect the imaging spectrometer to have the capability. Now, with more than 750 emissions sources identified since August 2022 – some small, others in remote locations, and others persistent in time – the instrument has more than delivered in that regard, according to a new study published in Science Advances.

“We were a little cautious at first about what we could do with the instrument,” said Andrew Thorpe, a research technologist on the EMIT science team at NASA’s Jet Propulsion Laboratory in Southern California and the paper’s lead author. “It has exceeded our expectations.”
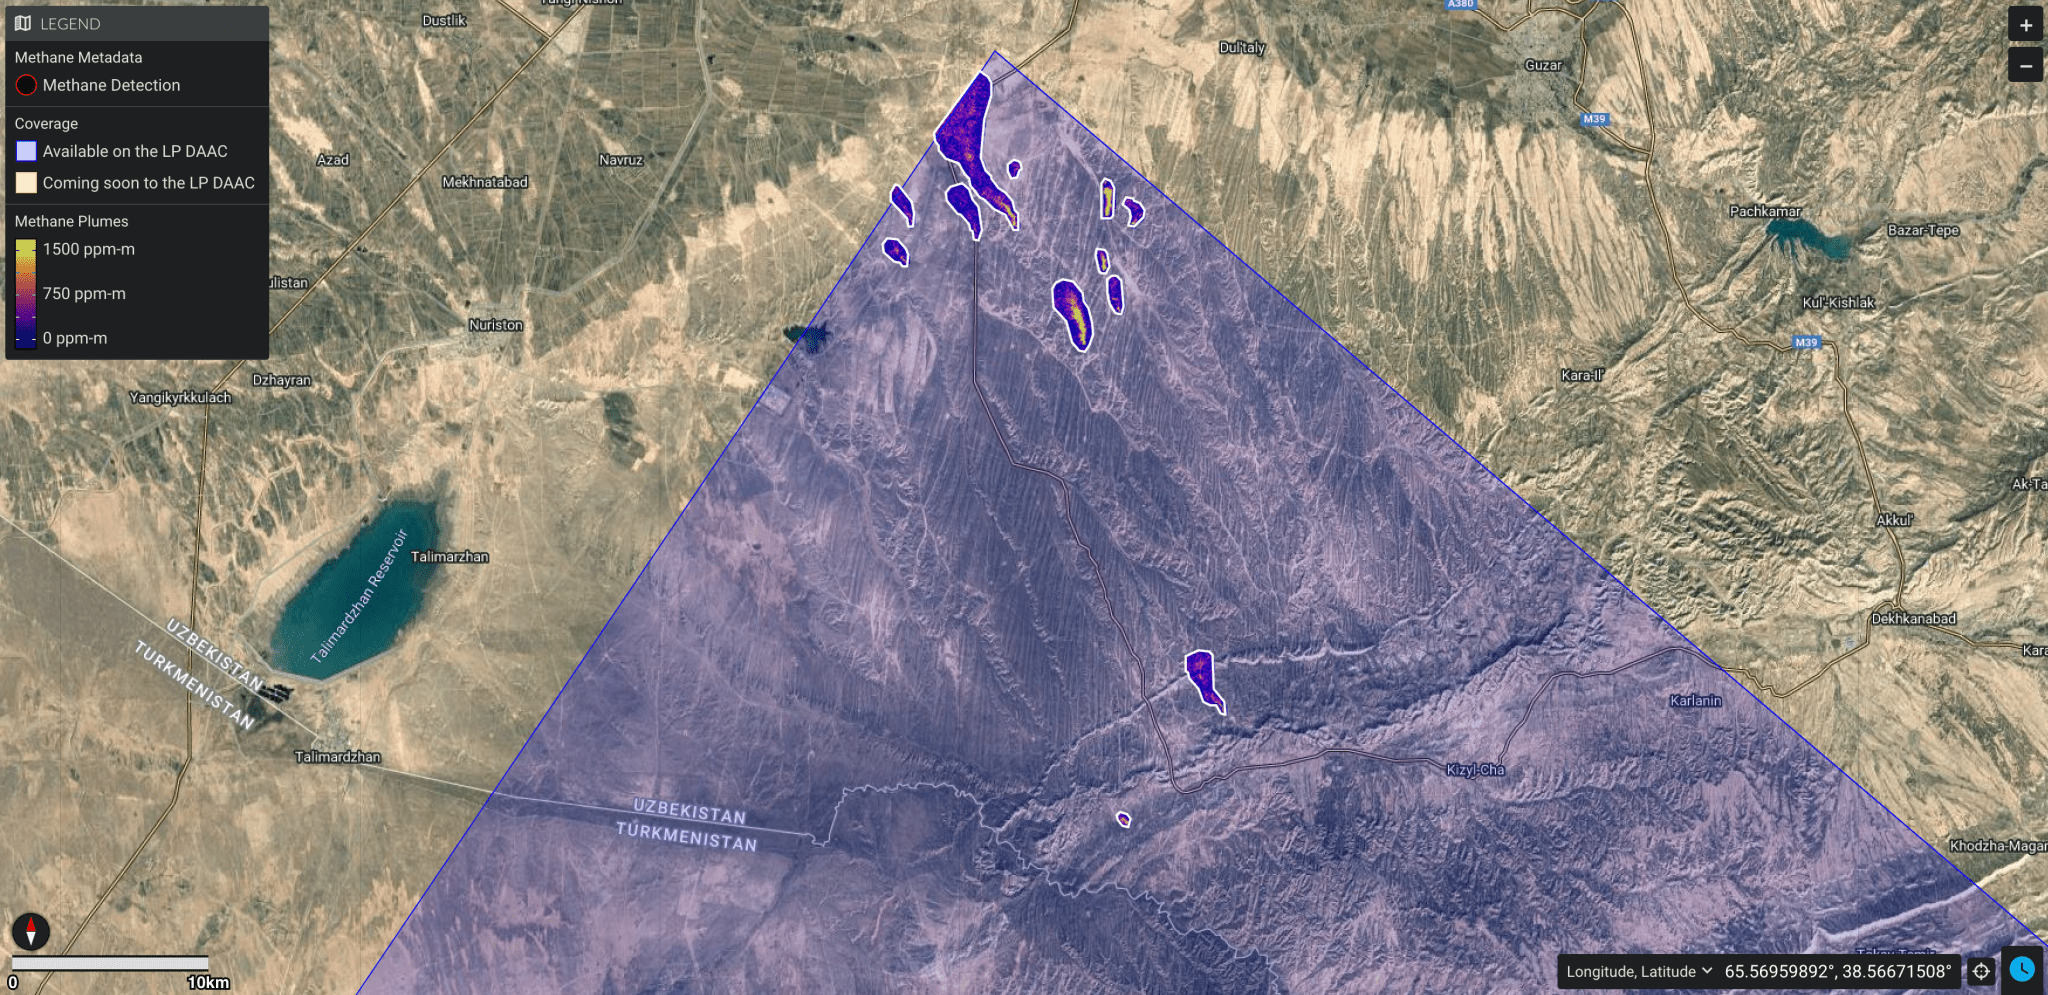
EMIT identified a cluster of 12 methane plumes
EMIT identified a cluster of 12 methane plumes within a 150-square-mile (400-square-kilometer) area of southern Uzbekistan on Sept. 1, 2022. The instrument captured the cluster within a single shot, called a scene by researchers.
NASA/JPL-Caltech

By knowing where methane emissions are coming from, operators of landfills, agriculture sites, oil and gas facilities, and other methane producers have an opportunity to address them. Tracking human-caused emissions of methane is key to limiting climate change because it offers a comparatively low-cost, rapid approach to reducing greenhouse gases. Methane lingers in the atmosphere for about a decade, but during this span, it’s up to 80 times more powerful at trapping heat than carbon dioxide, which remains for centuries.

Surprising Results

EMIT has proven effective at spotting emission sources both big (tens of thousands of pounds of methane per hour) and surprisingly small (down to the hundreds of pounds of methane per hour). This is important because it permits identification of a greater number of “super-emitters” – sources that produce disproportionate shares of total emissions.

The new study documents how EMIT, based on its first 30 days of greenhouse gas detection, can observe 60% to 85% of the methane plumes typically seen in airborne campaigns.
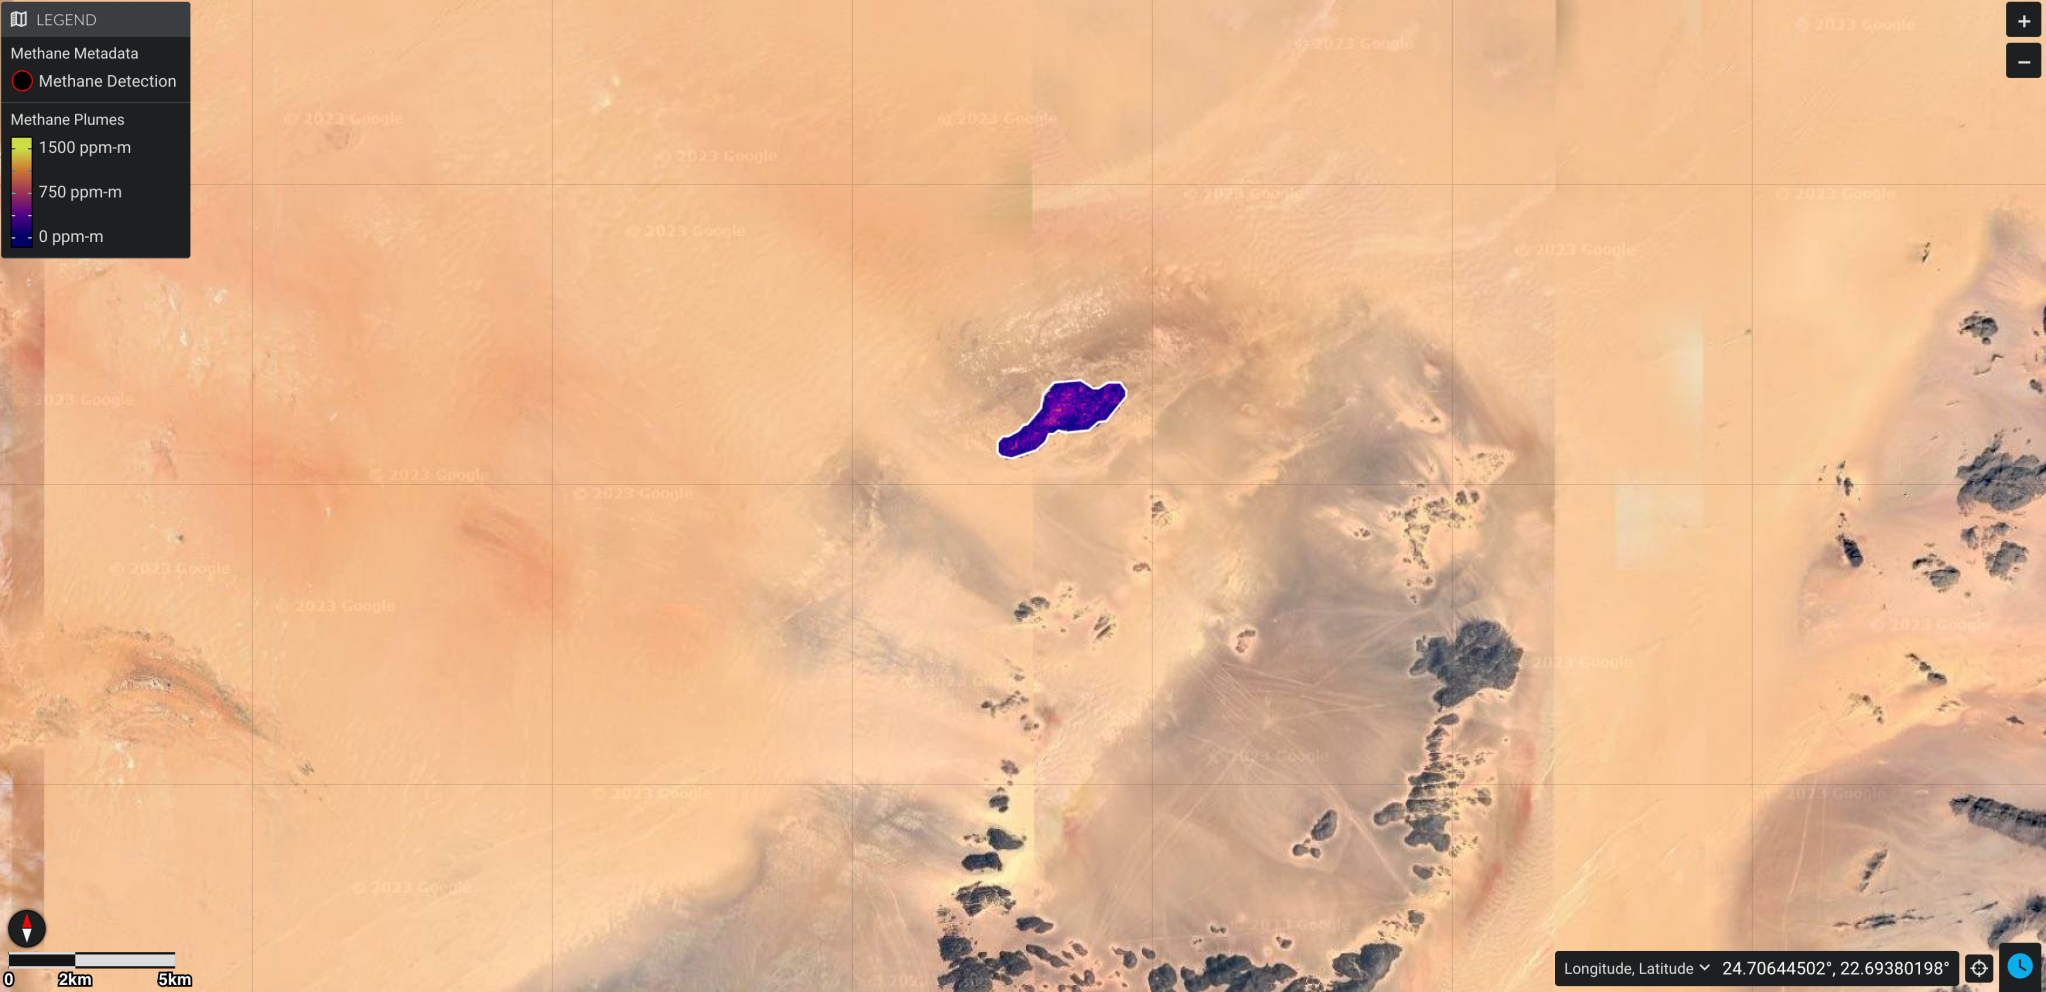
southeastern Libya
In a remote corner of southeastern Libya, EMIT on Sept. 3, 2022, detected a methane plume that was emitting about 979 pounds (444 kilograms) per hour. It’s one of the smallest sources detected so far by the instrument.
NASA/JPL-Caltech

From several thousand feet above the ground, methane-detecting instruments on aircraft are more sensitive, but to warrant sending a plane, researchers need prior indication that they’ll detect methane. Many areas are not examined because they are considered too remote, too risky, or too costly. Additionally, the campaigns that do occur cover relatively limited areas for short periods.

On the other hand, from about 250 miles (400 kilometers) altitude on the space station, EMIT collects data over a large swath of the planet – specifically the arid regions that fall between 51.6 degrees north and south latitude. The imaging spectrometer captures 50-mile-by-50-mile (80-kilometer-by-80-kilometer) images of the surface – researchers call them “scenes” – including many regions that have been beyond the reach of airborne instruments.

This time-lapse video shows the Canadarm2 robotic arm of the International Space Station maneuvering NASA’s EMIT mission onto the exterior of the station. Extraction from the SpaceX Dragon spacecraft began around 5:15 p.m. PDT on July 22 and was completed at 10:15 a.m. PDT on July 24. Portions of the installation have been omitted, while others have been speeded up. Credit: NASA

“The number and scale of methane plumes measured by EMIT around our planet is stunning,” said Robert O. Green, a JPL senior research scientist and EMIT’s principal investigator.

Scene-by-Scene Detections

To support source identification, the EMIT science team creates maps of methane plumes and releases them on a website, with underlying data available at the joint NASA-United States Geological Survey Land Processes Distributed Active Archive Center (LP DAAC). The mission’s data is available for use by the public, scientists, and organizations.

Since EMIT began collecting observations in August 2022, it has documented over 50,000 scenes. The instrument spotted a cluster of emissions sources in a rarely studied region of southern Uzbekistan on Sept. 1, 2022, detecting 12 methane plumes totaling about 49,734 pounds (22,559 kilograms) per hour.

In addition, the instrument has spotted plumes far smaller than expected. Captured in a remote corner of southeastern Libya on Sept. 3, 2022, one of the smallest sources so far was emitting 979 pounds (444 kilograms) per hour, based on estimates of local wind speed.

More About the Mission

EMIT was selected from the Earth Venture Instrument-4 solicitation under the Earth Science Division of NASA’s Science Mission Directorate and was developed at NASA’s Jet Propulsion Laboratory, which is managed for the agency by Caltech in Pasadena, California. The instrument’s data is available at the NASA Land Processes Distributed Active Archive Center for use by other researchers and the public.

To learn more about the mission, visit:

https://earth.jpl.nasa.gov/emit/

News Media Contacts

Andrew Wang / Jane J. Lee
Jet Propulsion Laboratory, Pasadena, Calif.
626-379-6874 / 818-354-0307
andrew.wang@jpl.nasa.gov / jane.j.lee@jpl.nasa.gov

2023-172

Powered by WPeMatico

Get The Details…
Anthony Greicius
NASA Researcher Honored by Goddard Tech Office for Earth Science Work

NASA Researcher Honored by Goddard Tech Office for Earth Science Work

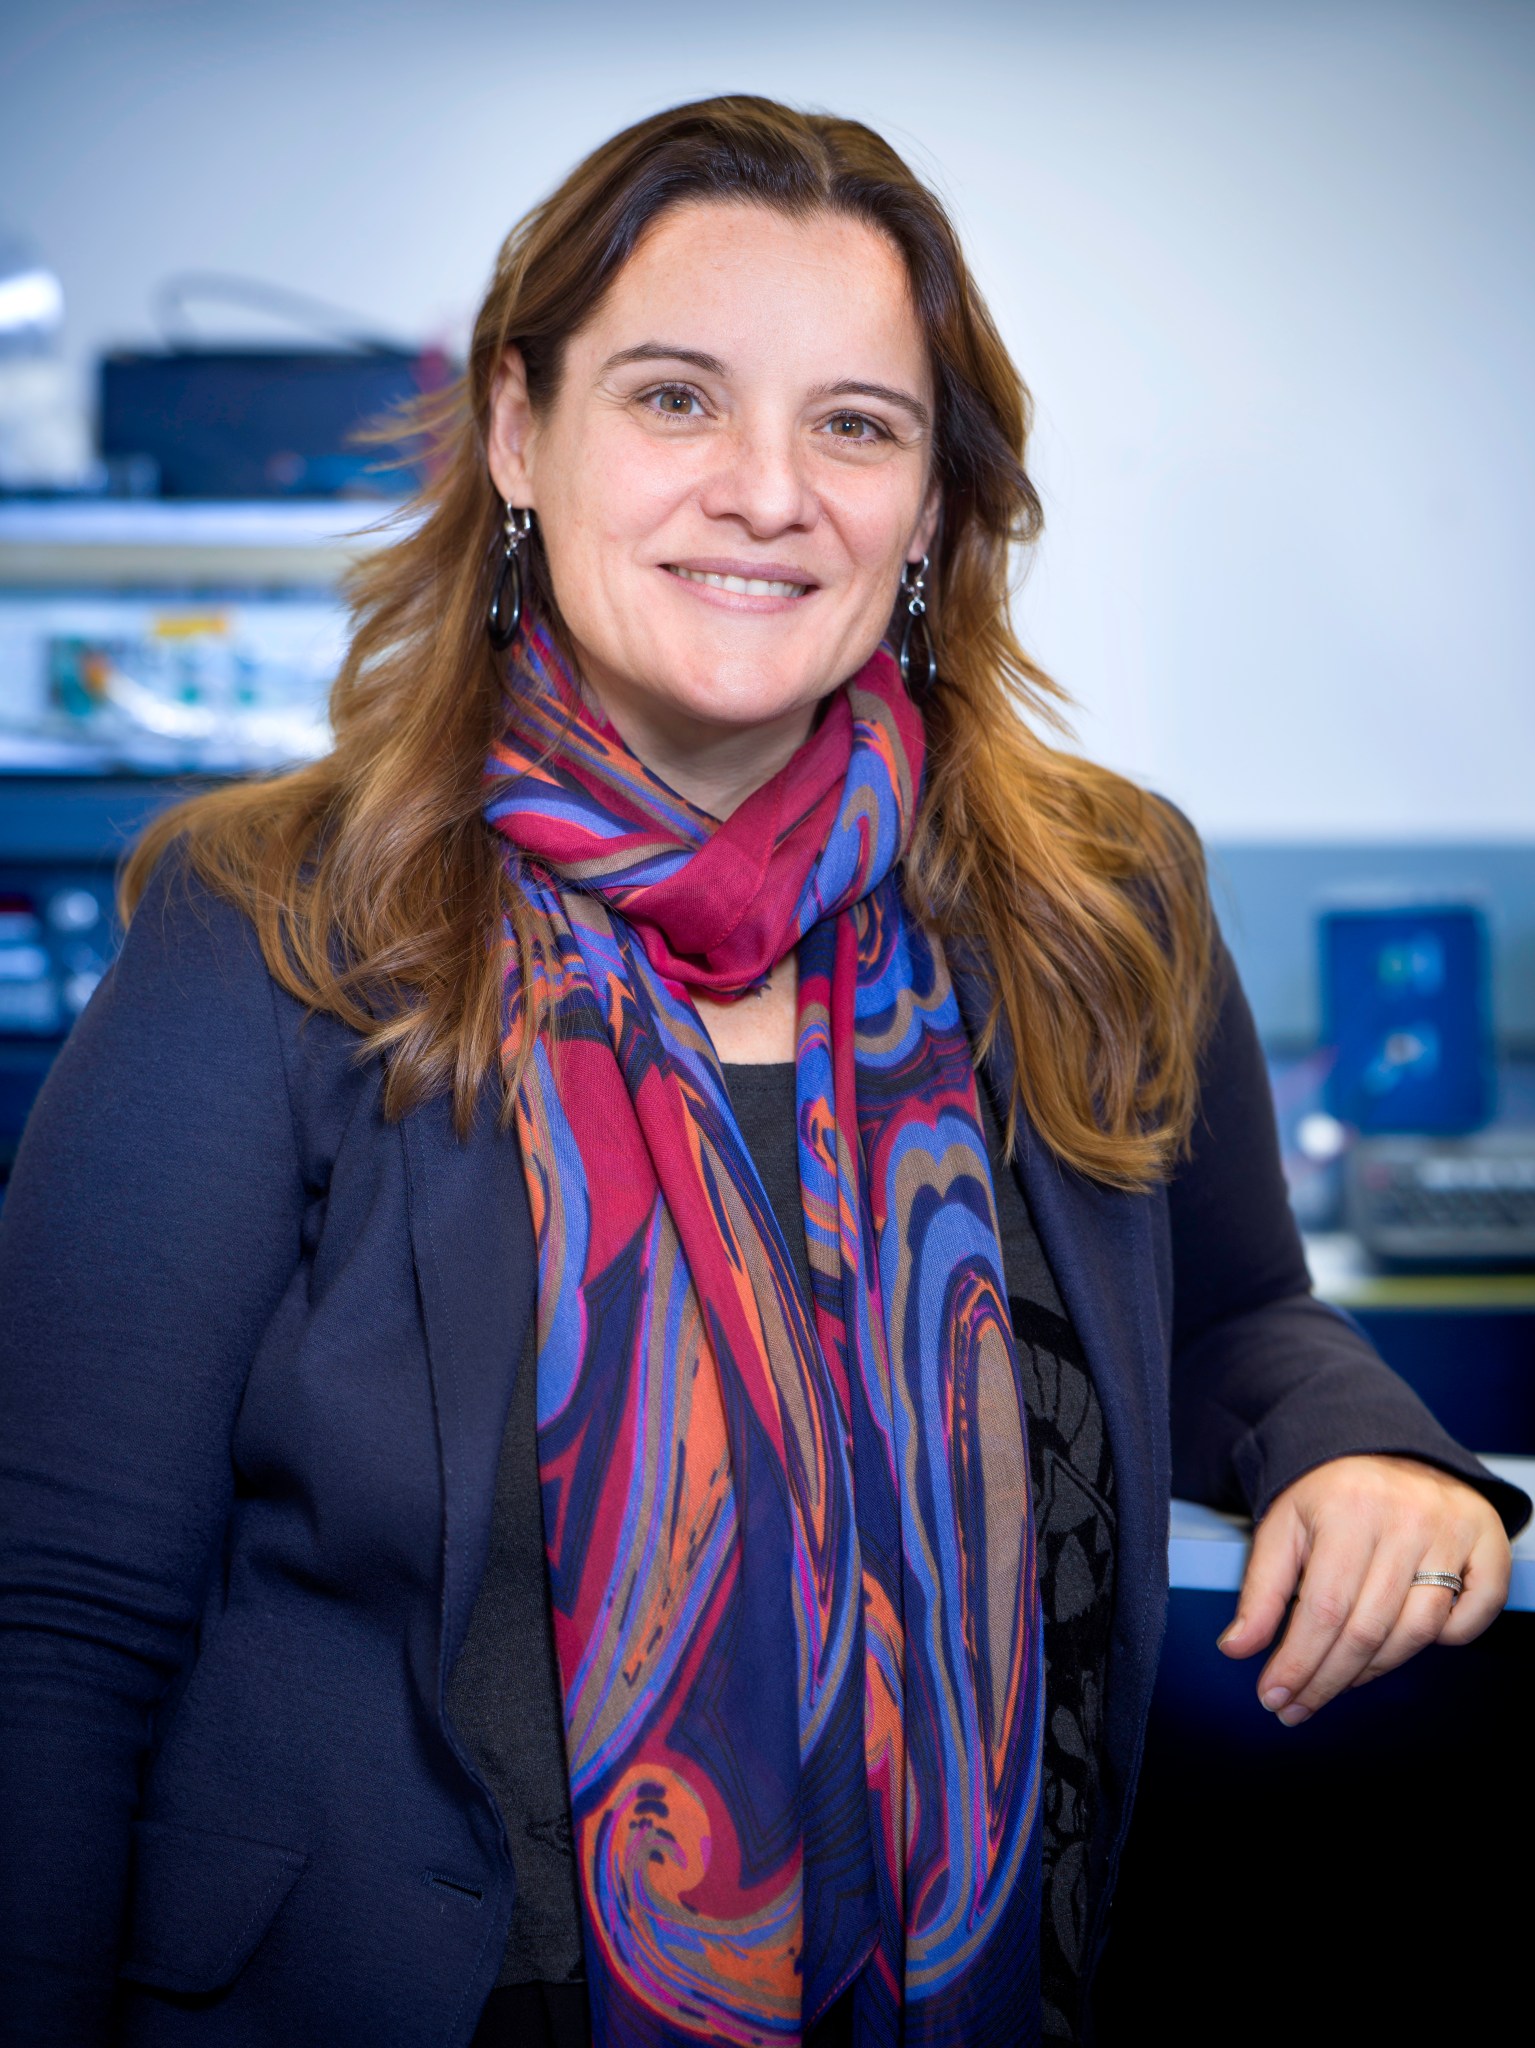
Earth science researcher Dr. Antonia Gambacorta earned the 2023 Goddard IRAD Technology Leadership award for pioneering new ways to measure lower layers of Earth’s atmosphere from space.

The award from the chief technologist of NASA’s Goddard Space Flight Center in Greenbelt, Maryland, recognizes Gambacorta’s work demonstrating how hyperspectral microwave sounding, the measurement of hundreds of thousands of wavelengths of microwave light, could dissect Earth’s atmospheric planetary boundary layer (PBL). She also conceptualized a microwave photonics radiometer instrument to reveal these measurements.

Goddard Researcher Dr. Antonia Gambacorta
NASA / Christopher Gunn

The part of Earth’s atmosphere people live in, and have the most experience studying, is the hardest to measure from space due to the volume and complex behavior of the air above it, Gambacorta said. Developing the ability to probe and measure the boundary layer on a global, routine basis is important to better understanding its connections to the rest of our atmosphere, the land surface, and the oceans.

“The unique challenge of the PBL requires a novel path forward that will bring together traditionally disparate observing system components in order to enable transformative scientific advances in Earth system science,” said fellow researcher Joseph Santanello. “To that end, Dr. Gambacorta’s efforts extend beyond individual technology developments, and are represented in her aspirational vision of PBL sounding as ‘the tie that binds.’ Just as notably, Dr. Gambacorta’s passion, enthusiasm, and respect for her colleagues has been evident through each of stage of the project’s development.”

In seeking solutions to measure the boundary layer, Gambacorta stepped up to lead Goddard’s hyperspectral microwave projects and became the face of the center’s Decadal Survey Incubation (DSI) efforts. Through multiple Internal Research and Development, or IRAD grants, she and her team performed fundamental research to show the effectiveness of hyperspectral microwave sounding, conceptualized a microwave photonics radiometer instrument, and more recently began developing a framework to integrate data from multiple sensors for boundary layer science observations.

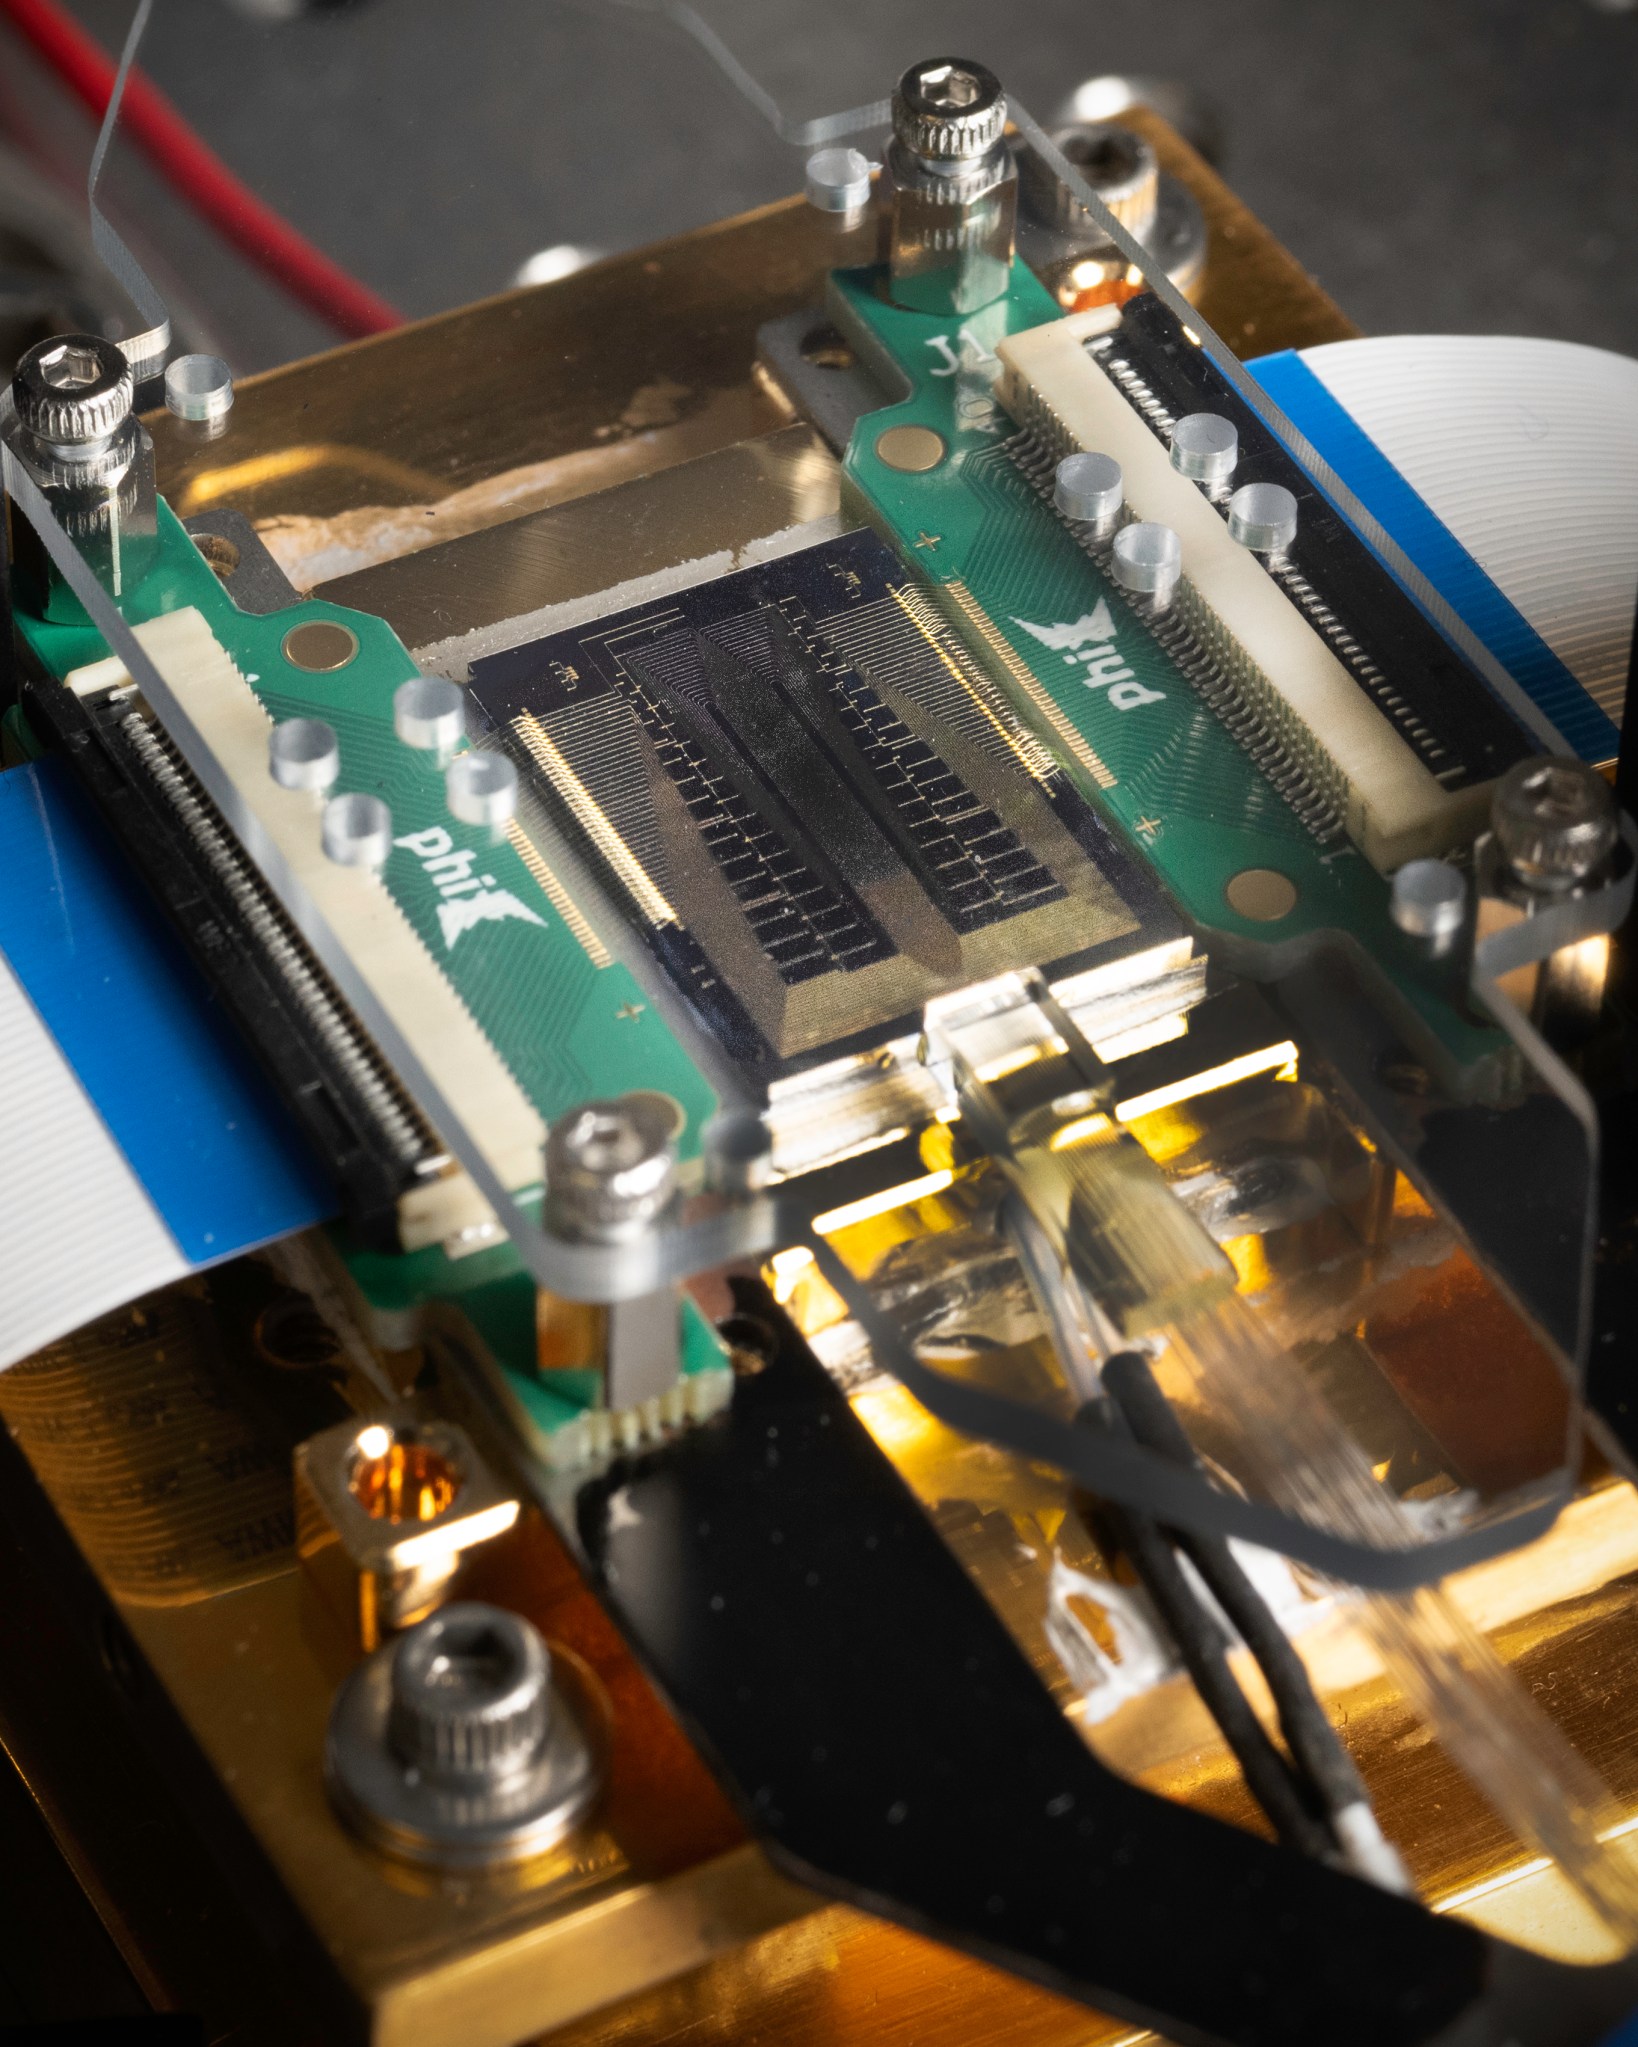
Hyperspectral Microwave Processing Chip - Goddard
Photonics Integrated Chips like this one being tested in a Goddard Lab will be able to translate microwave signals into infrared light for more efficient processing of more wavelengths than current technology. This chip can process thousands of microwave bandwidths compared to existing, much larger processors.
NASA / Christopher Gunn

“Antonia’s innovation rises above her individual successes as a capable and creative innovator,” said Goddard Chief Technologist Peter Hughes. “She capitalized on multiple programs to incubate new technology while engaging expertise from across agencies and around the world to connect to other resources.”

Her cutting-edge innovations and research earned support from NASA’s Earth Science Technology Office and from the National Oceanic and Atmospheric Administration.

Specifically, Gambacorta built on her IRAD successes to secure an Earth Science Technology Office Instrument Incubator Program (IIP) project award to further develop her team’s microwave photonics radiometer concept and DSI funding to advance the multi-sensor fusion framework. Additionally, her momentum enabled a DSI-funded airborne instrument project attempting to transform CoSMIR, Goddard’s Conical Scanning Millimeter-wave Radiometer, into a hyperspectral sensor. That project is led by up-and-coming instrument scientist Rachael Kroodsma.

This entire portfolio that Gambacorta now manages also culminated in a successful NOAA Broad Agency Announcement proposal to demonstrate hyperspectral microwave radiometry. Through her engagement with colleagues in ESTO, NOAA, and the European Organisation for the Exploitation of Meteorological Satellites, Hughes said Goddard’s hyperspectral microwave and PBL initiatives are regarded globally as the trusted strategy for understanding the planetary boundary layer. Goddard is widely viewed as a pioneer in the use of integrated photonics for Earth remote sensing due to Gambacorta’s leadership, he added.

“Antonia serves as a true inspiration to the technologists and scientists on her teams,” her colleague Santanello added. “Her innovation and contribution to Goddard and the larger community can also be measured in each of these ways.”

By Karl B. Hille

NASA’s Goddard Space Flight Center, Greenbelt, Md.

Powered by WPeMatico

Get The Details…
Karl B. Hille

NASA Wallops Supports Hypersonic Rocket Launches

NASA Wallops Supports Hypersonic Rocket Launches

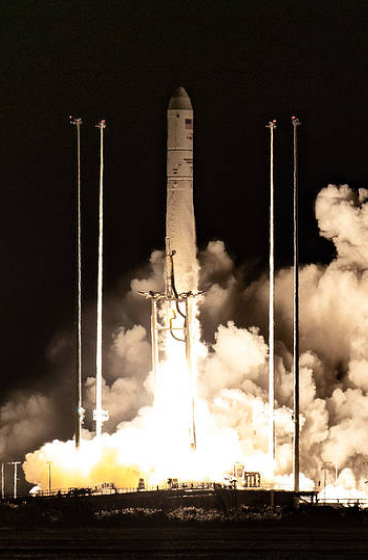
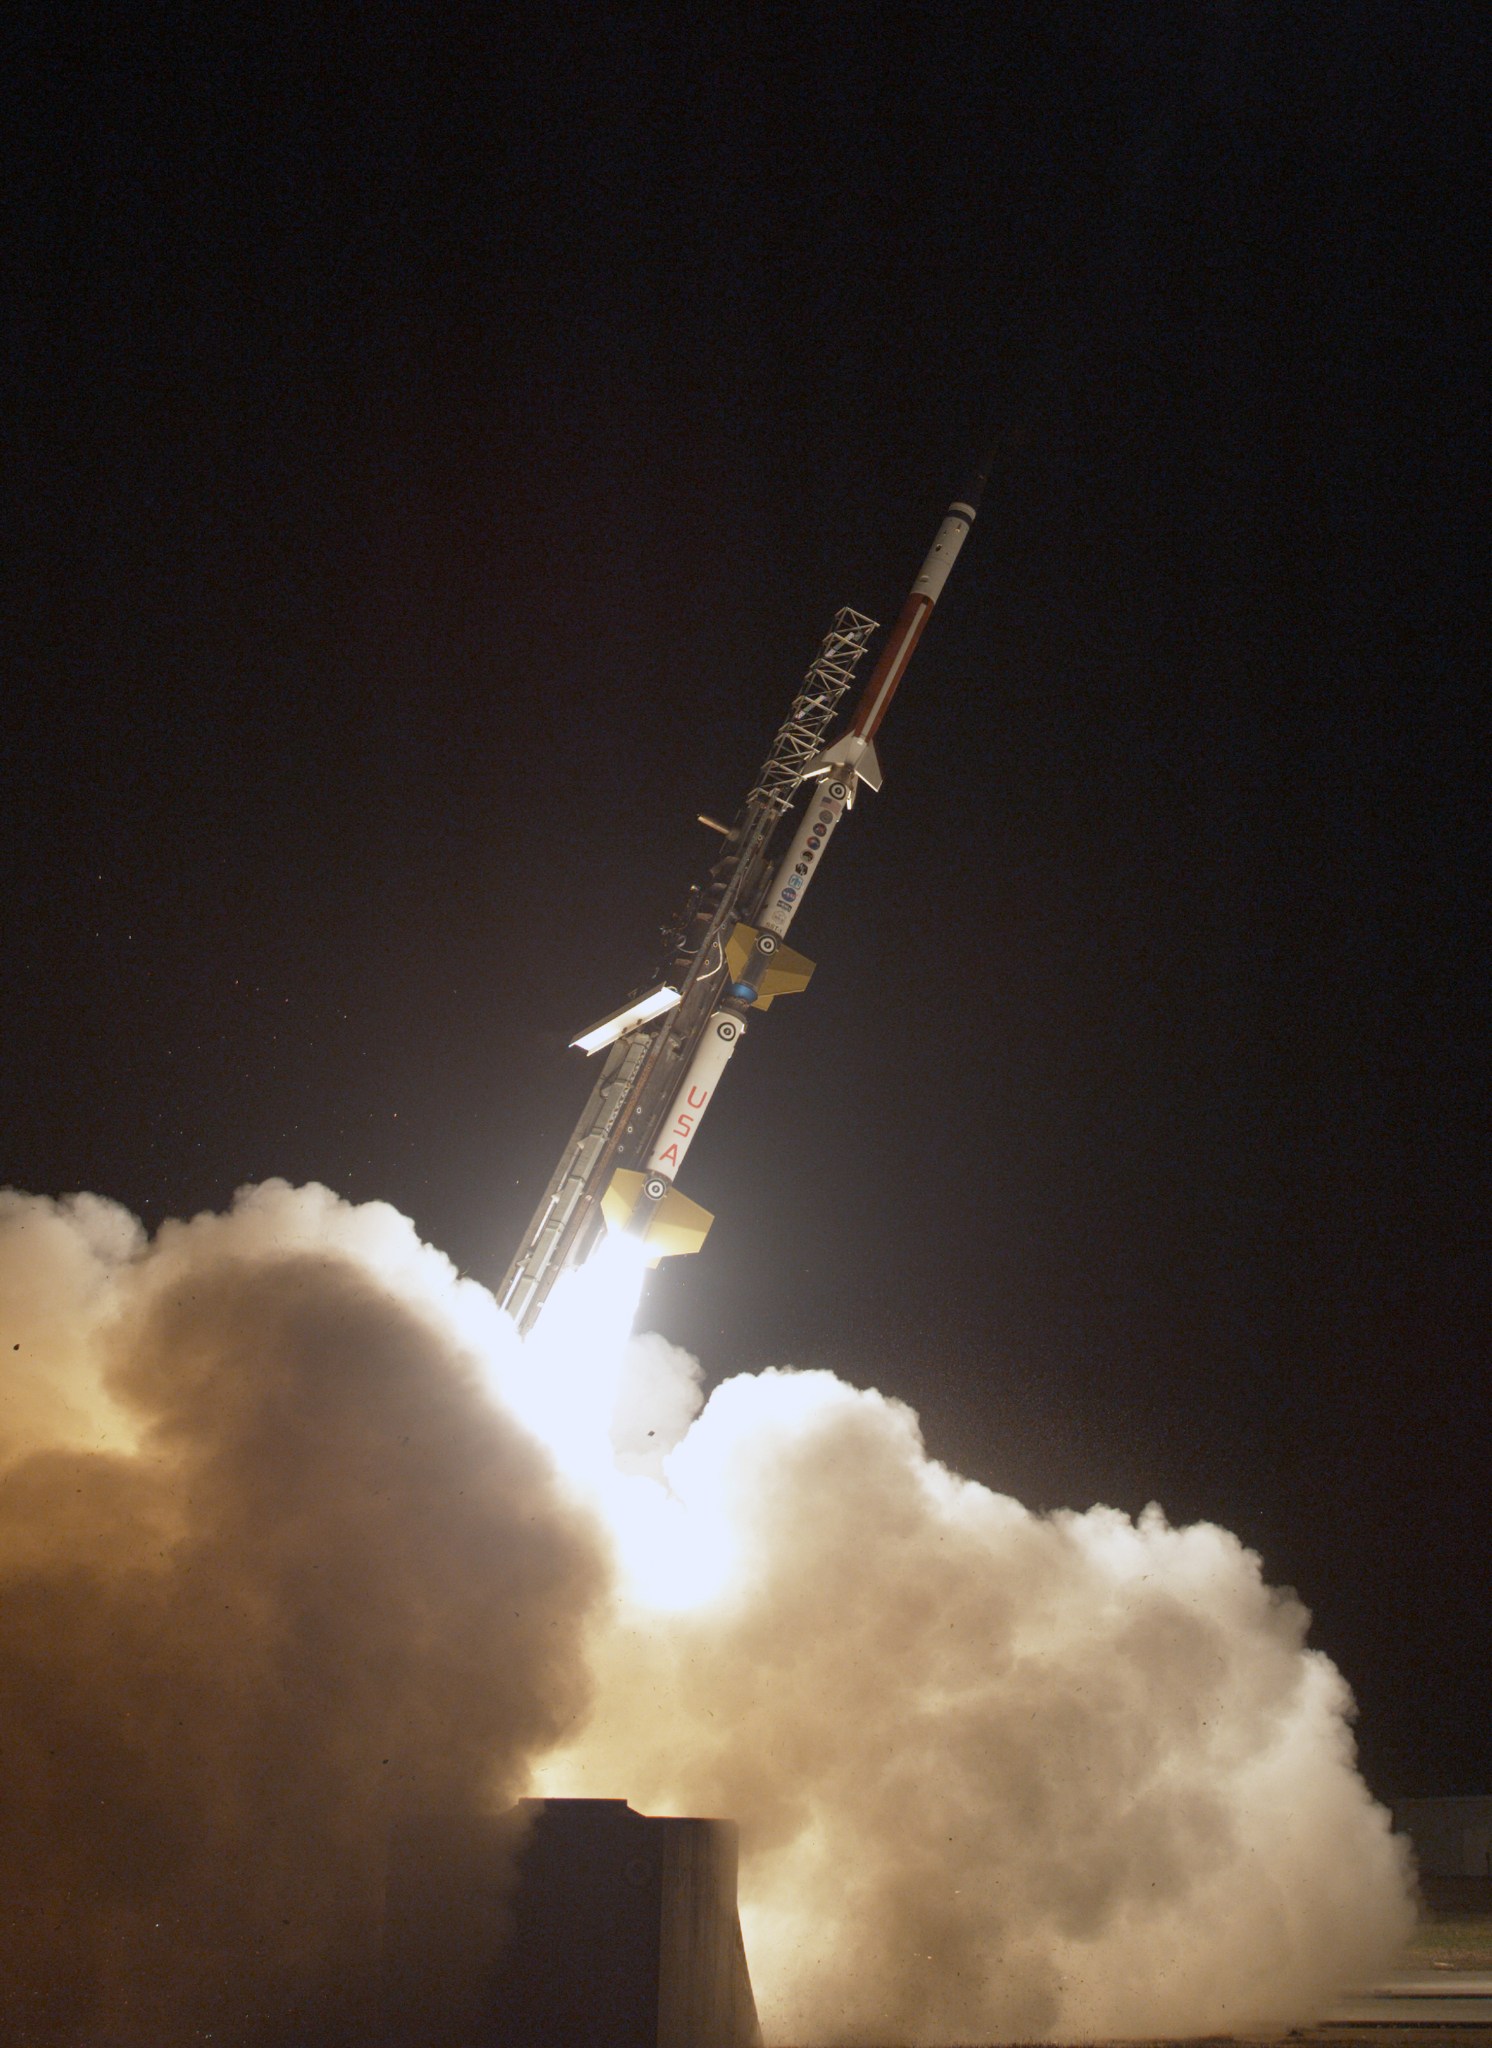
NASA’s Wallops Flight Facility supported the launch of two suborbital sounding rockets on Nov. 15, 2023, for Navy Strategic Systems Programs (SSP), and the Missile Defense Agency (MDA), in coordination with Naval Surface Warfare Center, Crane Division (NSWC Crane) and the Office of the Secretary of Defense’s Test Resource Management Center (TRMC) Multi-Service Advanced Capability Hypersonic Test Bed (MACH TB).

This subscale test was executed by Sandia National Laboratories. Data collected from this test will be used to inform the development of the Navy’s Conventional Prompt Strike (CPS), MDA’s hypersonic defensive capability, and to mature other hypersonic technologies.

a 3 stage sounding rocket launches off a rail against a inky black sky. In the foreground plumes of white smoke are lit up by the rocket's ignition
A three-stage sounding rocket launched from NASA’s Wallops Flight Facility in Virginia Nov. 15, 2023.
Courtesy Photo

Share

Details

Last Updated

Nov 17, 2023

Editor

Amy L. Barra

Contact

Amy L. Barra
amy.l.barra@nasa.gov

Location

Wallops Flight Facility

Related Terms

Powered by WPeMatico

Get The Details…
Amy Barra

The Heat is On! NASA’s “Flawless” Heat Shield Demo Passes the Test

The Heat is On! NASA’s “Flawless” Heat Shield Demo Passes the Test

5 Min Read

The Heat is On! NASA’s “Flawless” Heat Shield Demo Passes the Test

The Low-Earth Orbit Flight Test of an Inflatable Decelerator, or LOFTID, spacecraft is pictured after its atmospheric re-entry test in November 2022.

The Low-Earth Orbit Flight Test of an Inflatable Decelerator, or LOFTID, spacecraft is pictured after its atmospheric re-entry test in November 2022.

Credits:
NASA / Greg Swanson

A little more than a year ago, a NASA flight test article came screaming back from space at more than 18,000 mph, reaching temperatures of nearly 2,700 degrees Fahrenheit before gently splashing down in the Pacific Ocean. At that moment, it became the largest blunt body — a type of reentry vehicle that creates a heat-deflecting shockwave — ever to reenter Earth’s atmosphere.

The Low-Earth Orbit Flight Test of an Inflatable Decelerator (LOFTID) launched on Nov. 10, 2022, aboard a United Launch Alliance (ULA) Atlas V rocket and successfully demonstrated an inflatable heat shield. Also known as a Hypersonic Inflatable Aerodynamic Decelerator (HIAD) aeroshell, this technology could allow larger spacecraft to safely descend through the atmospheres of celestial bodies like Mars, Venus, and even Saturn’s moon, Titan.

“Large-diameter aeroshells allow us to deliver critical support hardware, and potentially even crew, to the surface of planets with atmospheres. This capability is crucial for the nation’s ambition of expanding human and robotic exploration across our solar system,” said Trudy Kortes, director of the Technology Demonstrations Missions (TDM) program within the agency’s Space Technology Mission Directorate (STMD) at NASA Headquarters in Washington.

NASA has been developing HIAD technologies for over a decade, including two smaller scale suborbital flight tests before LOFTID. In addition to this successful tech demo, NASA is investigating future applications, including partnering with commercial companies to develop technologies for small satellite reentry, aerocapture, and cislunar payloads.

“This was a keystone event for us, and the short answer is: It was highly successful,” said LOFTID Project Manager Joe Del Corso. “Our assessment of LOFTID concluded with the promise of what this technology may do to empower the exploration of deep space.”

Due to the success of the LOFTID tech demo, NASA announced under its Tipping Point program that it would partner with ULA to develop and deliver the “next size up,” a larger 12-meter HIAD aeroshell for recovering the company’s Vulcan engines from low Earth orbit for reuse.

A Successful Test in the Books, A Video Recap

The LOFTID team recently held a post-flight analysis assessment of the flight test at NASA’s Langley Research Center in Hampton, Virginia. Their verdict?

Upon recovery, the team discovered LOFTID appeared pristine, with minimal damage, meaning its performance was, as Del Corso puts it, “Just flawless.”

Here are some interesting visual highlights from LOFTID’s flight test.

NASA

To get to atmospheric reentry, LOFTID had to go through an intricate sequence of events. Del Corso compared it to a Rube Goldberg device, a complex machine designed to carry out simple tasks through a series of chain reactions.

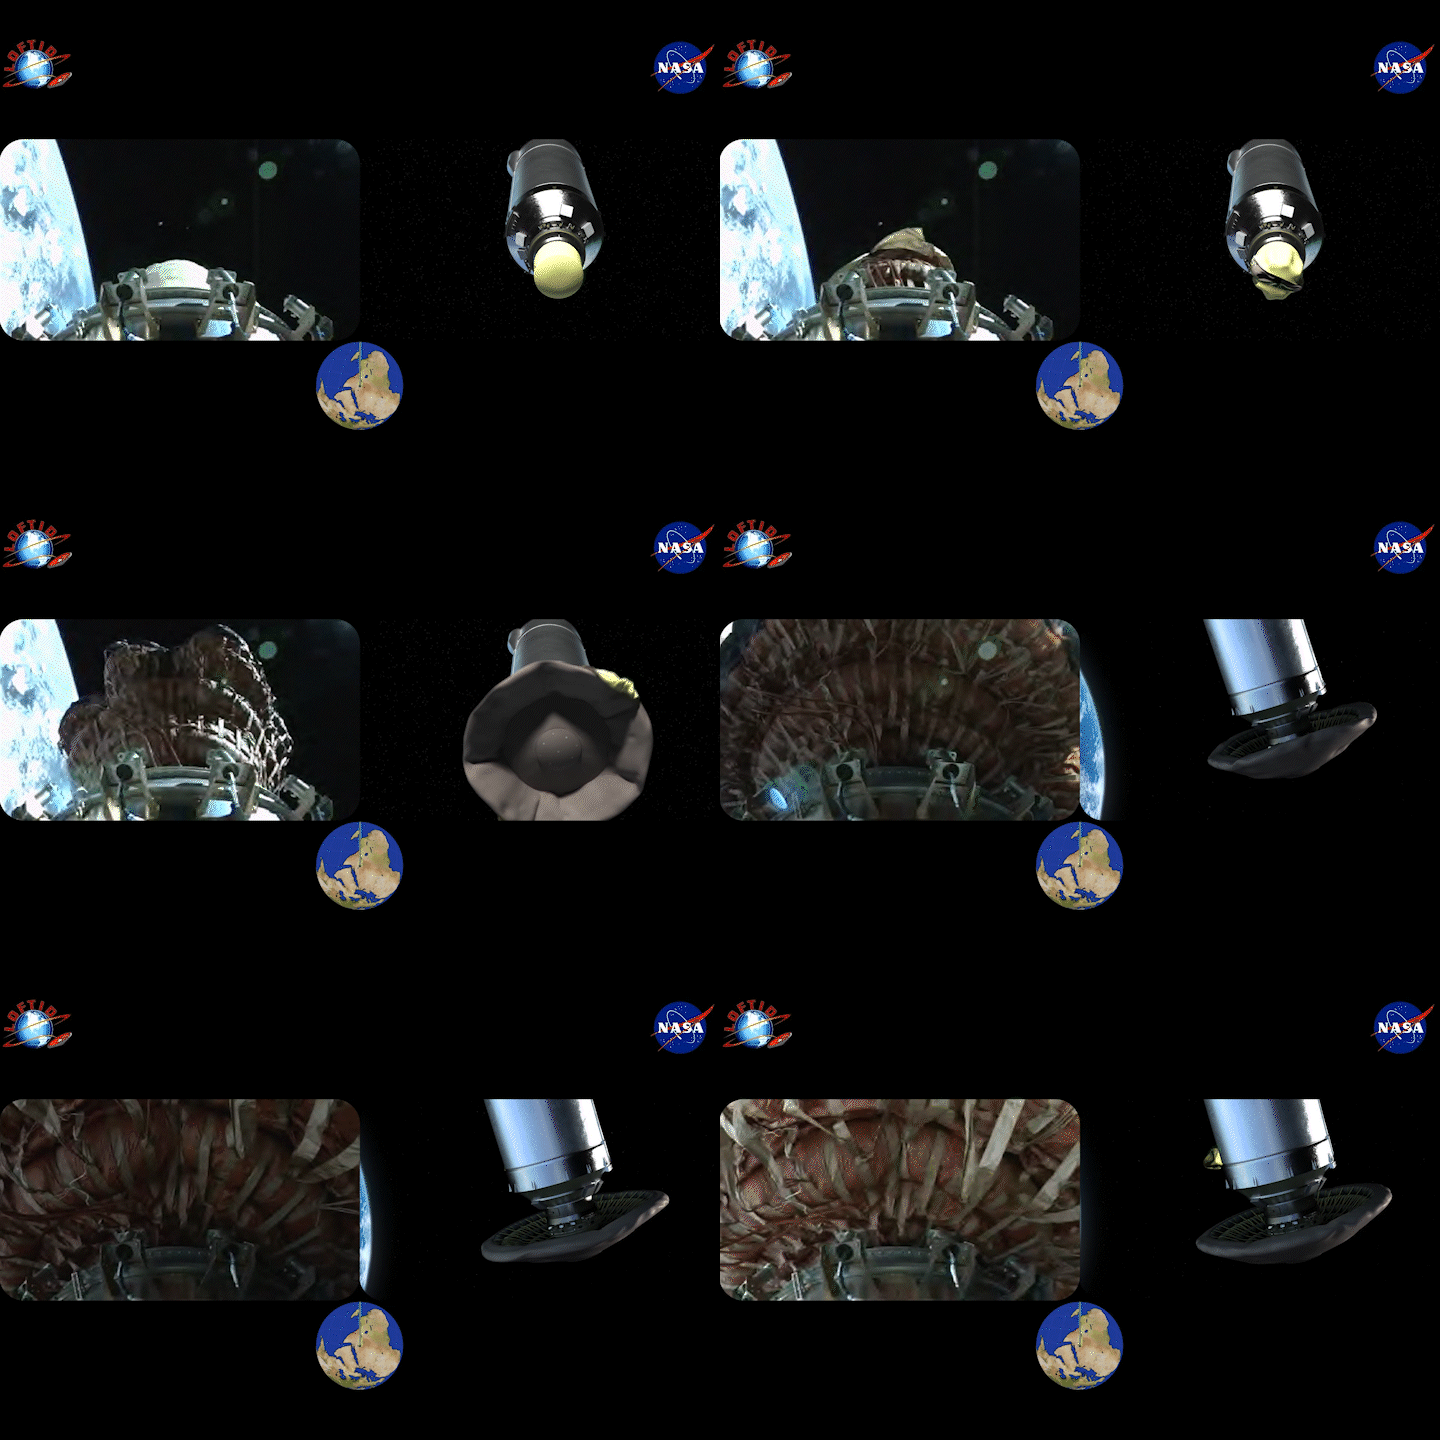
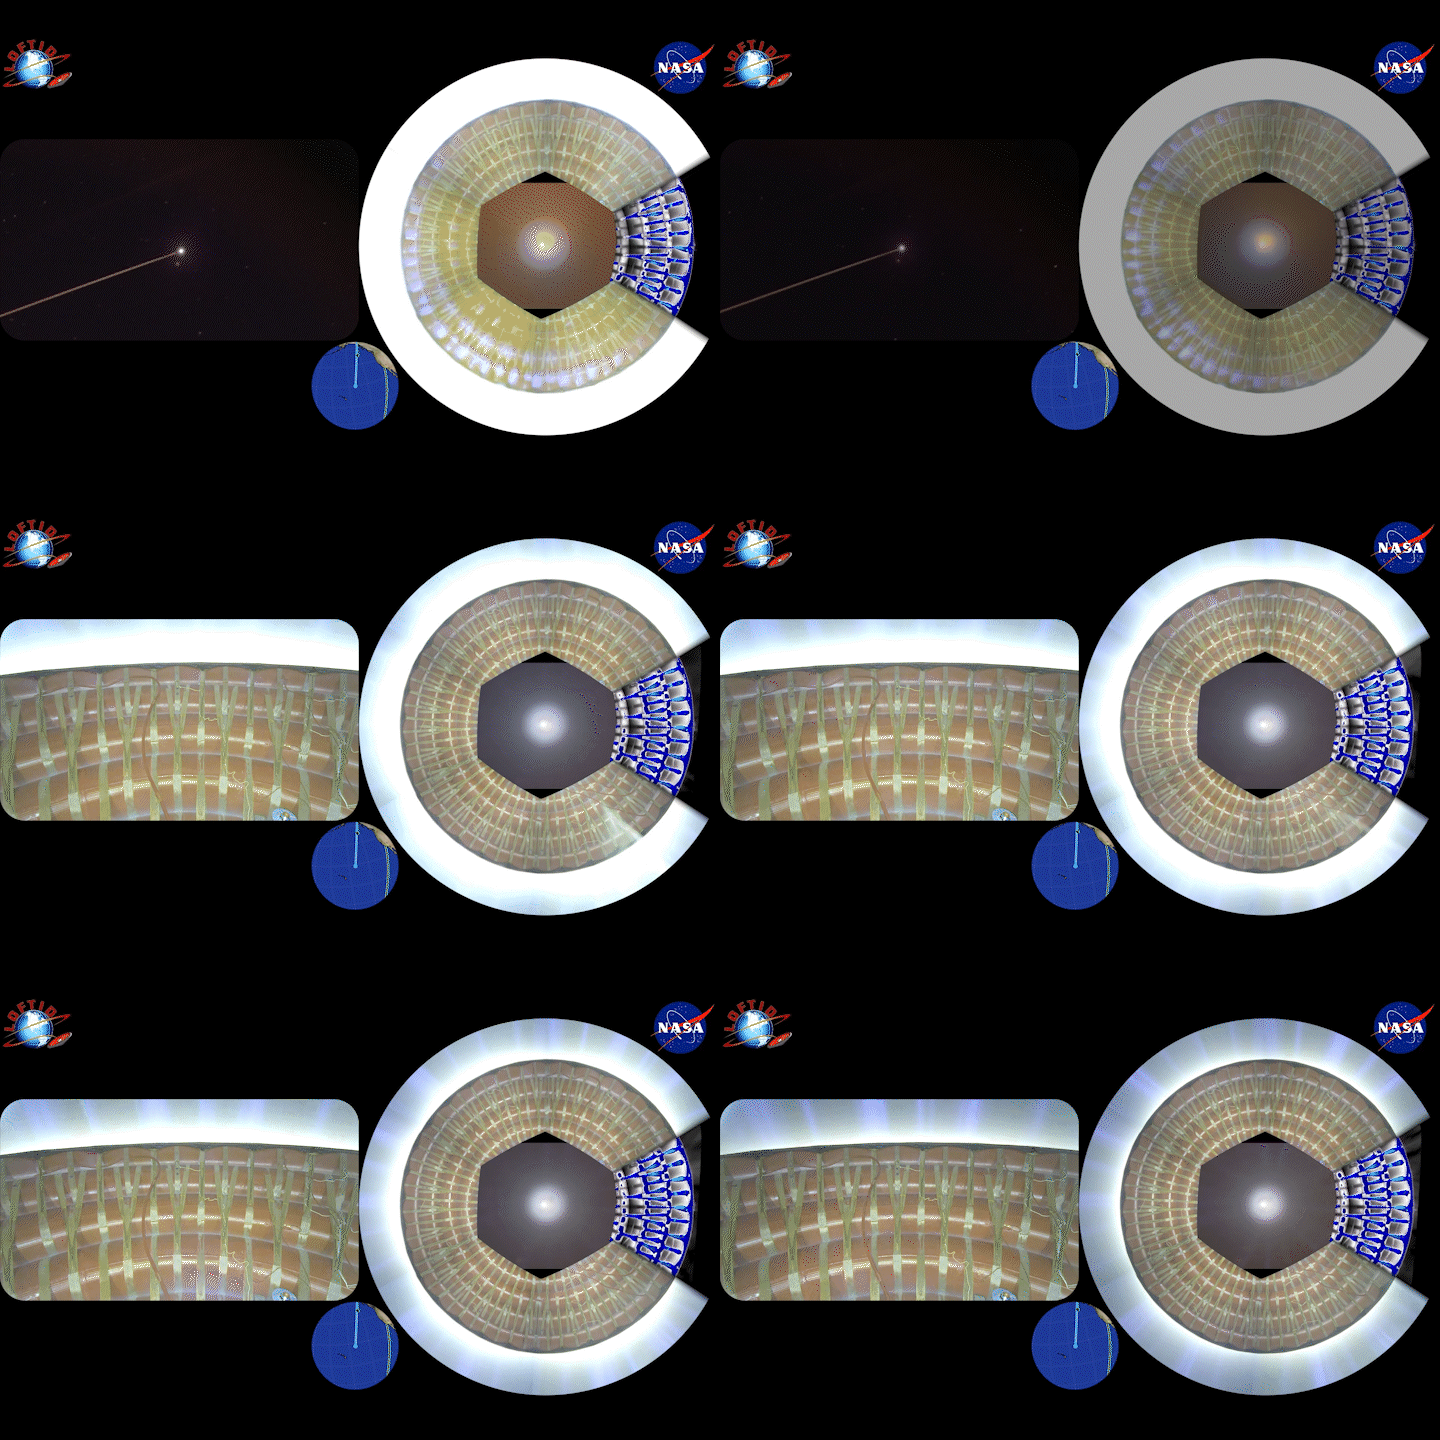
Video captured the moment LOFTID deployed the HIAD (on the left), compared to a preflight animation developed by NASA Langley’s Advanced Concepts Lab (on the right). Inflation happens at the bottom of the video as LOFTID flies over the African continent.

NASA

As it flew over the Mediterranean Sea, LOFTID separated from the ULA Centaur upper stage. On the left, LOFTID is seen from Centaur’s forward-facing camera. The composite image on the right is from cameras around LOFTID’s center body, looking forward and outboard at the orange inflatable HIAD structure. In the center, looking back at Centaur, LOFTID is seen from an aft-facing camera.

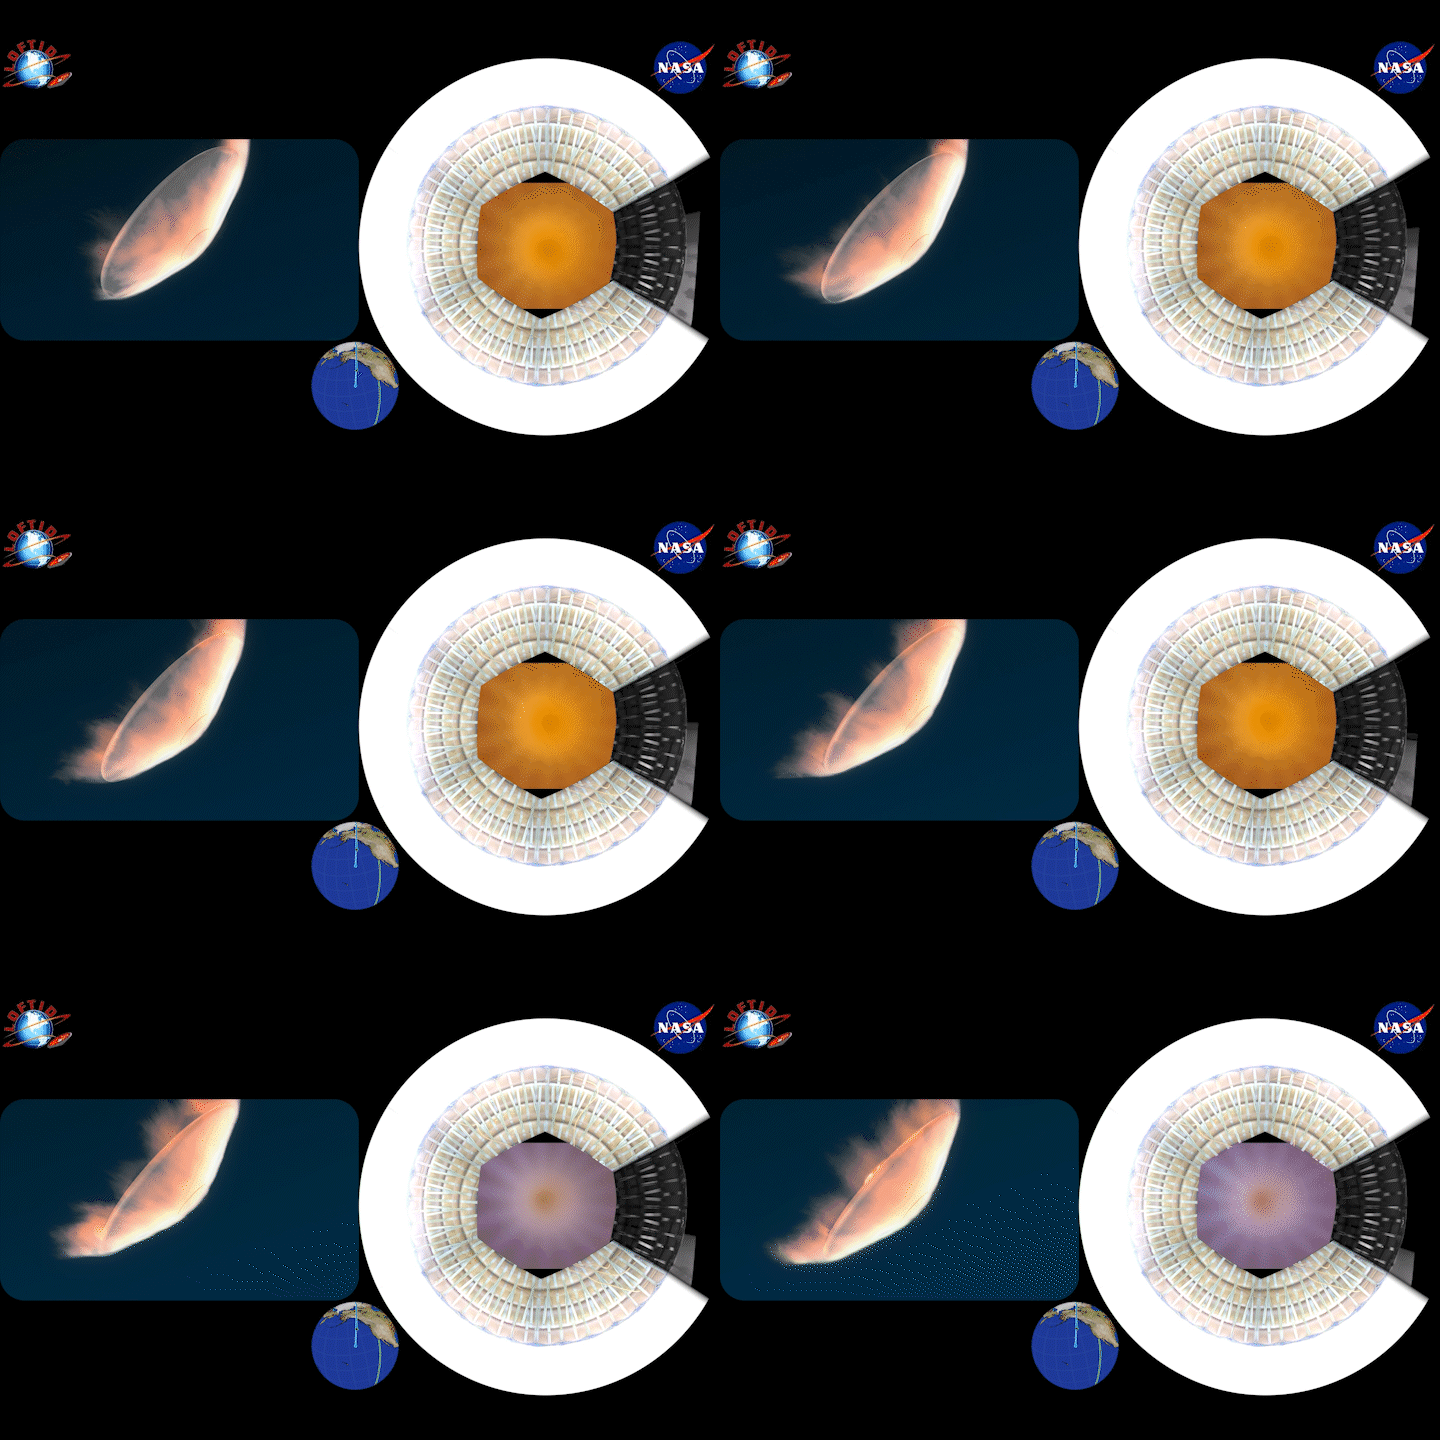
The camera captured footage of the plasma quickly changing colors from orange to purple. Why the color change? “We’re still investigating exactly what causes that,” said John DiNonno, LOFTID chief engineer. The animation on the left shows an artist’s concept of what the front side may have looked like.
NASA

As LOFTID reentered Earth’s atmosphere and reached nearly 2,700 degrees Fahrenheit, the extreme heat caused gases around it to ionize and form plasma. On the right, the images from the center body cameras became extremely bright in the visible spectrum, while the Earth is visible on infrared cameras  as the vehicle rotated.

The camera captured footage of the plasma quickly changing colors from orange to purple. Why the color change? “We’re still investigating exactly what causes that,” said John DiNonno, LOFTID chief engineer. The animation on the left shows an artist’s concept of what the front side may have looked like.

This video, captured by NASA Langley’s Scientifically Calibrated In-Flight Imagery team, shows LOFTID during peak deceleration as the plasma recedes. On the left, LOFTID streaks through the night sky over the Pacific Ocean. On the right, the purple coloration flares up on the back side of LOFTID. In the second part of the video, the left shifts to one of the cameras looking at the back of the aeroshell, with the receding plasma streaking at its edge.
NASA

This video, captured by NASA Langley’s Scientifically Calibrated In-Flight Imagery  team, shows LOFTID during peak deceleration as the plasma recedes. On the left, LOFTID streaks through the night sky over the Pacific Ocean. On the right, the purple coloration flares up on the back side of LOFTID.

In the second part of the video, the left shifts to one of the cameras looking at the back of the aeroshell, with the receding plasma streaking at its edge.

After slowing down from more than 18,000 mph to less than 80 mph, LOFTID deployed its parachutes. From an infrared camera aboard the recovery ship, this video shows the parachute deployment and splashdown just over the horizon. The preflight animation is provided on the right for comparison.
NASA

After slowing down from more than 18,000 mph to less than 80 mph, LOFTID deployed its parachutes. 

From an infrared camera aboard the recovery ship, this video shows the parachute deployment and splashdown just over the horizon. The preflight animation is provided on the right for comparison.

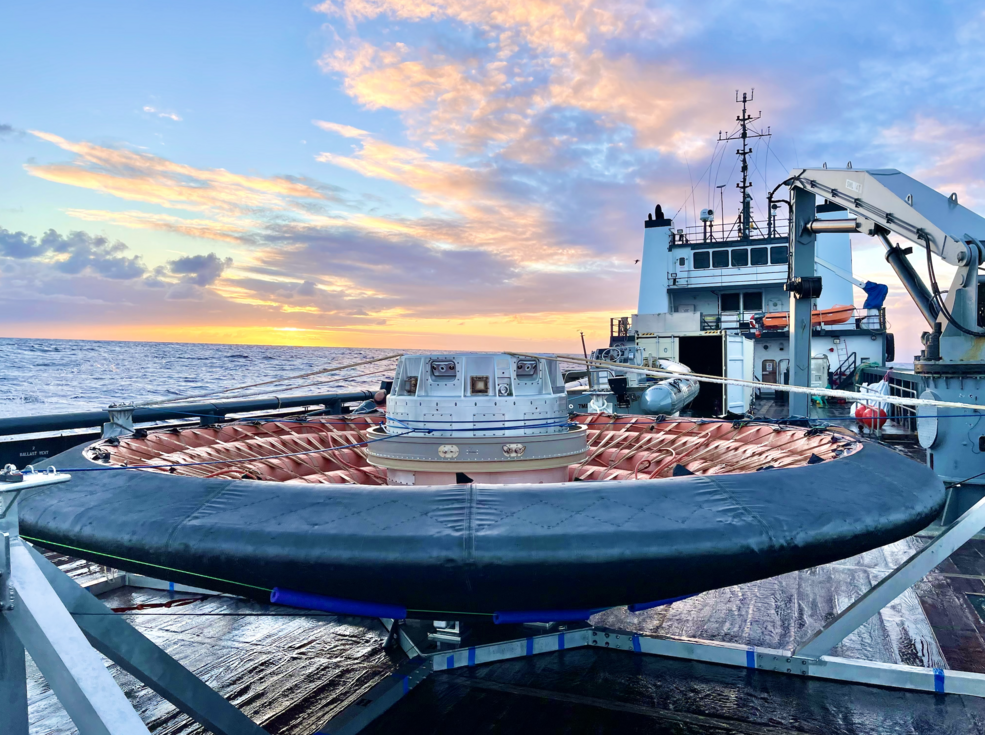
LOFTID splashed down in the Pacific Ocean several hundred miles off the east coast of Hawaii and only about eight miles from the recovery ship’s bow — almost exactly as modeled. A crew got on a small boat and retrieved and hoisted LOFTID onto the recovery ship. Here is an image from the first contact with LOFTID after it splashed down.
NASA

LOFTID splashed down in the Pacific Ocean several hundred miles off the east coast of Hawaii and only about eight miles from the recovery ship’s bow — almost exactly as modeled. A crew got on a small boat and retrieved and hoisted LOFTID onto the recovery ship. Here is an image from the first contact with LOFTID after it splashed down.

“The LOFTID mission was important because it proved the cutting-edge HIAD design functioned successfully at an appropriate scale and in a relevant environment,” said Tawnya Laughinghouse, manager of the TDM program office at NASA’s Marshall Space Flight Center in Huntsville, Alabama.

The LOFTID demonstration was a public private-partnership with ULA funded by STMD and managed by the Technology Demonstration Mission Program, executed by NASA Langley with contributions from across NASA centers. Multiple U.S. small businesses contributed to the hardware. NASA’s Launch Services Program  was responsible for NASA’s oversight of launch operations.

For more information on LOFTID, click here.

Powered by WPeMatico

Get The Details…
Julia L. Bradshaw

Hubble Images Galaxy with an Explosive Past

Hubble Images Galaxy with an Explosive Past

2 min read

Hubble Images Galaxy with an Explosive Past

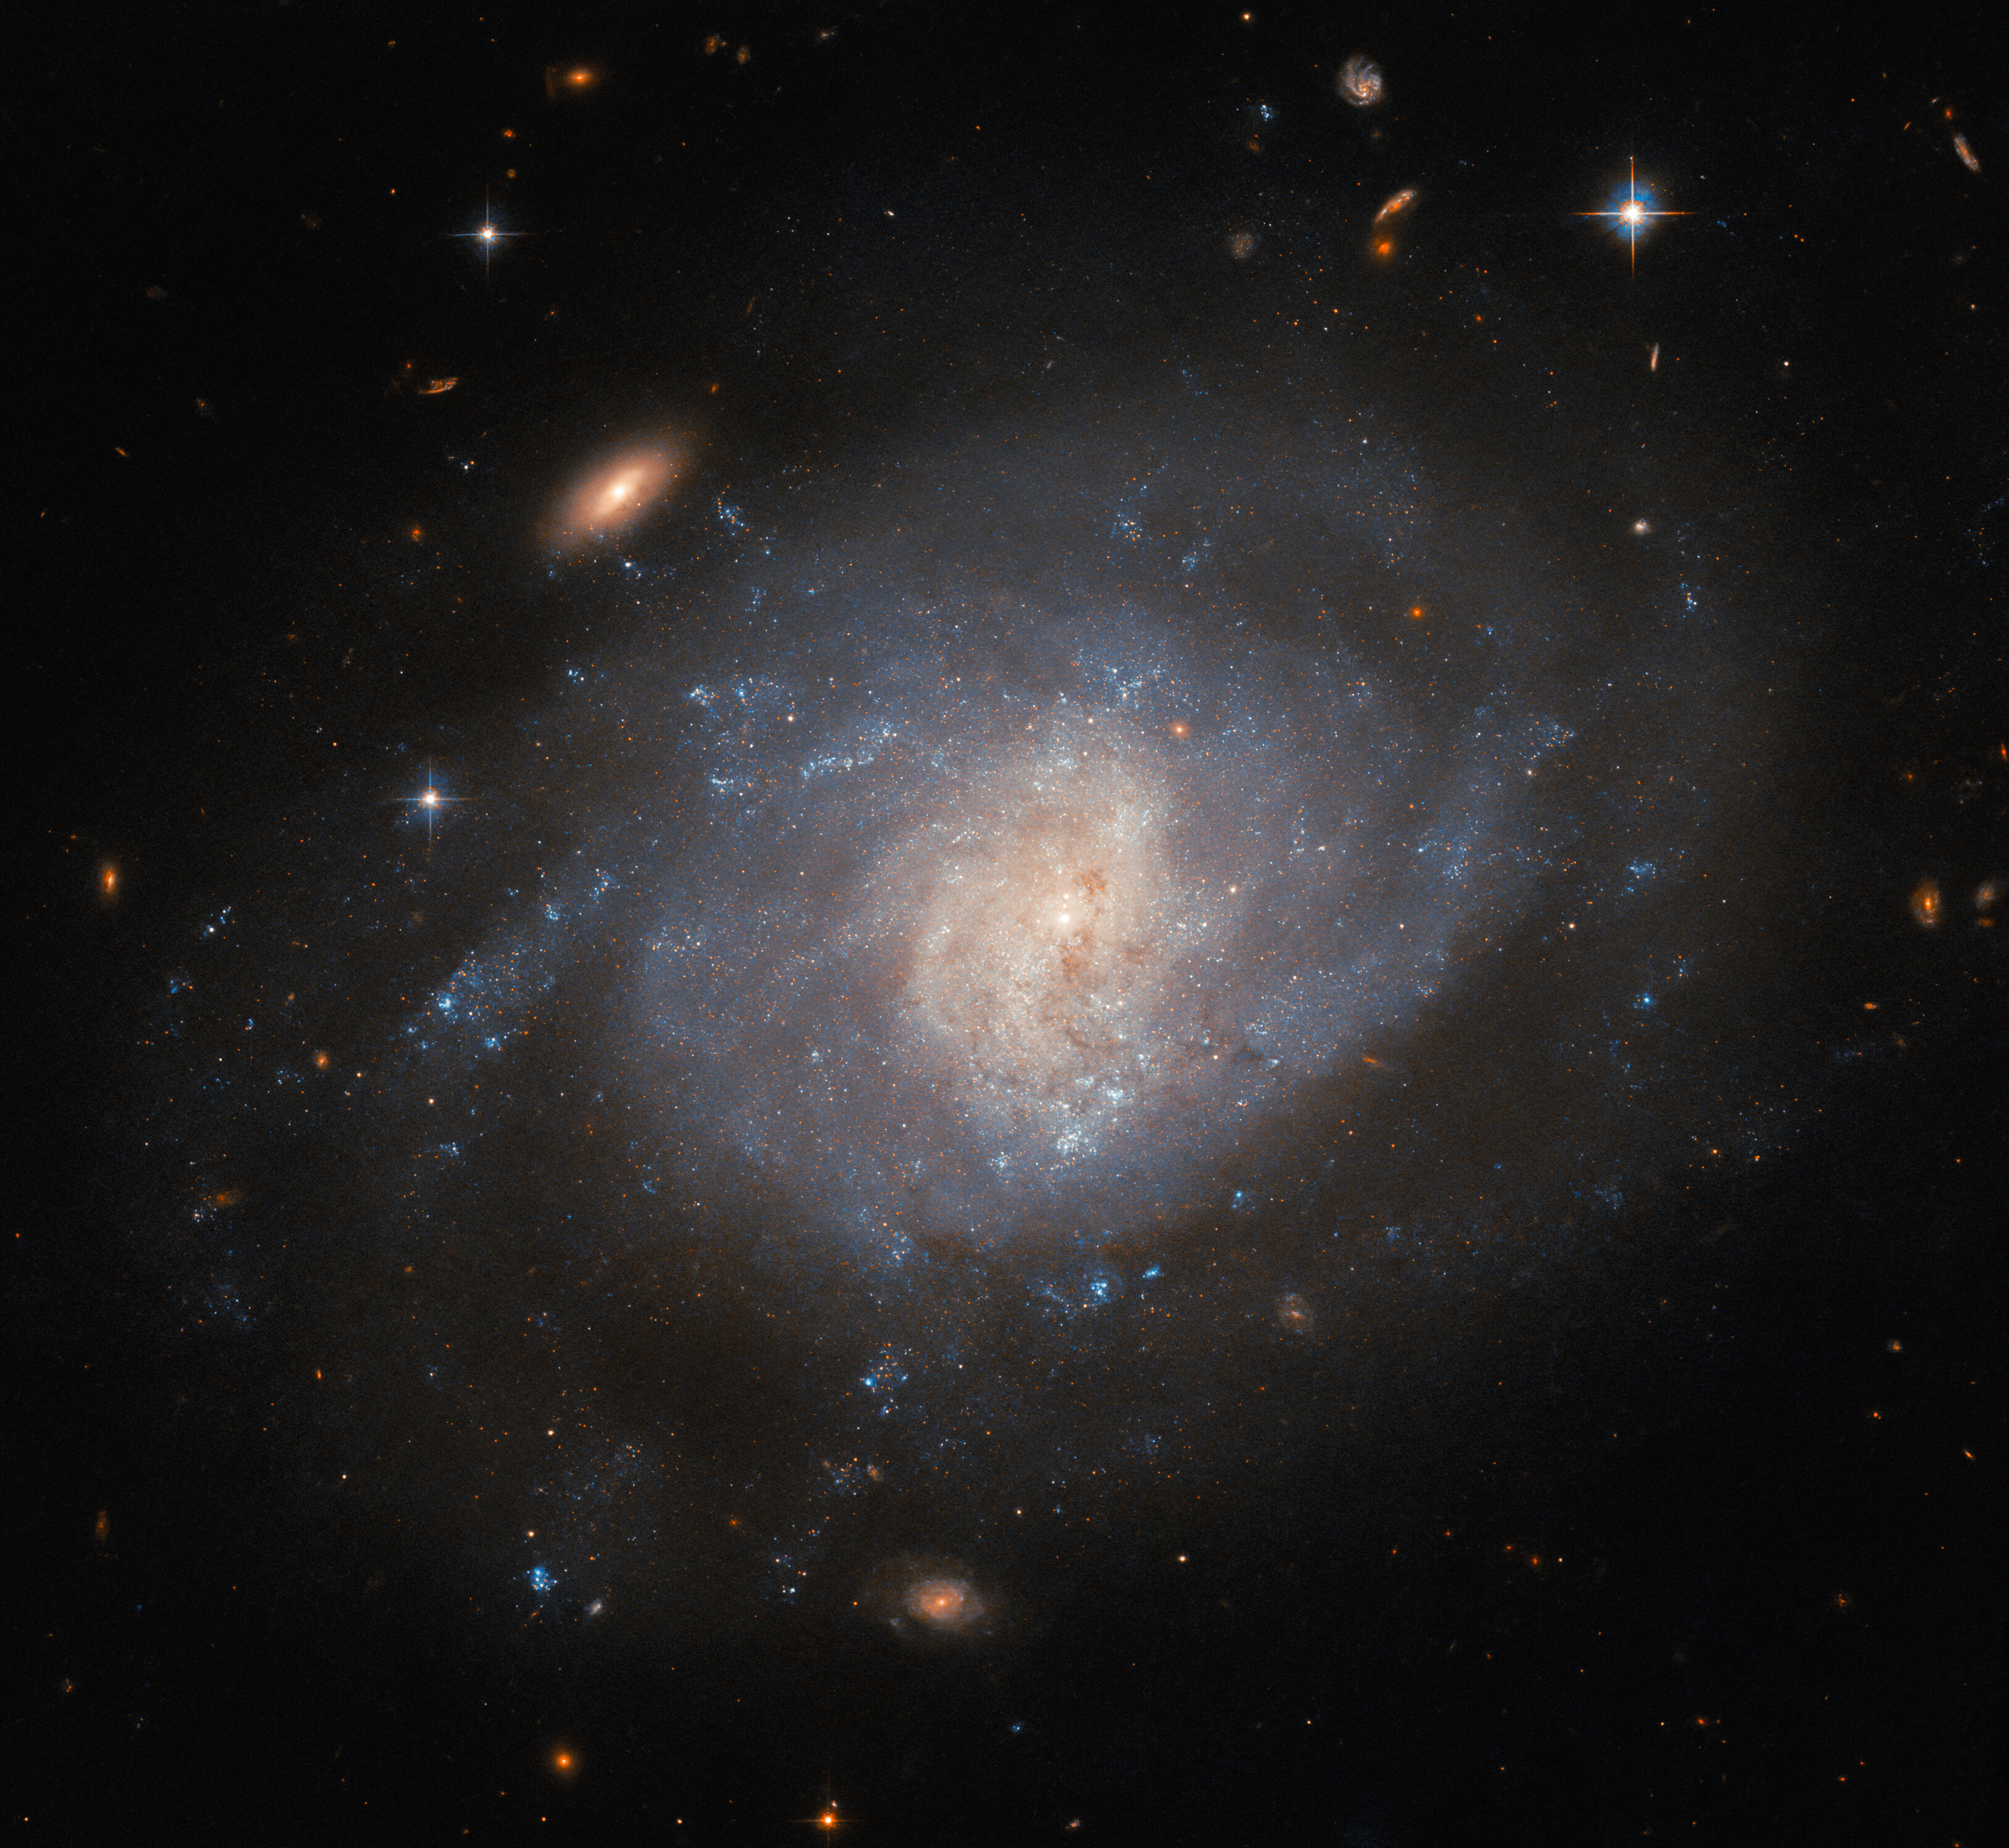
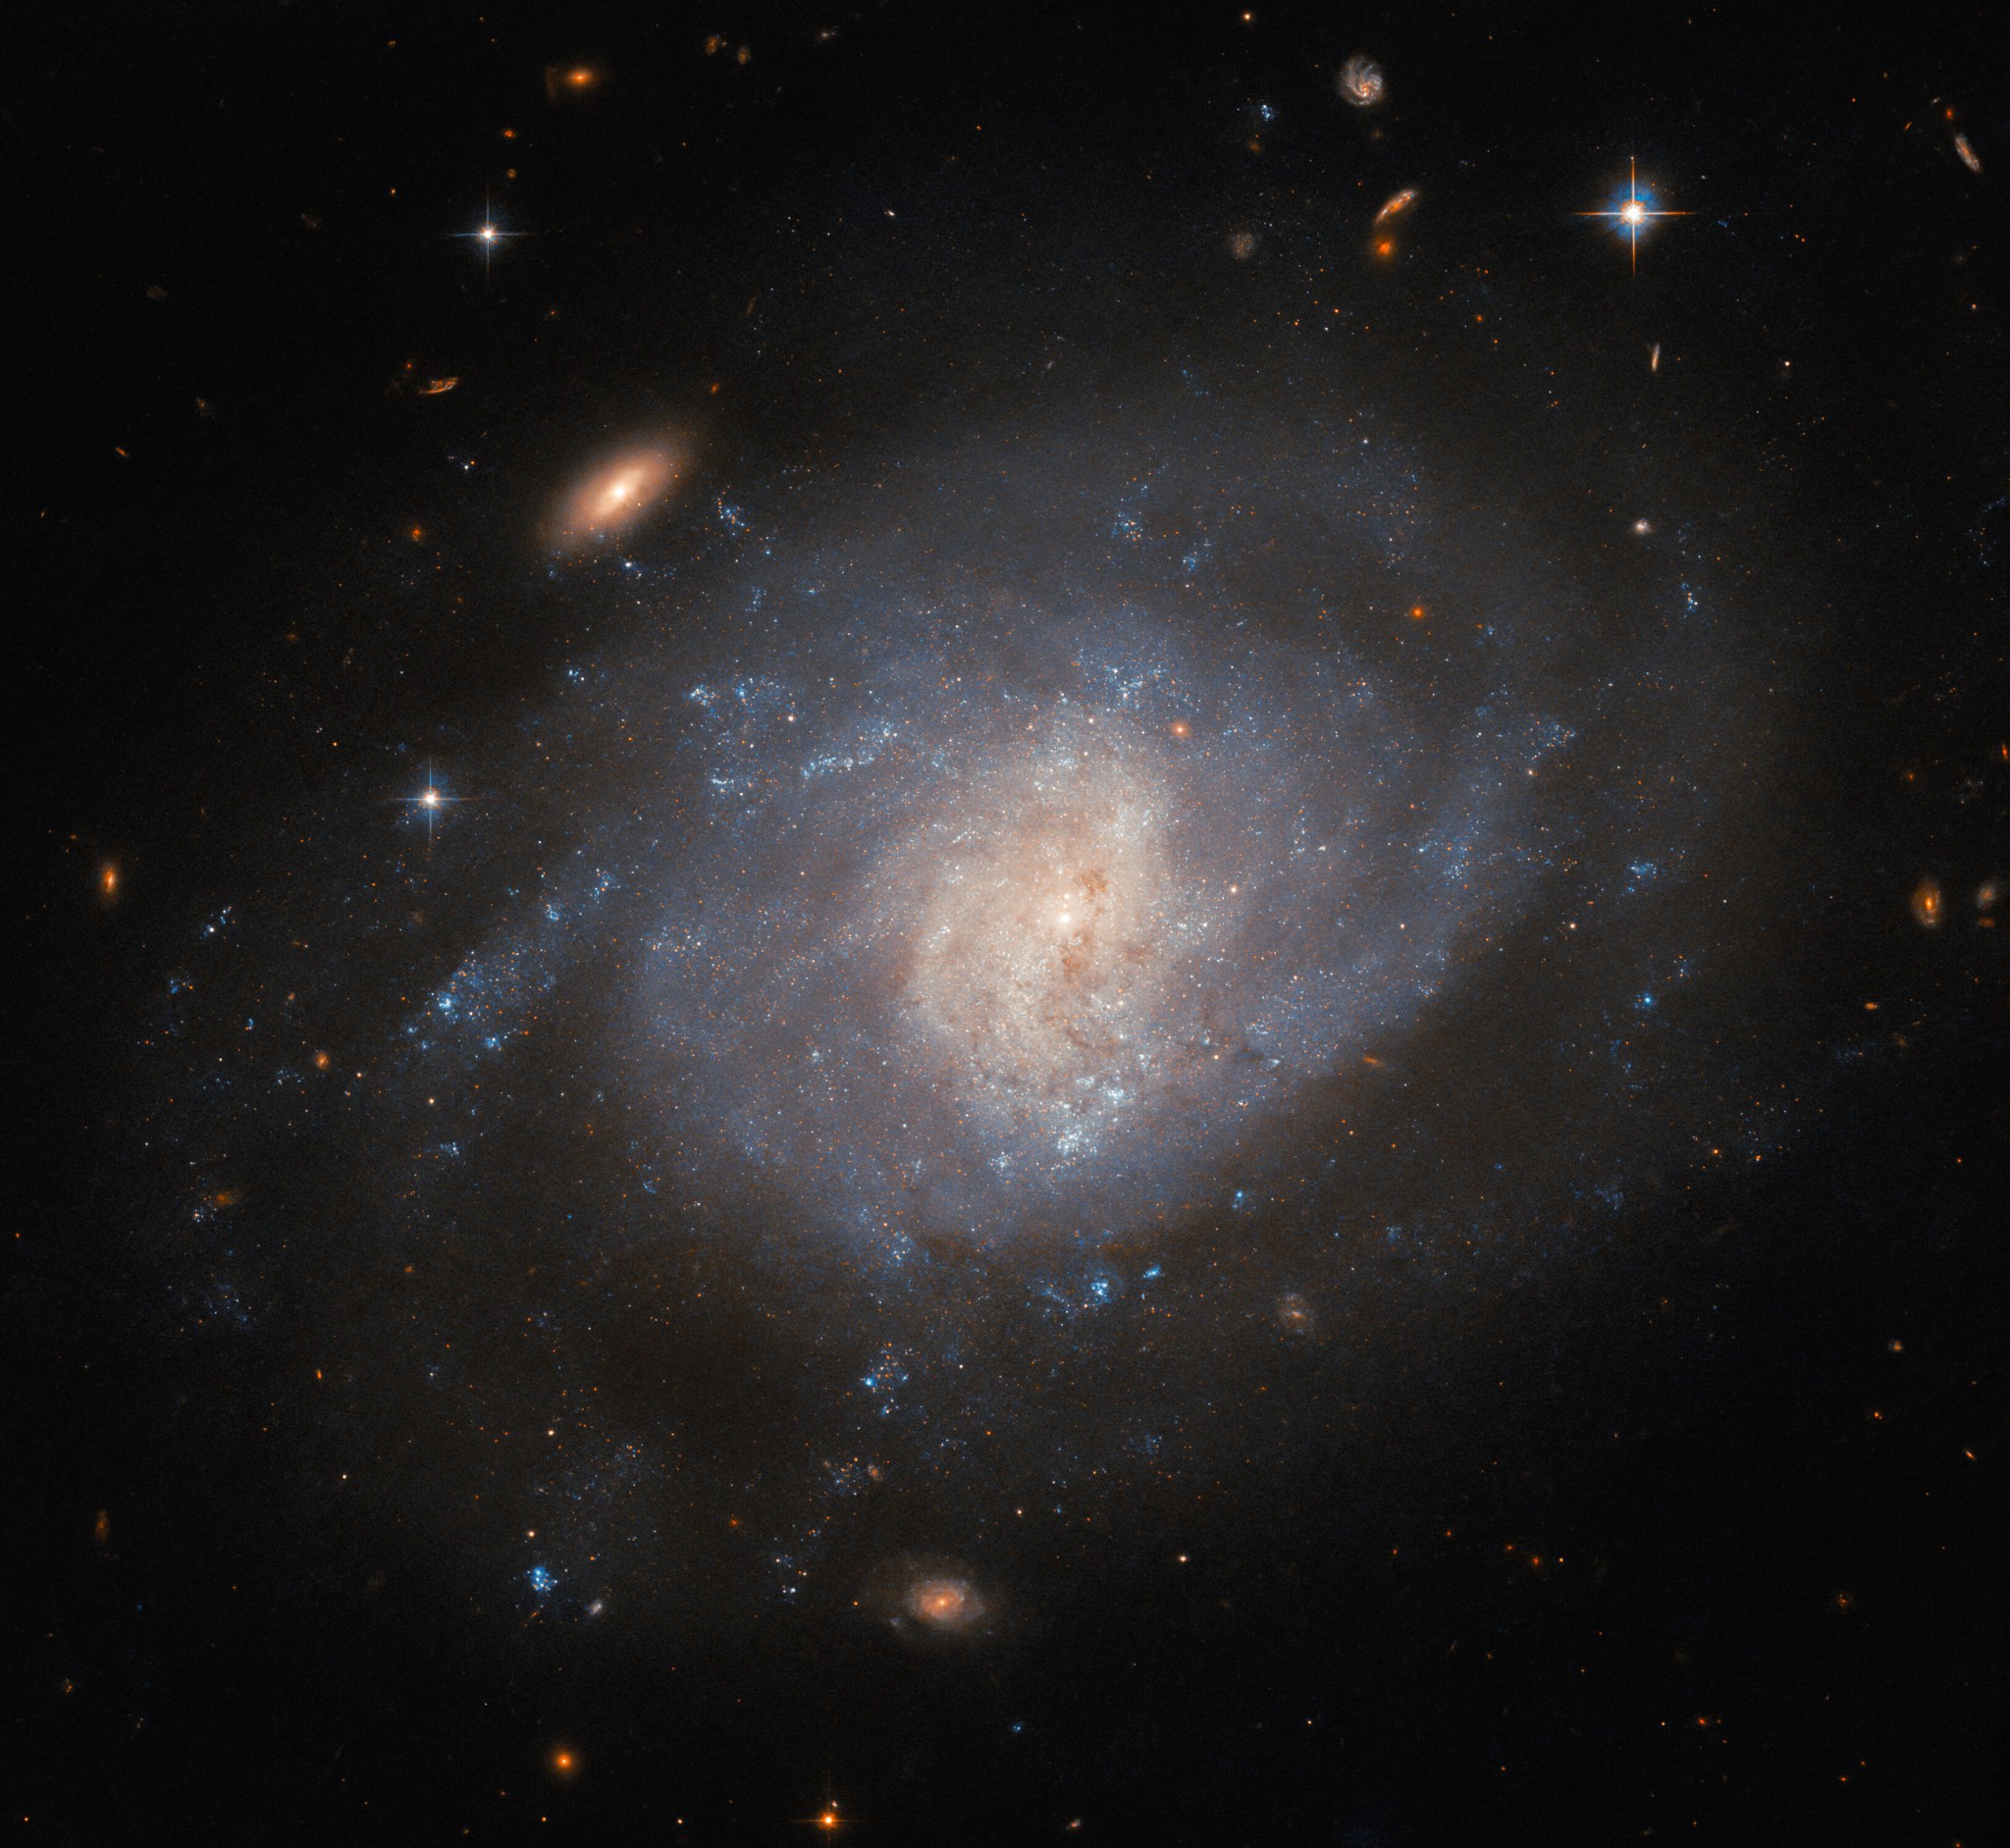
A spiral galaxy, seen face-on from Earth. The spiral arms of the galaxy are bright but not well defined, merging into a swirling disk with a faint halo of dimmer gas around it. The core glows brightly in a lighter color and has a bit of faint dust crossing it. Two redder, visually smaller galaxies and a bright star are prominent around the galaxy, with more tiny objects in the background.
A NASA Hubble Space Telescope image of the spiral galaxy NGC 941.
ESA/Hubble & NASA, C. Kilpatrick

This image from NASA’s Hubble Space Telescope features the spiral galaxy NGC 941, which lies about 55 million light-years from Earth. Hubble’s Advanced Camera for Surveys (ACS) collected the data that created this image. Beautiful NGC 941 is undoubtedly the main attraction in this view; however, the hazy-looking galaxy was not the motivation for collecting the data. That distinction belongs to an astronomical event that took place in the galaxy years before: the supernova SN 2005ad. The location of this faded supernova was observed as part of a study of multiple hydrogen-rich supernovae, also known as type II supernovae, to better understand the environments in which certain types of supernovae take place. While the study was conducted by professional astronomers, SN 2005ad itself owes its discovery to a distinguished amateur astronomer named Kōichi Itagaki, who has discovered over 170 supernovae.

This might raise the question of how an amateur astronomer could spot something like a supernova event before professional astronomers who have access to telescopes such as Hubble. The detection of supernovae is a mixture of skill, facilities, and luck. Most astronomical events happen over time spans that dwarf human lifetimes, but supernova explosions are extraordinarily fast, appearing very suddenly and then brightening and dimming over a period of days or weeks. Another aspect is time – data from a few hours of observations with telescopes like Hubble might take weeks, months, or sometimes even years to process and analyze. Amateur astronomers can spend much more time actively observing the skies, and sometimes have extremely impressive systems of telescopes, computers, and software they can use. 

Because amateurs like Itagaki spot so many supernovae, there is actually an online system set up to report them (the Transient Name Server). This system is a big help to professional astronomers, because time is truly of the essence with supernovae events. After the reported discovery of SN 2005ab, professional astronomers were able to follow up with spectroscopic studies and confirm it as a type II supernova, which eventually led to Hubble to study its location. Such a study wouldn’t be possible without a rich library of cataloged supernovae, built with the keen eyes of amateur astronomers.

Text credit: European Space Agency

Media Contact:

Claire Andreoli
NASA’s Goddard Space Flight CenterGreenbelt, MD
claire.andreoli@nasa.gov

Share

Details

Last Updated
Nov 16, 2023
Editor
Andrea Gianopoulos
Location
Goddard Space Flight Center

Powered by WPeMatico

Get The Details…