55 Years Ago: Three Months Until the Moon Landing

55 Years Ago: Three Months Until the Moon Landing

The rapid pace of preparations for the first Moon landing continued in April 1969. The successful Apollo 9 mission in March cleared the way for Apollo 10 to test all three components of the spacecraft in lunar orbit in May, in a dress rehearsal for the landing itself. Apollo 10 astronauts Thomas P. Stafford, John W. Young, and Eugene A. Cernan and their backups L. Gordon Cooper, Donn F. Eisele, and Edgar D. Mitchell continued training in spacecraft simulators while engineers prepared their Saturn V rocket and Apollo spacecraft for the mid-May launch. Preparations continued in parallel for Apollo 11, the mission to attempt the first Moon landing. The astronauts trained for the flight, including rehearsing the activities for their historic spacewalk on the lunar surface. Fulfilling President John F. Kennedy’s goal by the appointed deadline looked promising.

Apollo 10
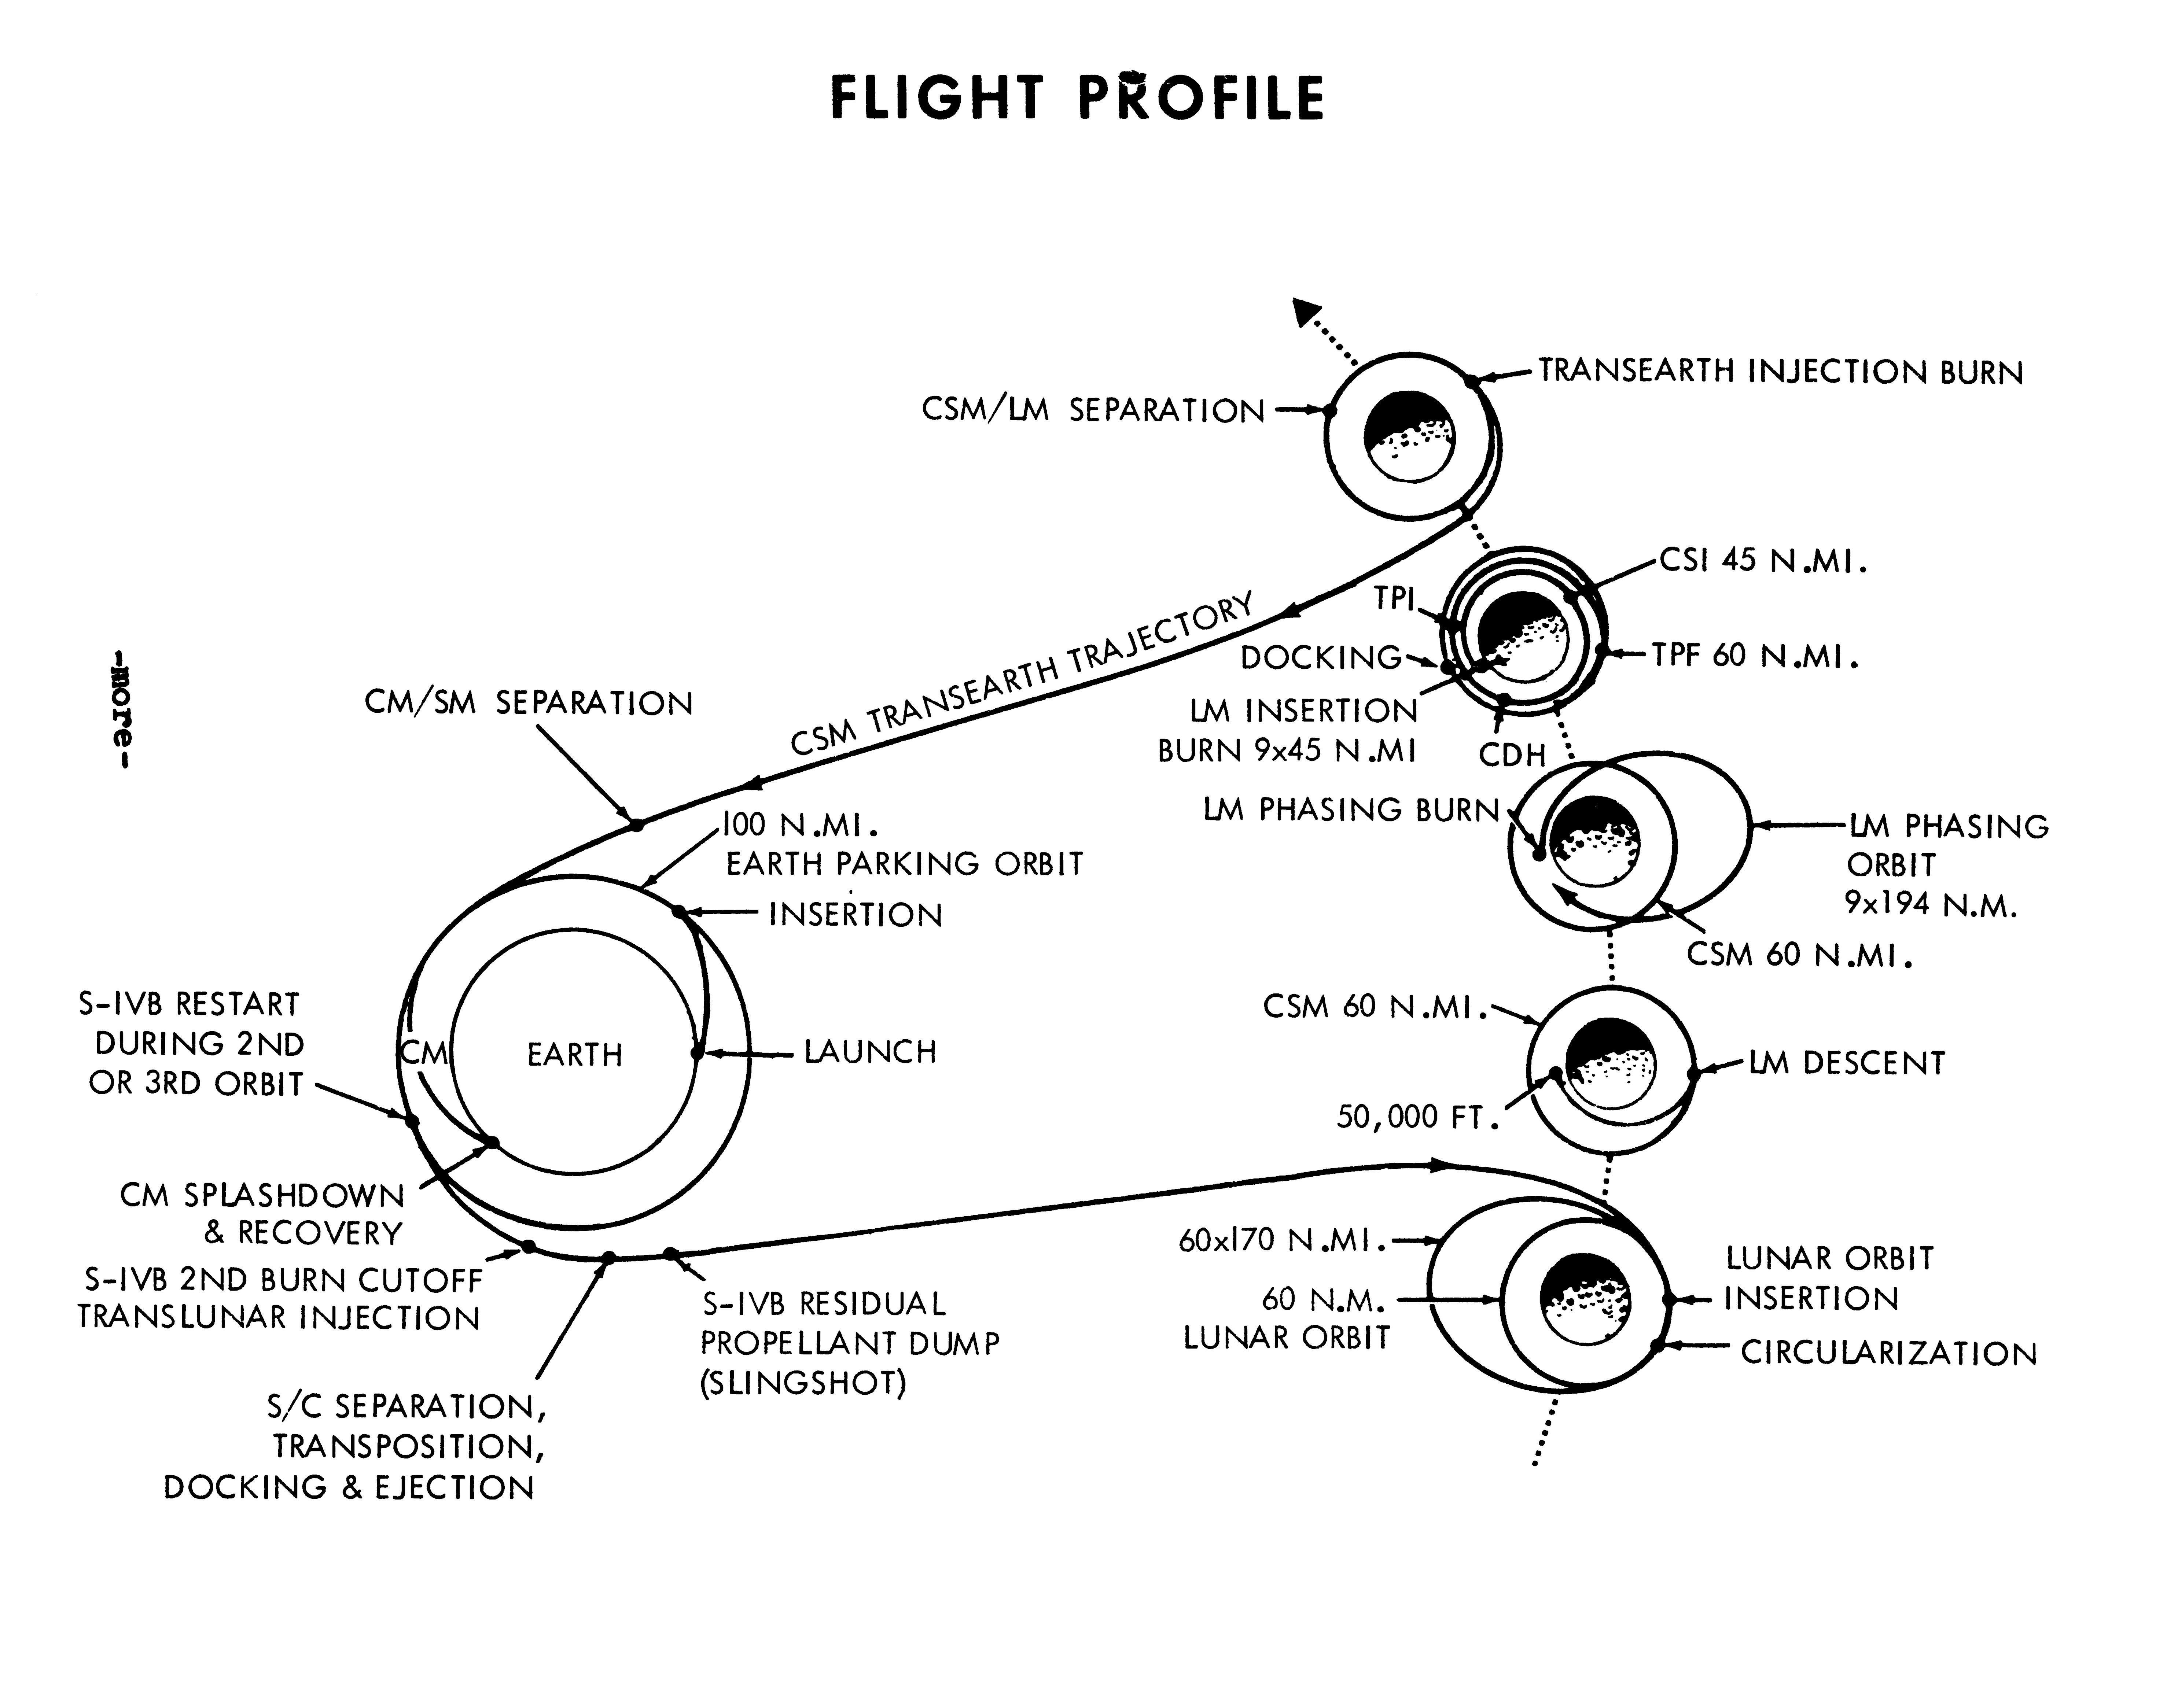
The Apollo 10 flight plan
The Apollo 10 flight plan.

Apollo 10 would serve as a dress rehearsal for the Moon landing mission. After liftoff from Launch Pad 39B – the first use of that facility – the spacecraft, still attached to the Saturn V’s S-IVB third stage, would make two revolutions around the Earth. The S-IVB would reignite for the Trans-Lunar Injection to begin the journey toward the Moon. Shortly after, the astronauts would undock the Command and Service Module (CSM) from the S-IVB, turn around, and dock with the Lunar Module (LM), tucked away in the top of the rocket stage, in a maneuver called transposition and docking. After jettisoning the S-IVB, the docked spacecraft would coast toward the Moon for about three days. The Service Propulsion System (SPS) engine would fire to drop them into orbit around the Moon. Stafford and Cernan would enter the LM and undock, leaving Young alone in the CSM. Using the LM’s Descent Propulsion System engine to lower their altitude, Stafford and Cernan would descend to about 50,000 feet above the lunar surface, and photograph the primary Apollo 11 landing site in the Sea of Tranquility. The LM would travel up to 350 miles away from the CSM during these maneuvers. The Ascent Propulsion System engine would then fire as they jettisoned the descent stage, in a simulation of a litfoff from the Moon. Stafford and Cernan would then rejoin Young in the CSM. After jettisoning the LM’s ascent stage and completing 11 more orbits around the Moon, Apollo 10 would fire its SPS engine for the retrun trip to Earth, ending with a splashdown in the Pacific Ocean. Except for the actual descent to and touchdown on the surface, Apollo 10 would follow all the steps of the actual Moon landing mission.
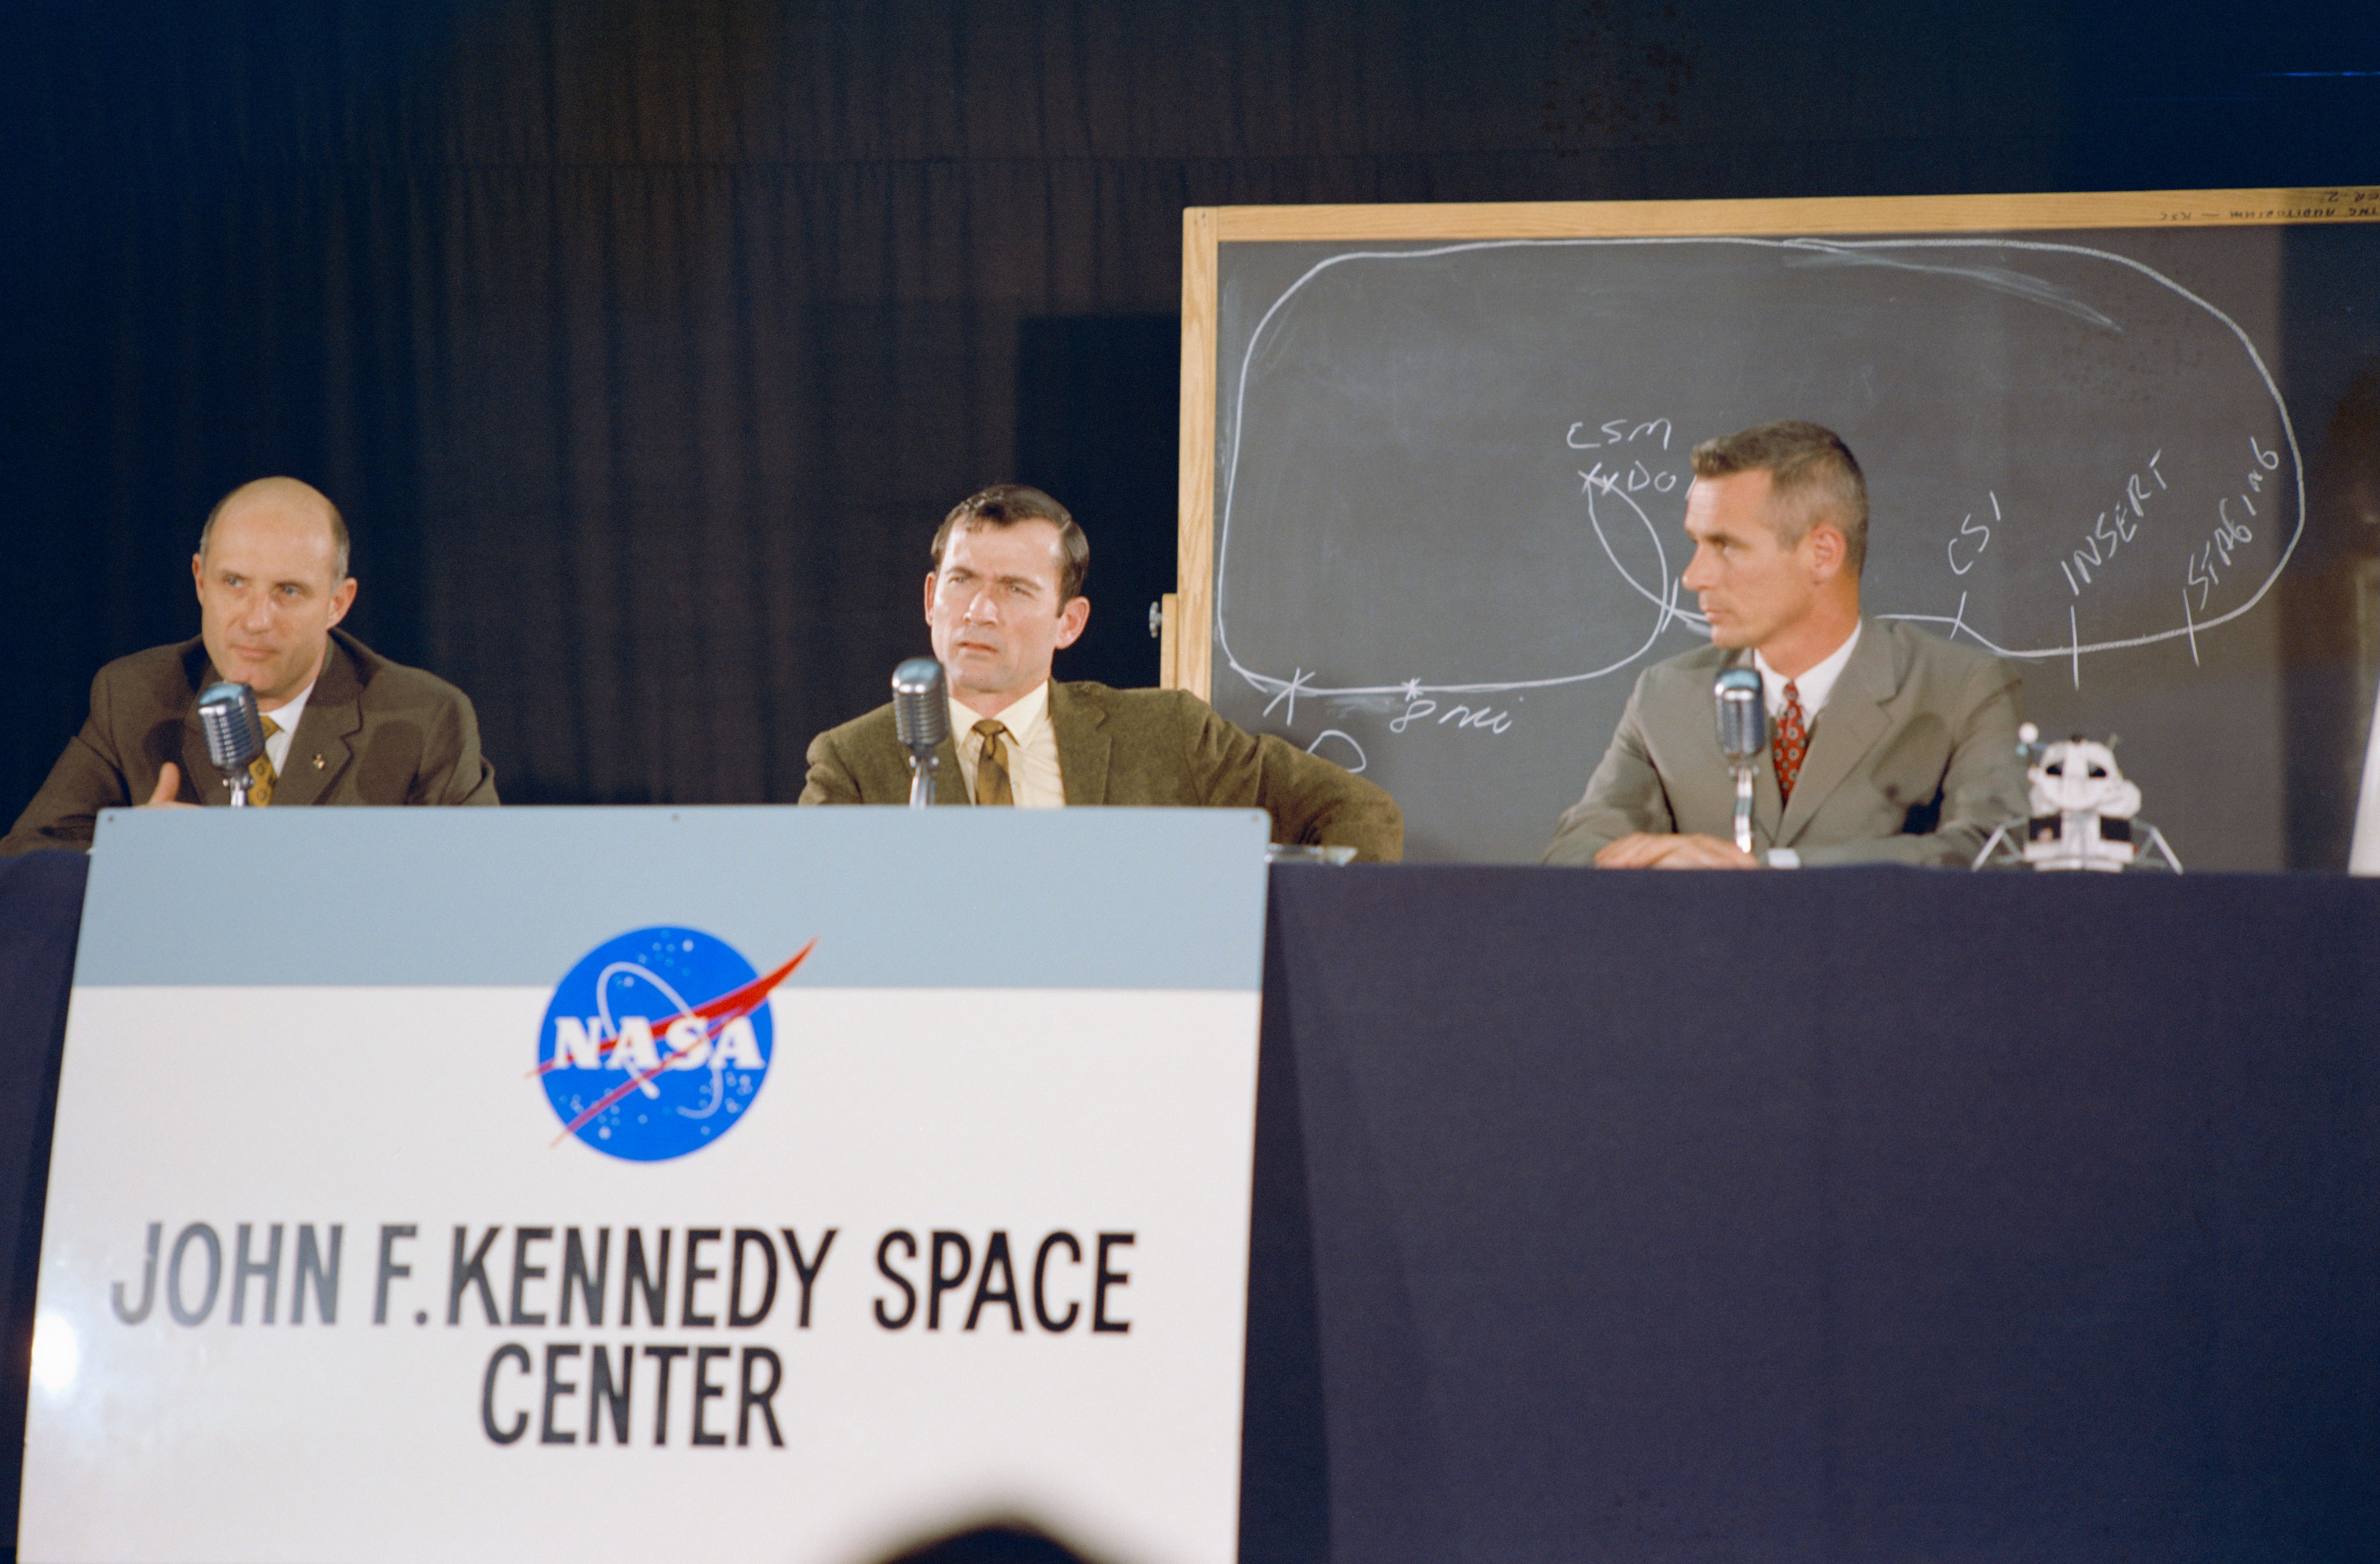
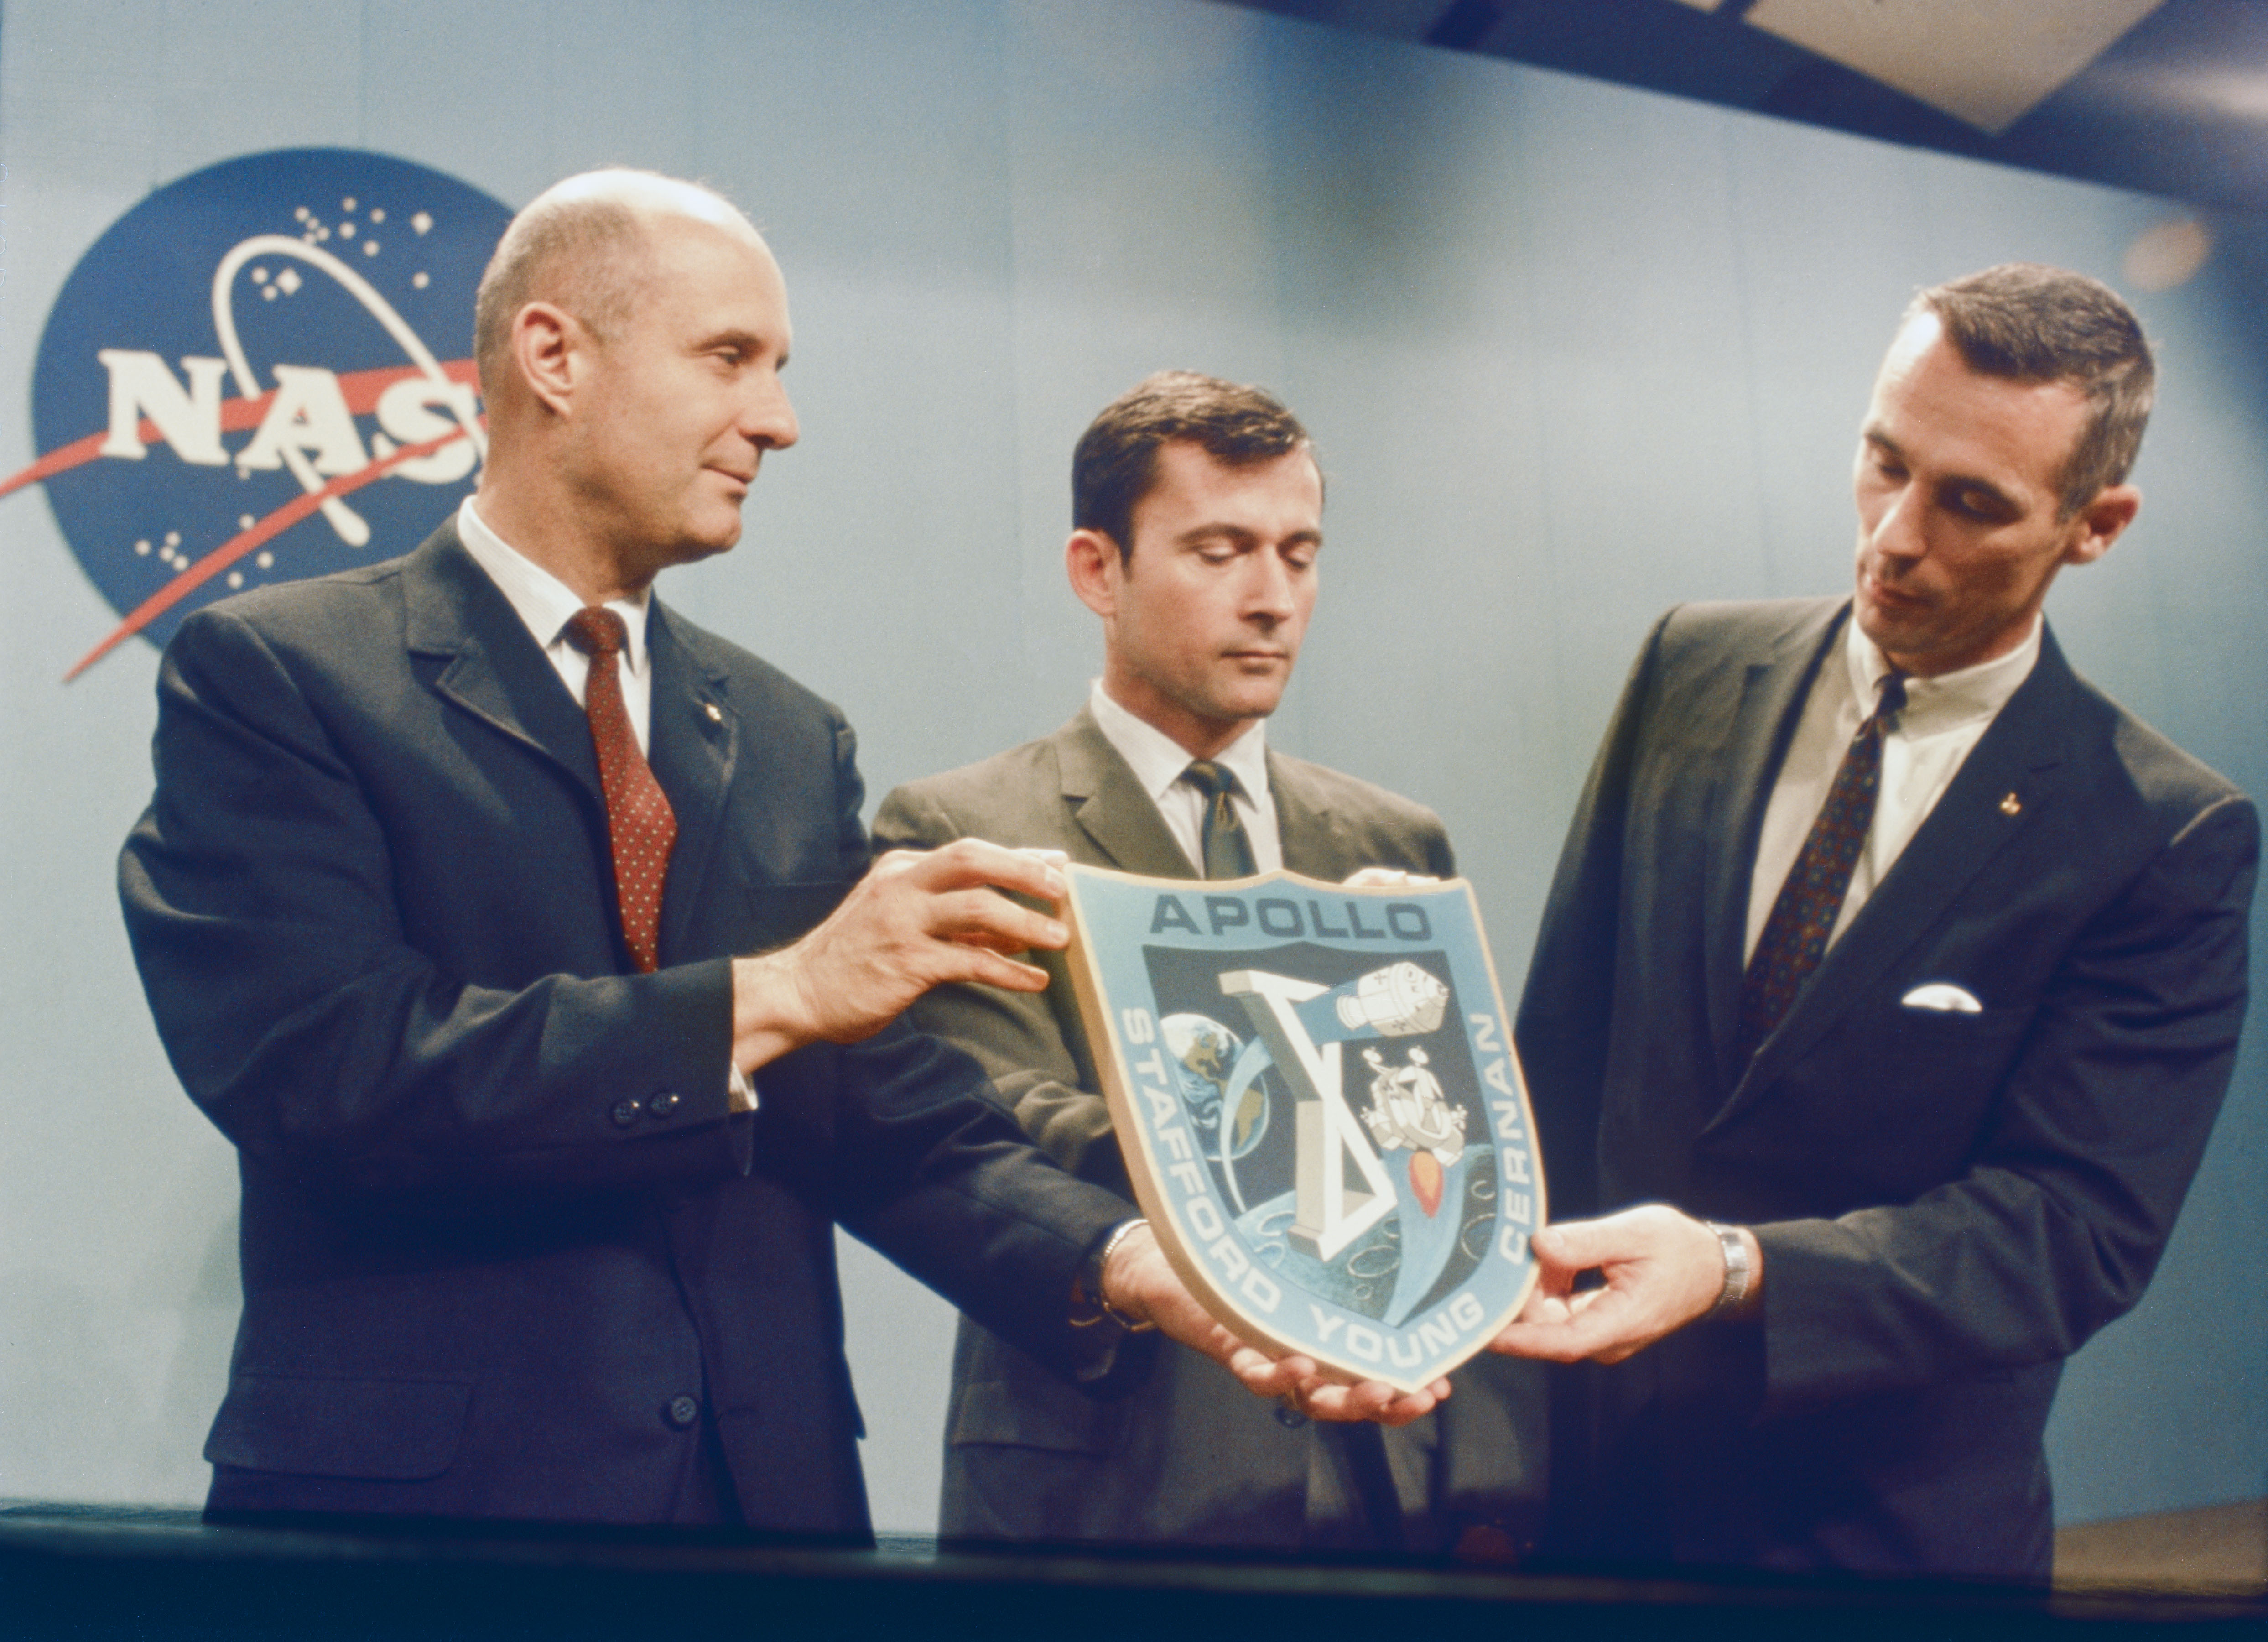
Apollo 10 astronauts Thomas P. Stafford, left, John W. Young, and Eugene A. Cernan during a press conference at NASA’s Kennedy Space Center in Florida Stafford, left, Young, and Cernan hold their mission patch following a press conference at the Manned Spacecraft Center, now NASA’s Johnson Space Center in Houston
Left: Apollo 10 astronauts Thomas P. Stafford, left, John W. Young, and Eugene A. Cernan during a press conference at NASA’s Kennedy Space Center in Florida. Right: Stafford, left, Young, and Cernan hold their mission patch following a press conference at the Manned Spacecraft Center, now NASA’s Johnson Space Center in Houston.

During two press conferences, at NASA’s Kennedy Space Center (KSC) in Florida on April 8 and at the Manned Spacecraft Center (MSC), now NASA’s Johnson Space Center in Houston, on April 26, Stafford, Young, and Cernan discussed their eight-day mission with reporters. The trio described their upcoming flight as essentially a dress rehearsal for the Moon landing, with Stafford stating that Apollo 10 will “sort out all the unknowns and actually pave the whole way for the lunar landing mission.” They displayed their mission patch and revealed the call signs for their spacecraft – Charlie Brown for the CSM and Snoopy for the LM, after characters in the Peanuts© comic strip by Charles M. Schulz. According to Apollo Spacecraft Program Manager George M. Low, Apollo 10 would do “everything that we did on Apollo 9, only in lunar orbit.” Officials also announced that the Apollo 10 CM may carry a color TV system in addition to the standard black and white cameras. The color camera, equipped with a zoom lens, would provide live TV broadcasts from the spacecraft during critical mission operations and provide viewers at home with a glimpse of life aboard an Apollo spacecraft during a lunar mission. They also expected views of the Earth as well as the lunar landscape. During their low pass over the Moon, Stafford and Cernan would take high resolution stereo photographs of the Apollo 11 landing site. They would also activate the LM’s landing radar during the low passes, a critical test before the Moon landing. Regarding the complexity of the mission, Cernan added “I’ve never been involved in anything that has required as great an amount of coordination and team work as … to work with two vehicles in a lunar environment.” 
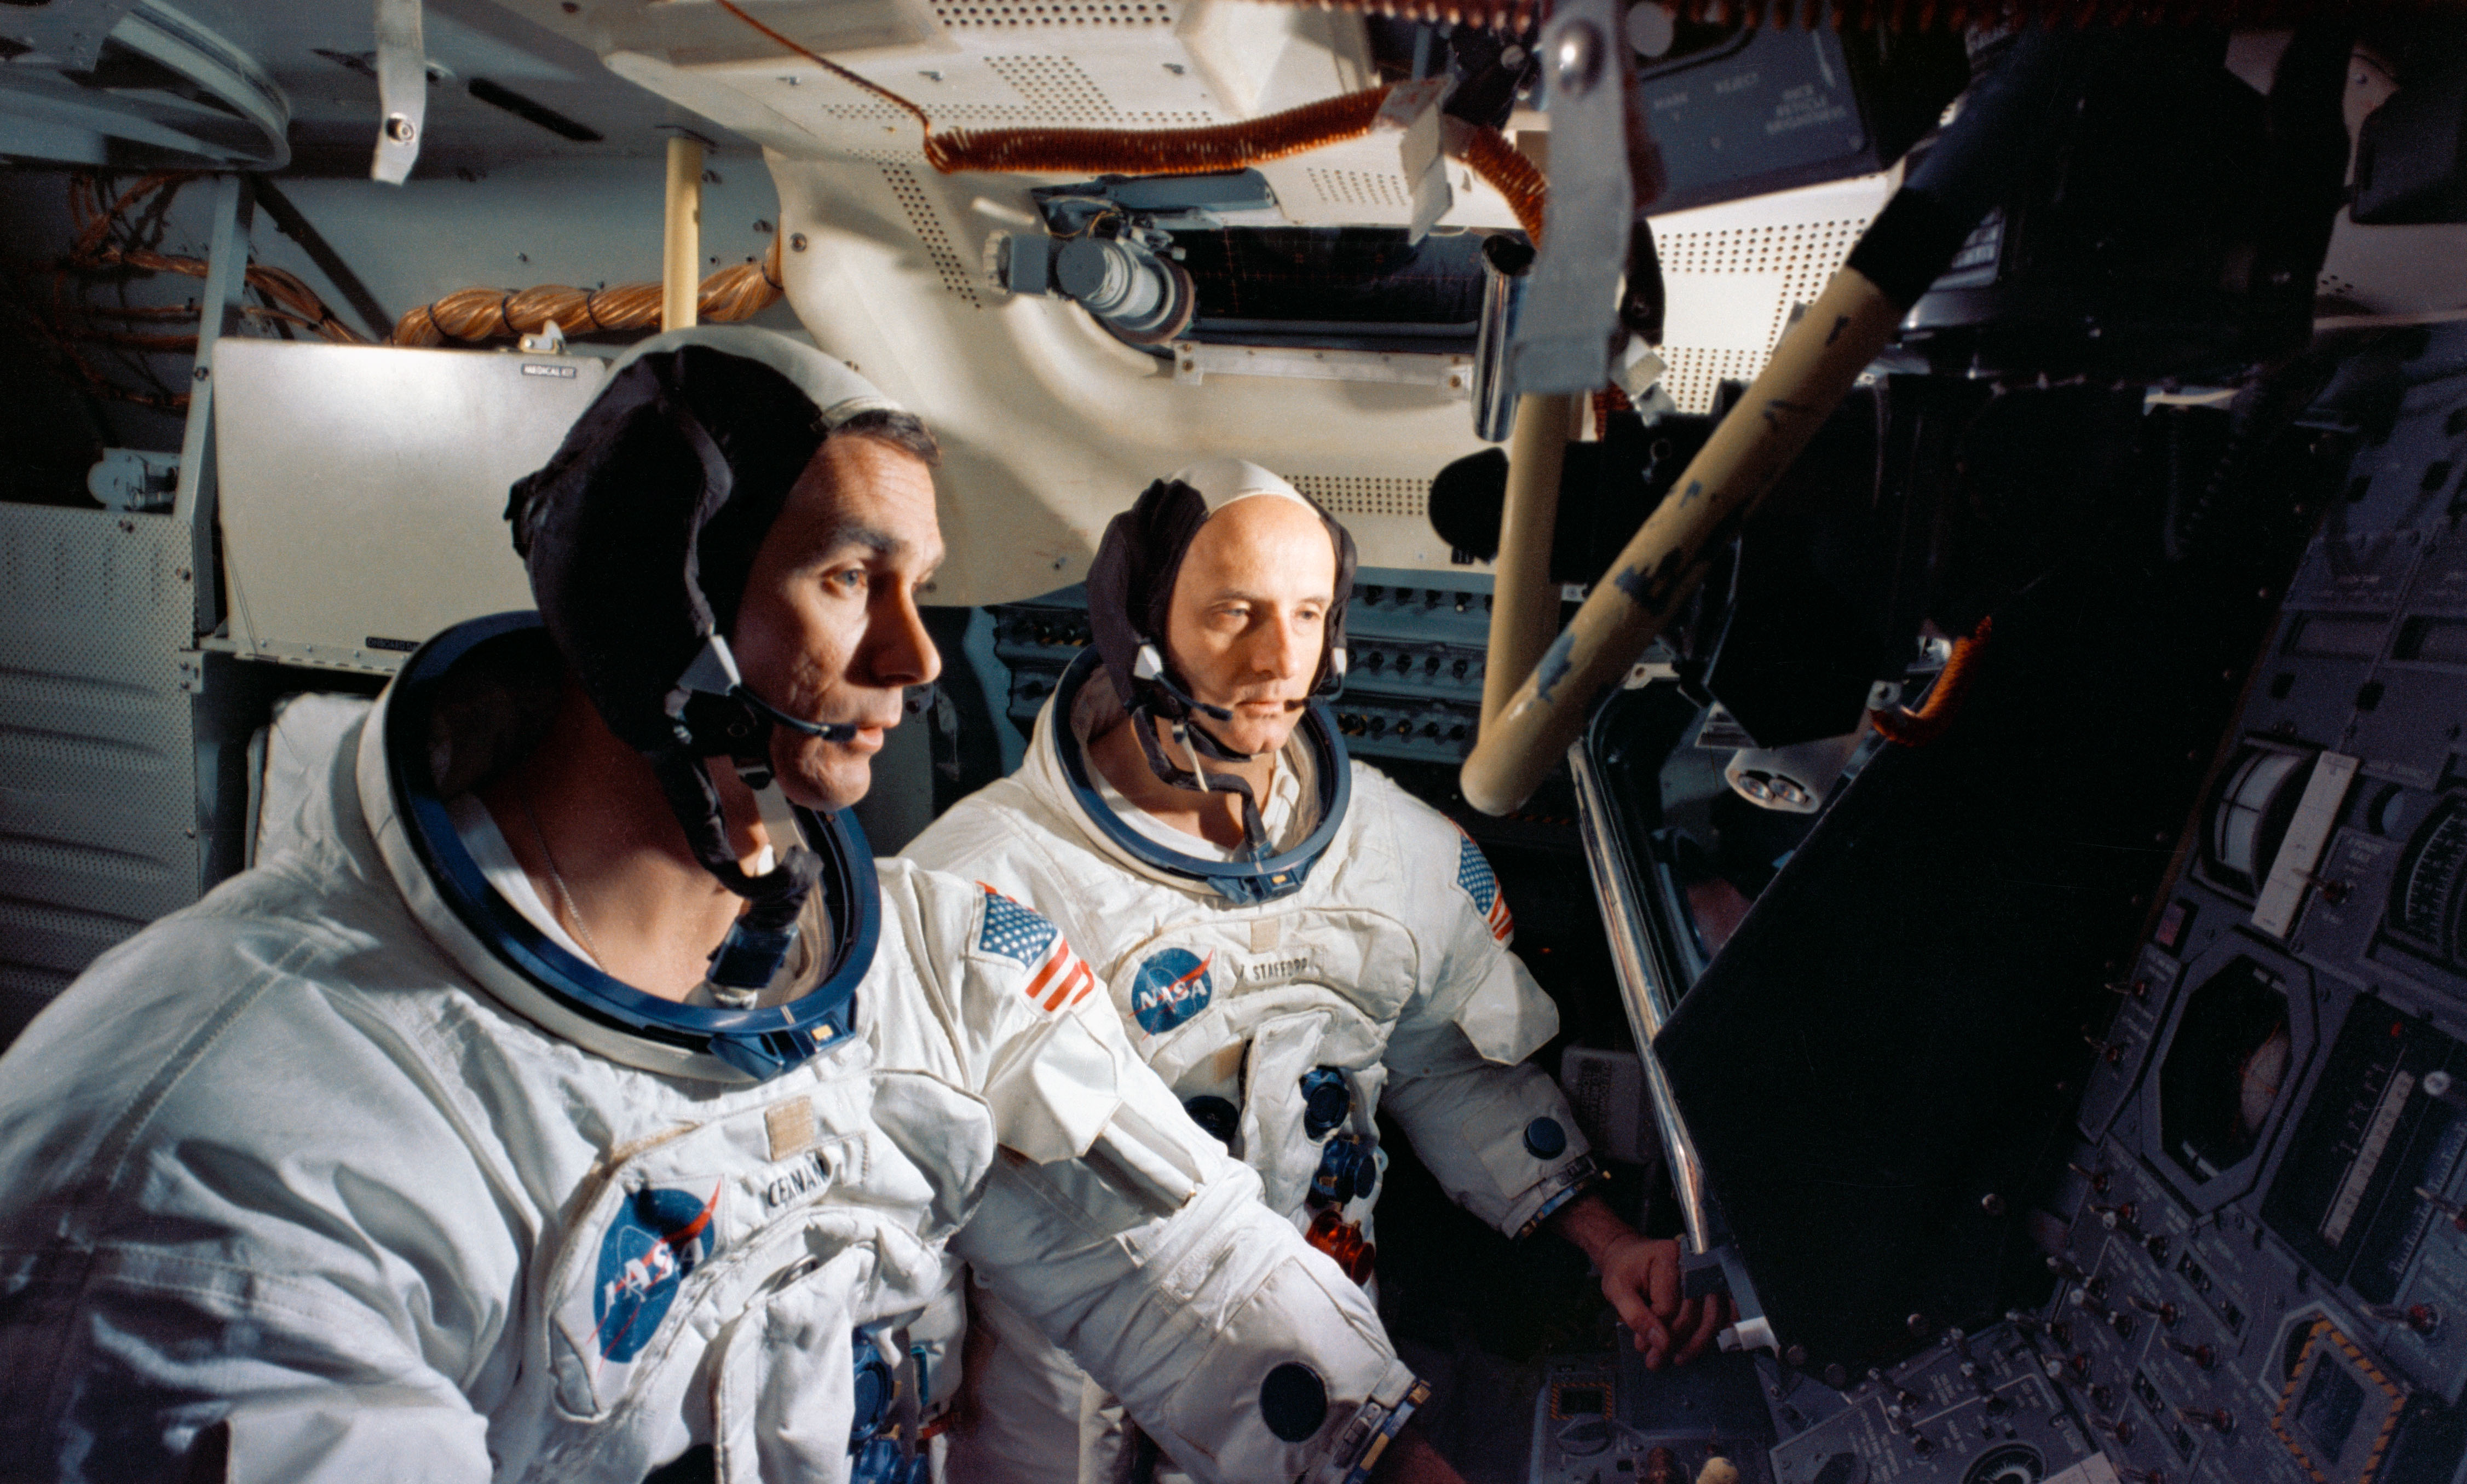
Apollo 10 astronauts Eugene A. Cernan, left, and Thomas P. Stafford in the Lunar Module simulator Apollo 10 astronaut John W. Young in the Command Module simulator
Left: Apollo 10 astronauts Eugene A. Cernan, left, and Thomas P. Stafford in the Lunar Module simulator. Right: Apollo 10 astronaut John W. Young in the Command Module simulator.

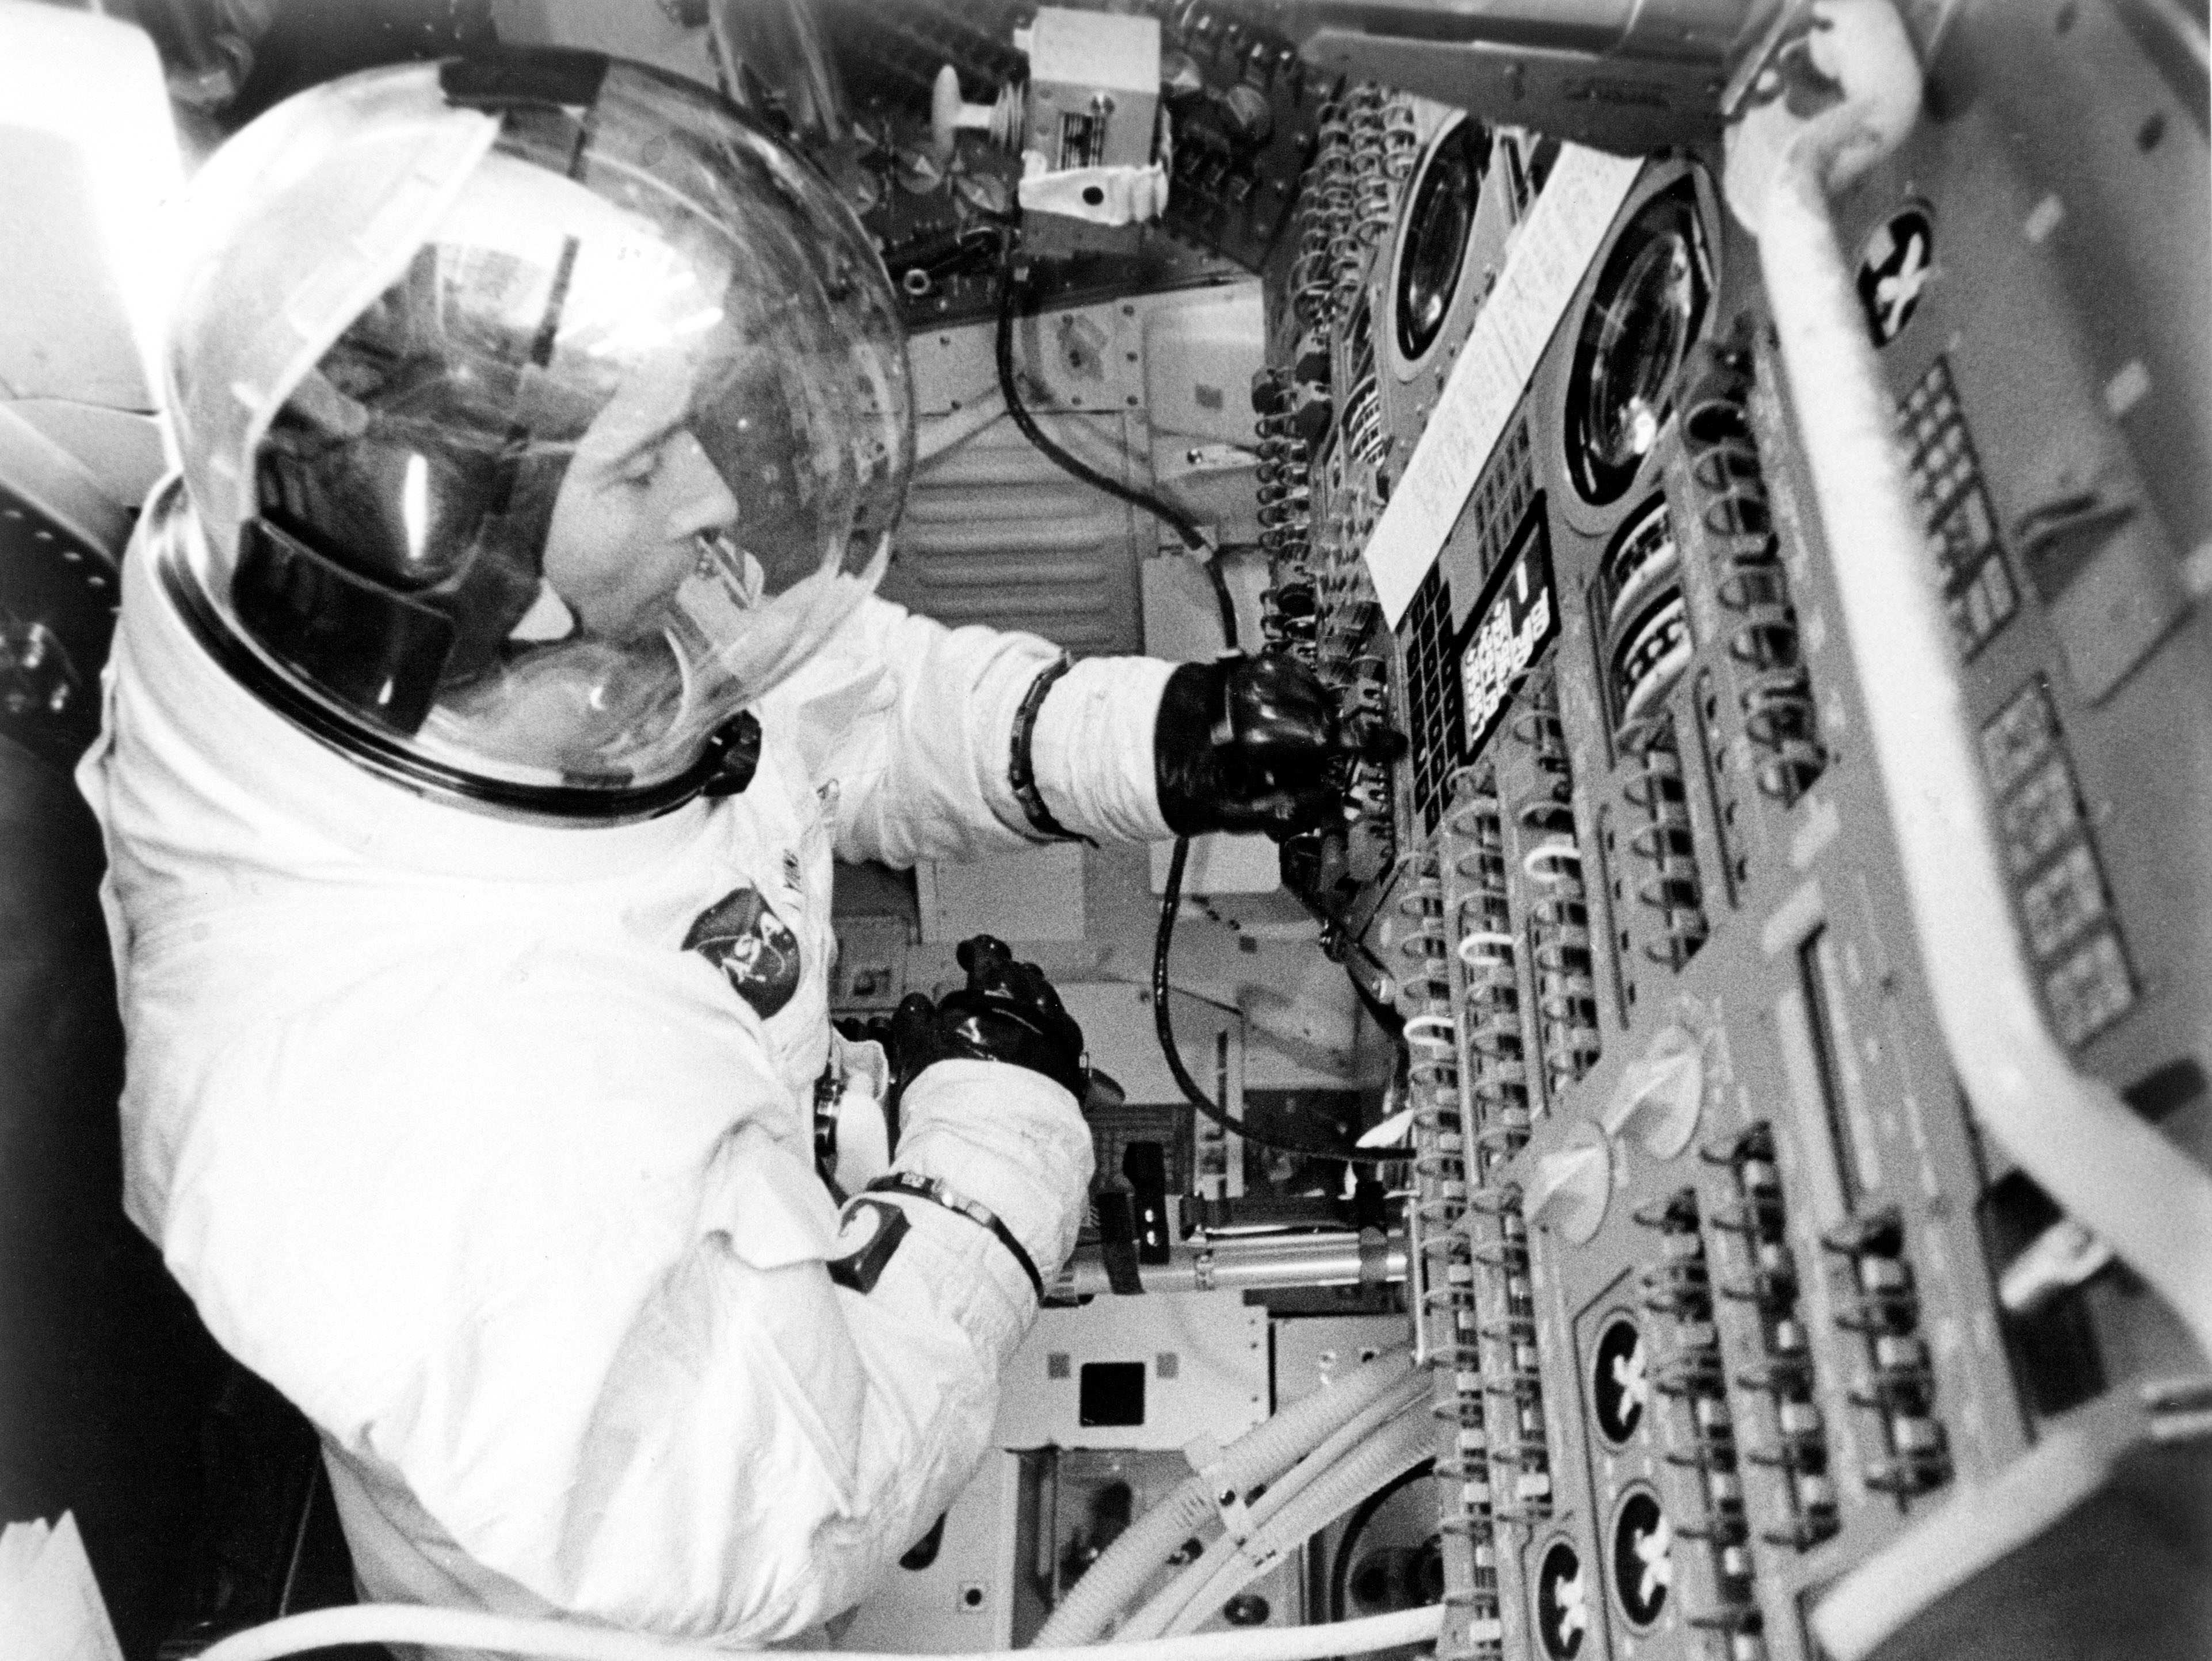
When not speaking with the press, Stafford, Cernan, and Young, as well as their backups, spent time almost daily in the LM and CSM simulators at MSC and KSC rehearsing various aspects of their upcoming mission. During many of these simulations, Mission Control in Houston was tied in for flight controllers to gain experience. The astronauts also spent time reviewing procedures, updating checklists, and receiving briefings on spacecraft systems and lunar topography.
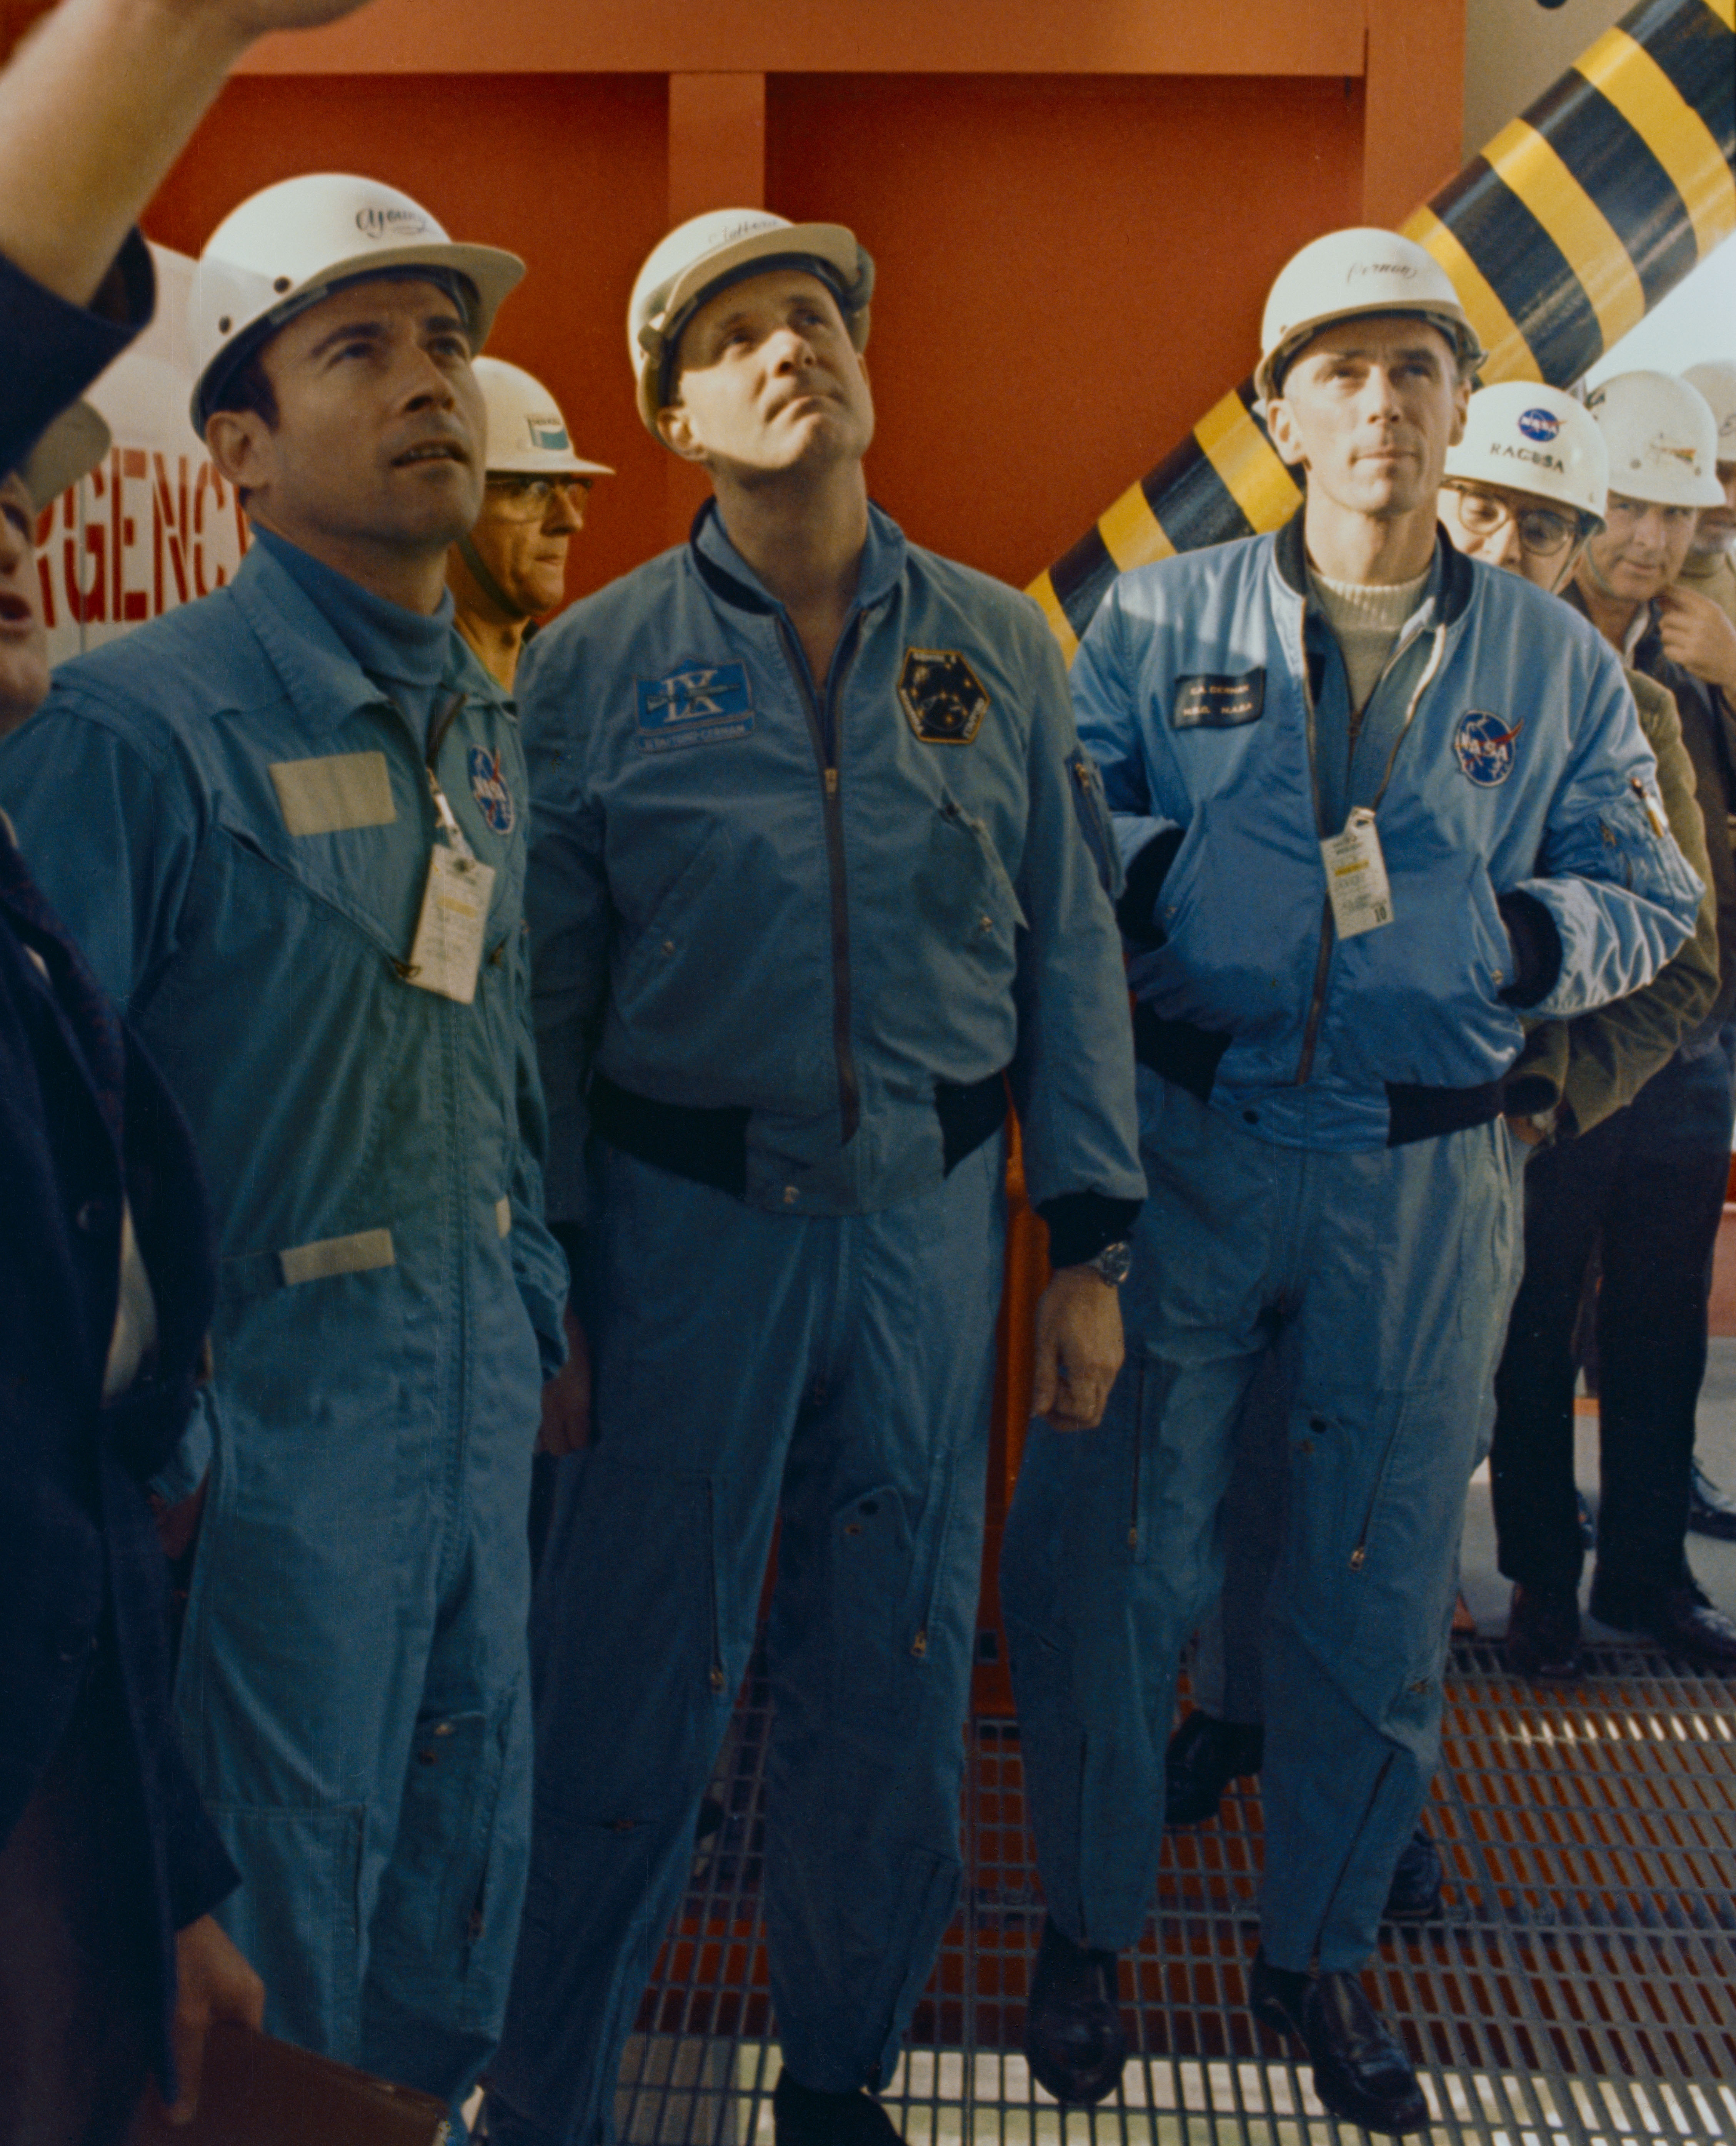
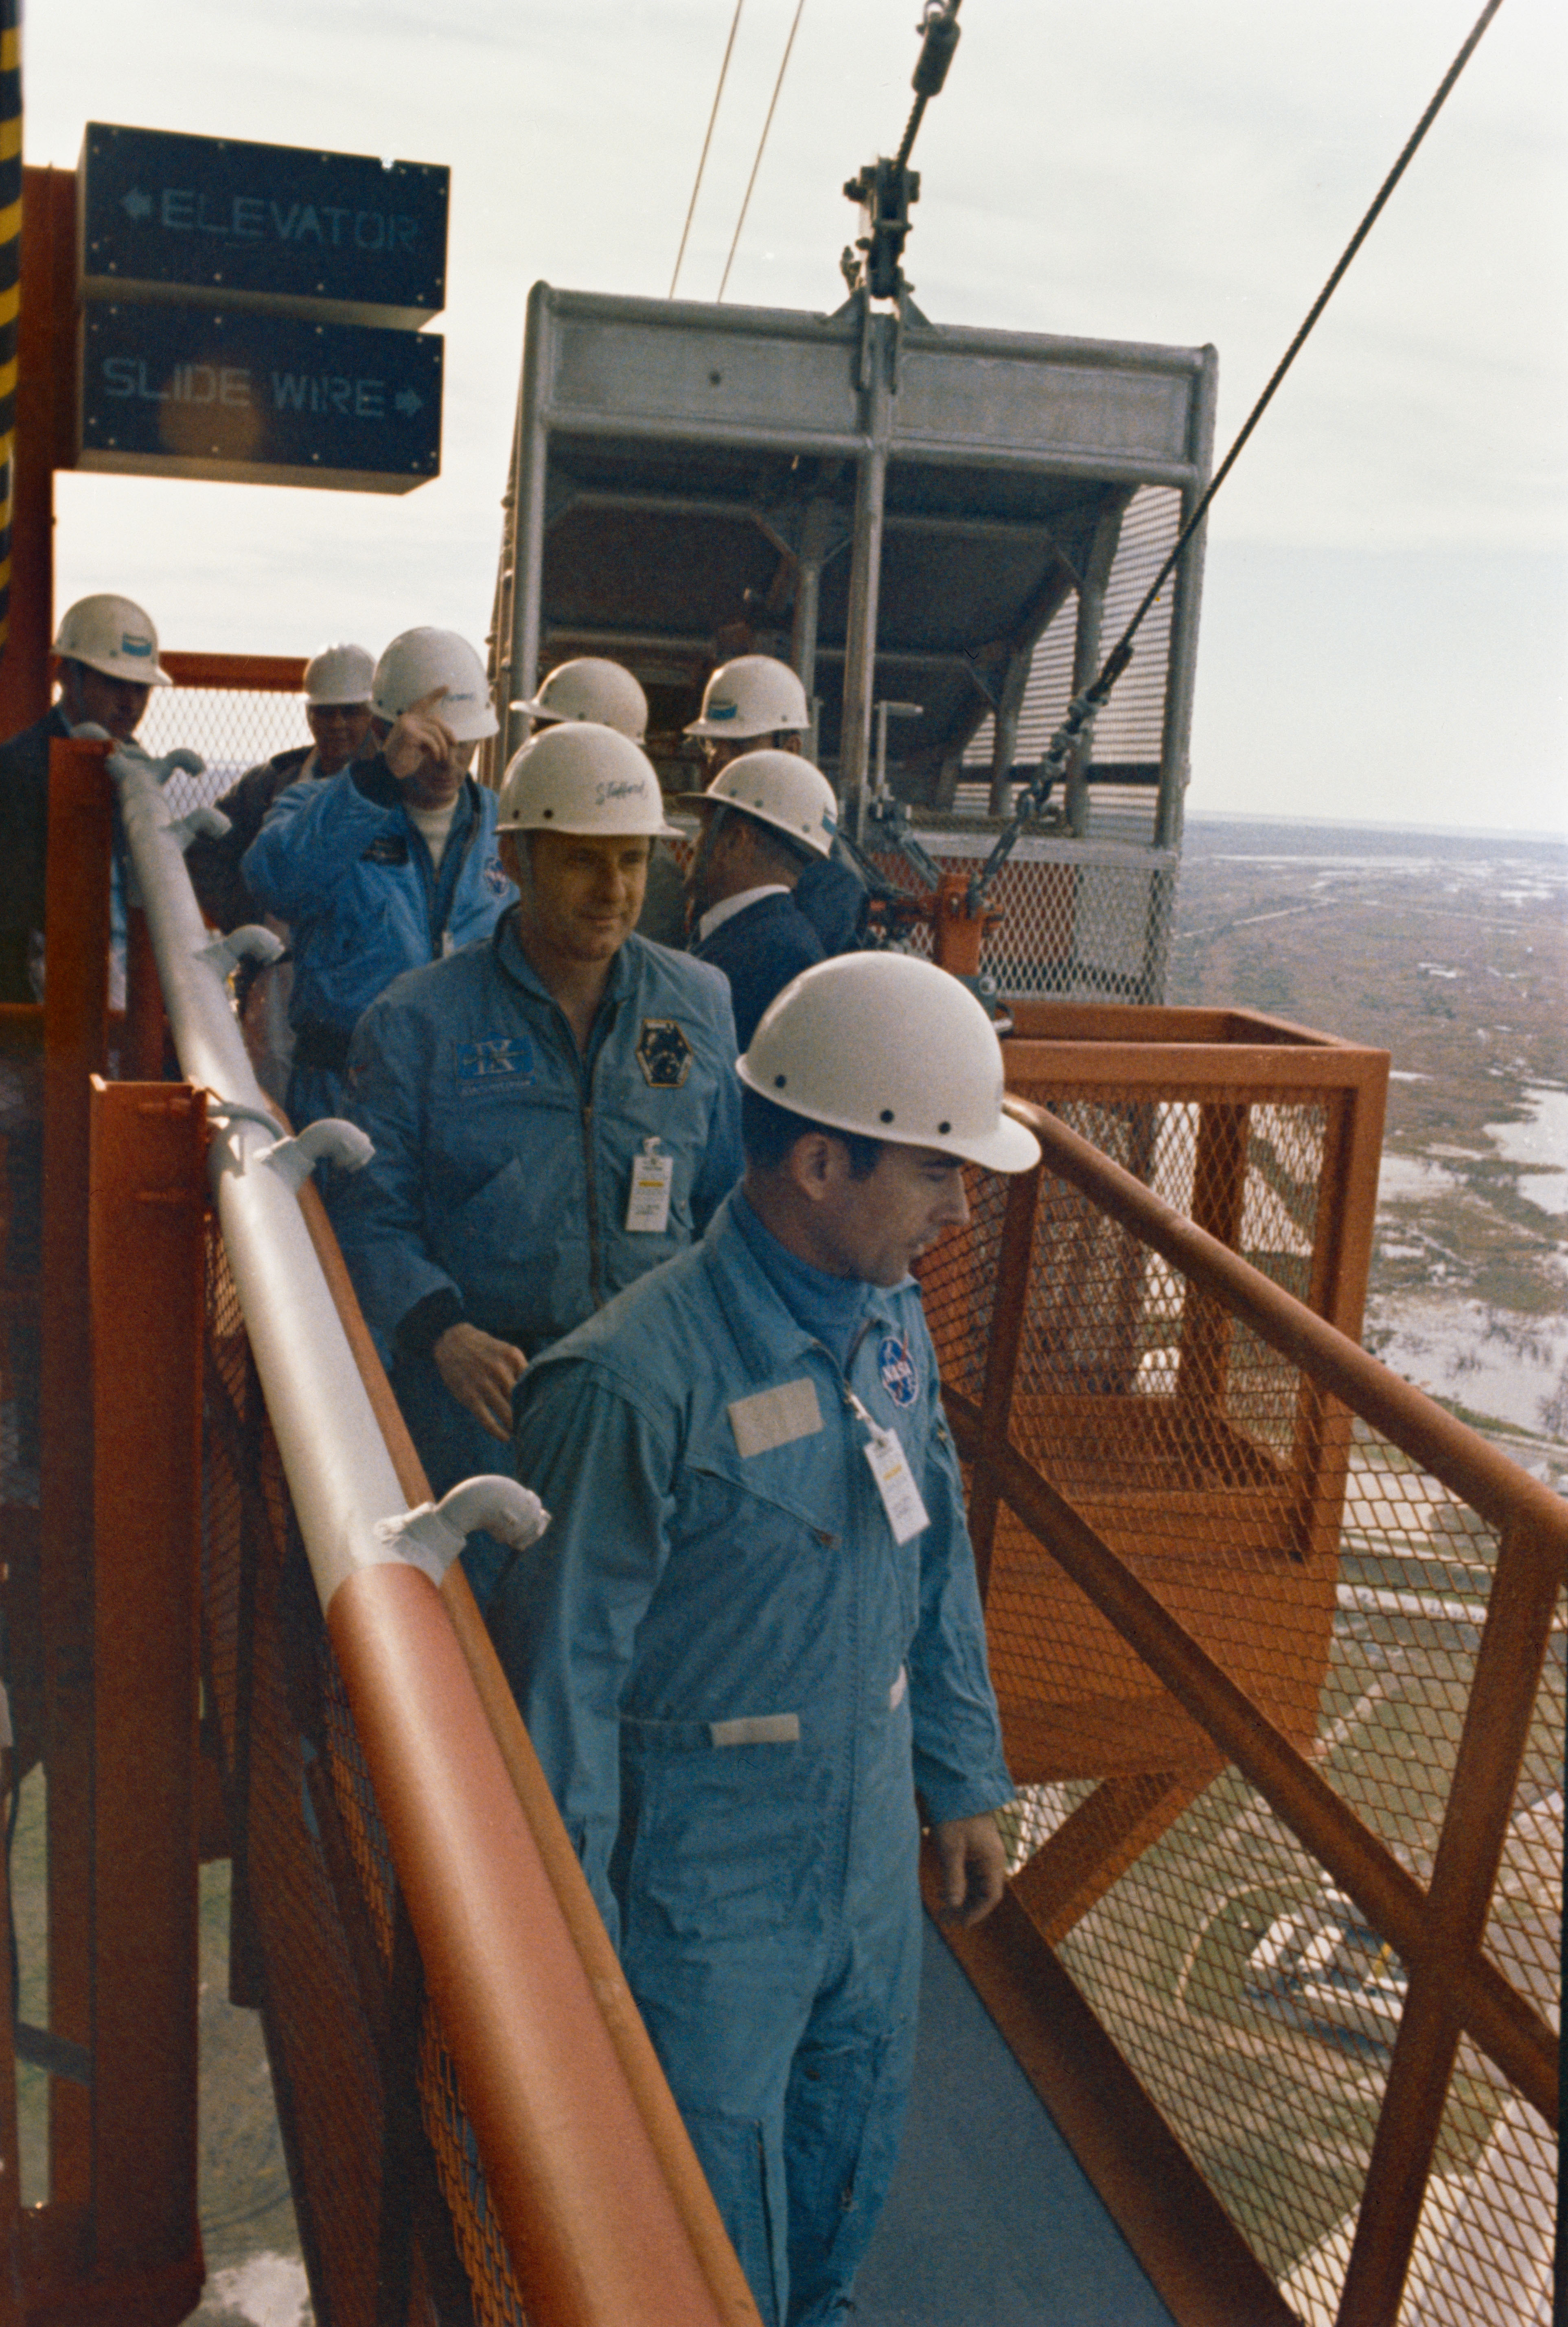
Apollo 10 astronauts John W. Young, left, Thomas P. Stafford, and Eugene A. Cernan during an inspection visit at Launch Pad 39B Young, front, Stafford, and Cernan inspect the slide wire escape mechanism at the top of Launch Pad 39B Young, left, Stafford, and Cernan inside the blast room beneath the launch pad
Left: Apollo 10 astronauts John W. Young, left, Thomas P. Stafford, and Eugene A. Cernan during an inspection visit at Launch Pad 39B. Middle: Young, front, Stafford, and Cernan inspect the slide wire escape mechanism at the top of Launch Pad 39B. Right: Young, left, Stafford, and Cernan inside the blast room beneath the launch pad.

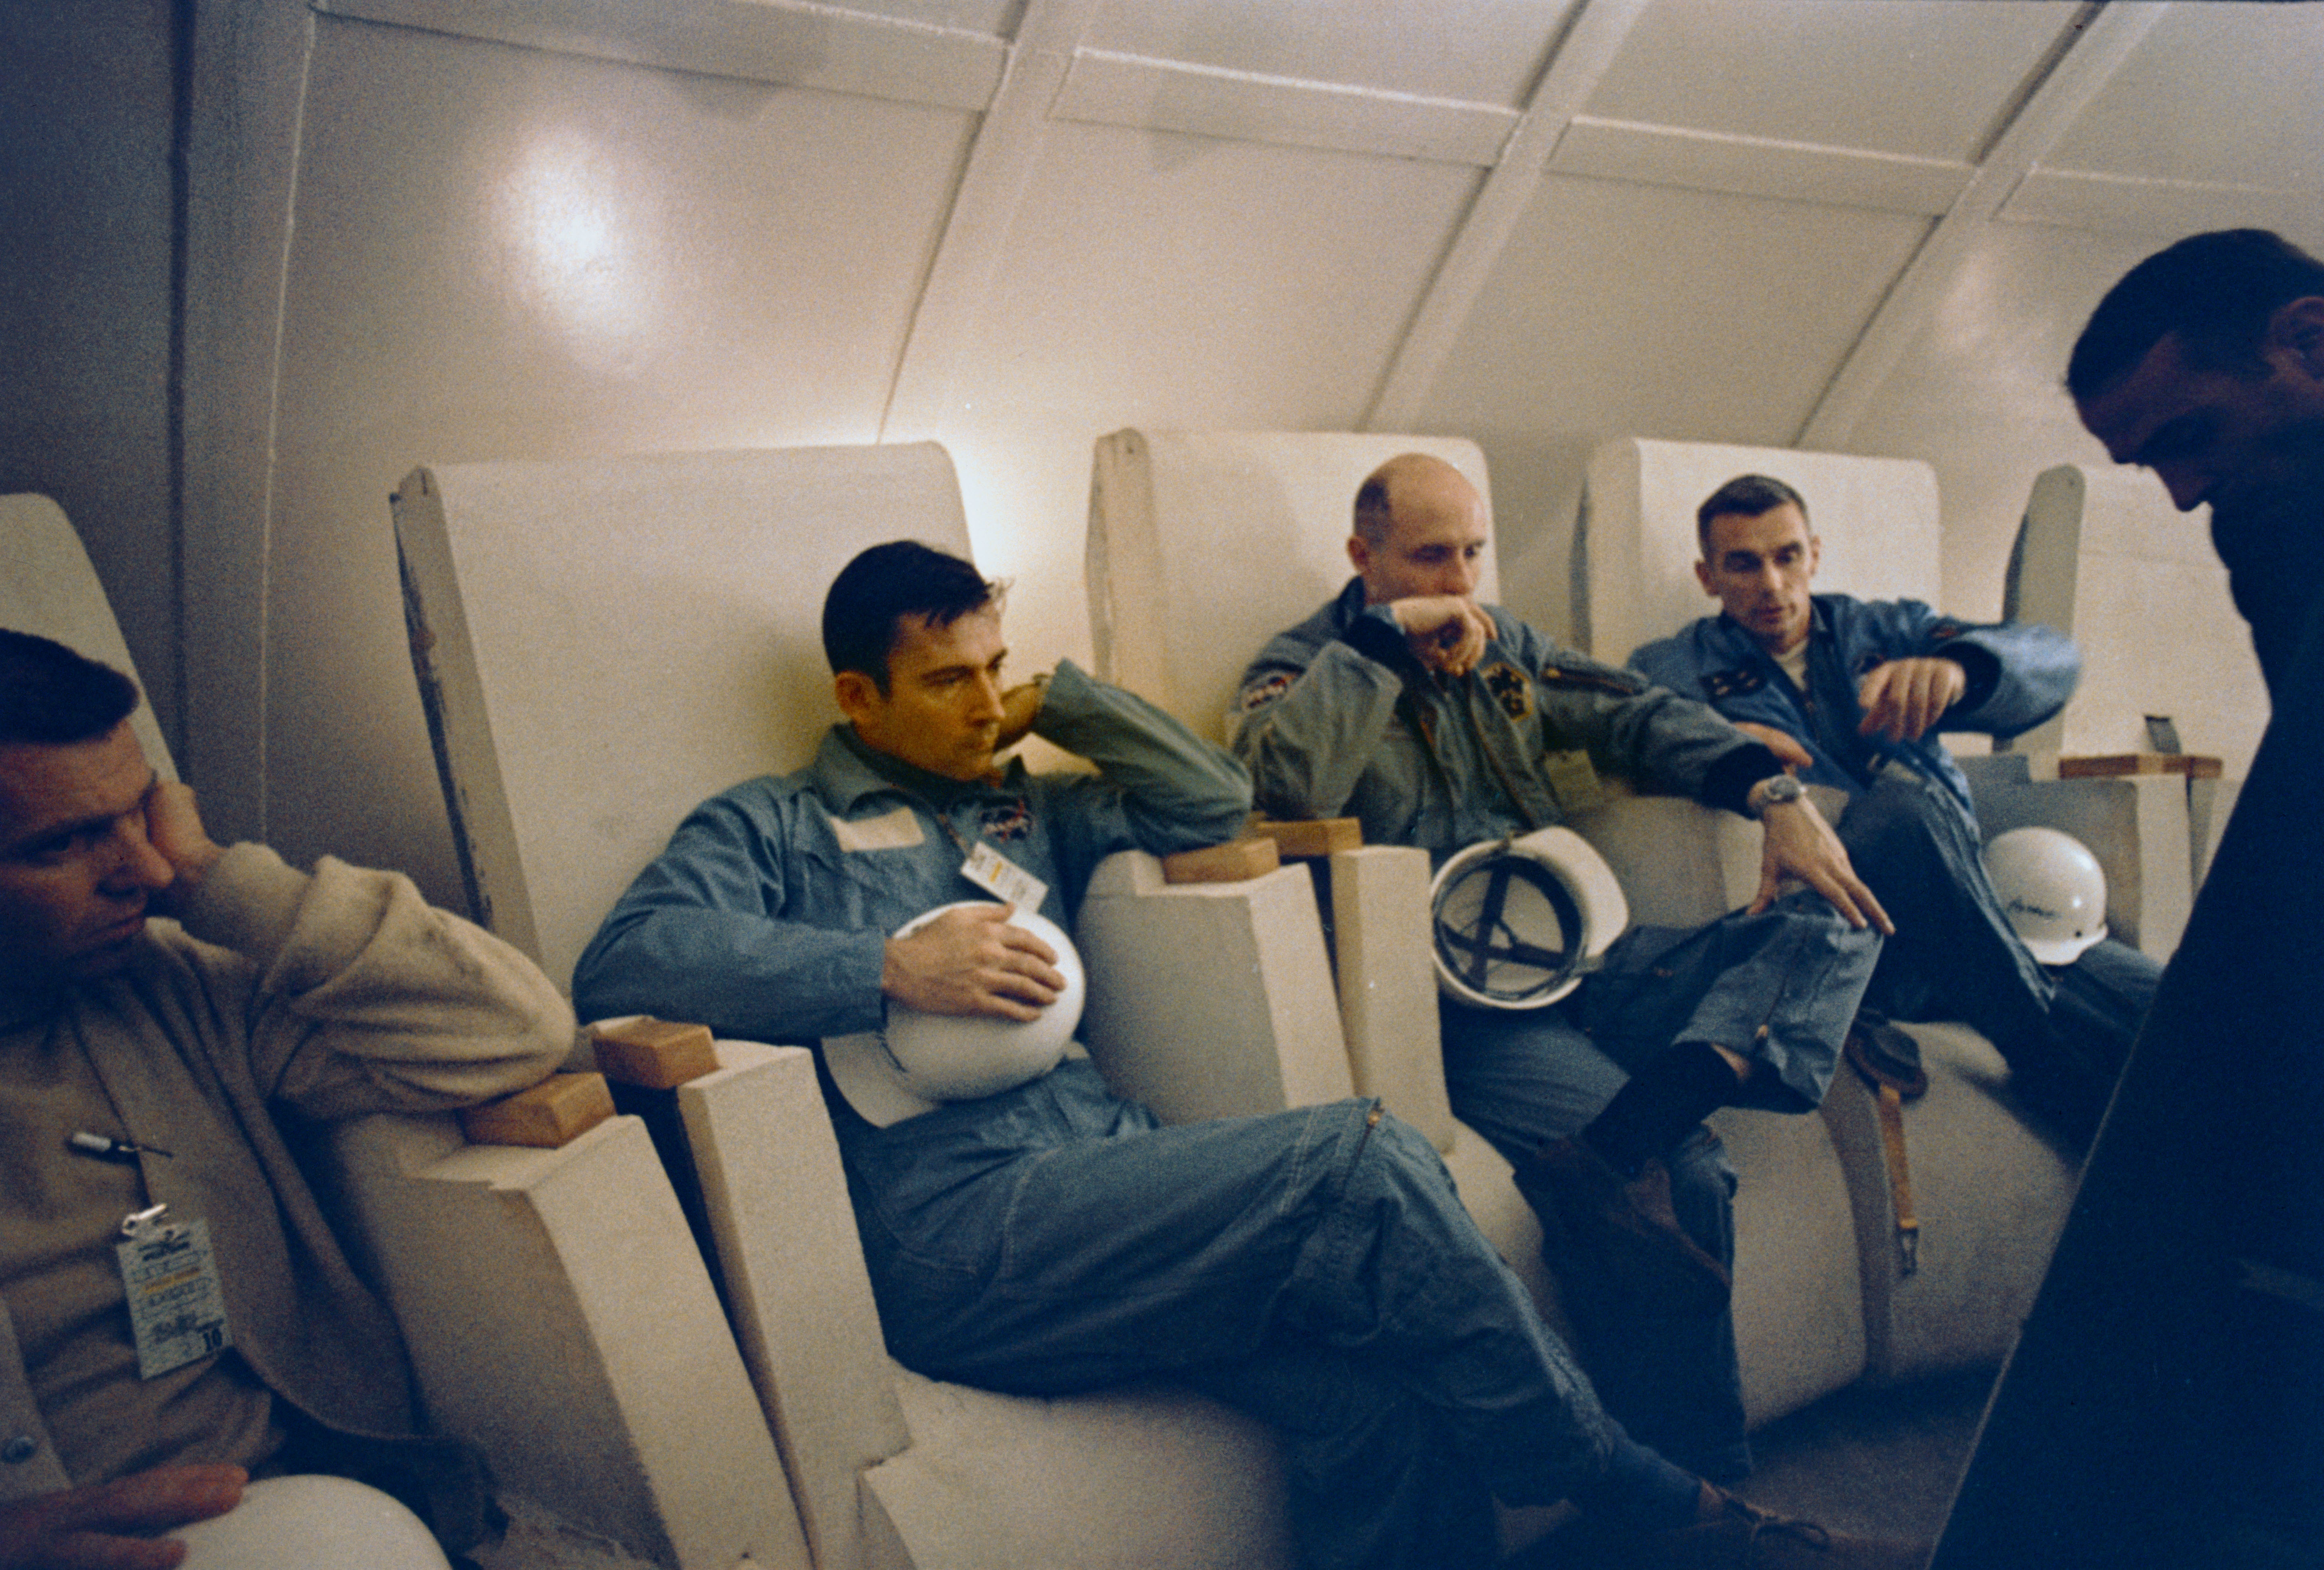
Engineers at KSC completed the Flight Readiness Test (FRT) between April 7 and 10, an activity that ensured the flight readiness of all the vehicle systems and their interaction with ground support equipment. Stafford, Cernan, and Young took part in an emergency egress drill at Launch Pad 39B, including inspecting the slide wire escape mechanism and the blast room, a concrete reinforced structure under the launch pad used in case of a catastrophic emergency during fueling of the rocket or the countdown. Managers from NASA Headquarters, KSC, MSC, and the Marshall Space Flight Center in Huntsville, Alabama, met at KSC on April 23 to conduct the Flight Readiness Review for Apollo 10. At the conclusion of the meeting, during which they reviewed all aspects of the flight hardware as well as the readiness of the crew, the control centers, and the Manned Spaceflight Network, the managers decided that the mission could proceed toward a launch on May 18. On April 28, a planned power outage to conduct maintenance at KSC’s Launch Control Center also caused power outages at the launch pad, where not all systems had backup power. Workers had already loaded the rocket’s first stage with its flight load of RP-1 fuel, and the loss of power caused valves at the bottom of the tank to open, spilling 5,280 liters of fuel onto the launch pad’s flame trench. Since the fuel tank did not have any relief valves to allow air to enter the tank as fuel drained out, the loss of fluid volume caused the top of the tank to dimple inward. Quick thinking engineers at the pad instituted a work around to refill the tank and the dimple popped out with a very audible “boomp.” Launch pad manager John J. “Tip” Talone concluded of the quick action, “It worked like a champ.” Engineers resolved concern with any possible cracks in the fuel tank through non-destructive testing and visual inspections. The Countdown Demonstration Test, a final dress rehearsal of the countdown, took place between April 29 and May 6, with Stafford, Young, and Cernan participating in the final phase as if on launch day.
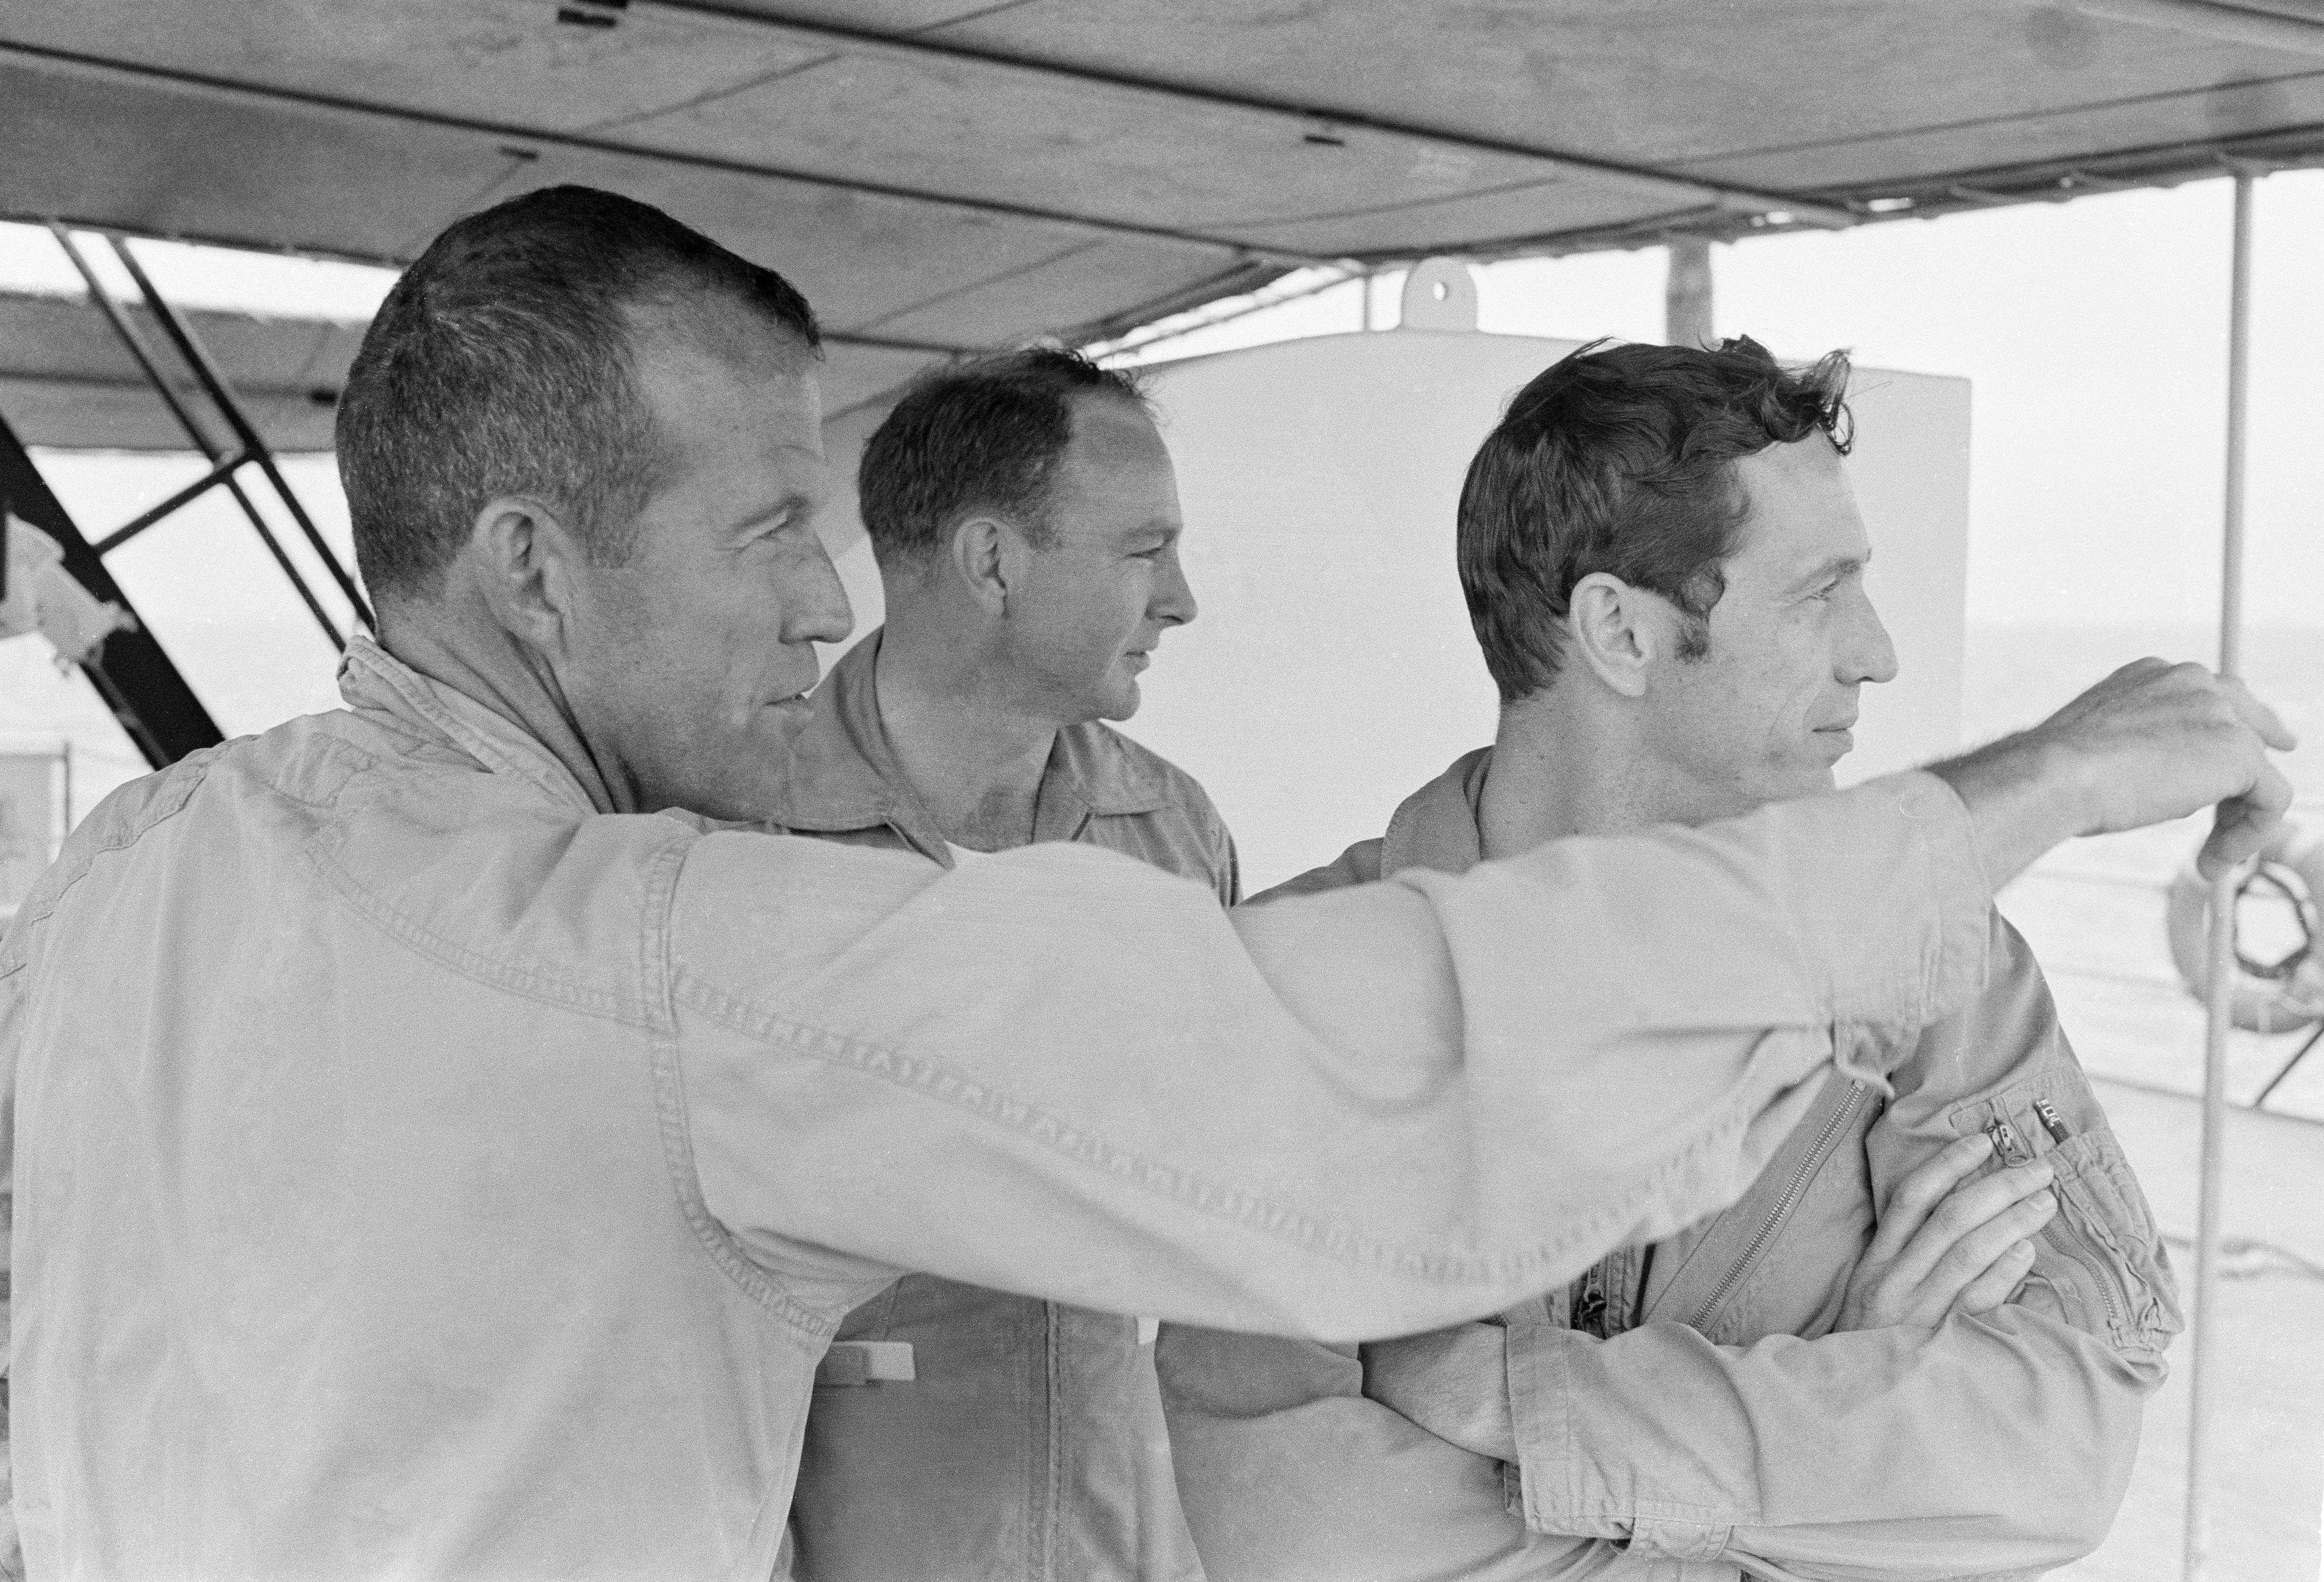
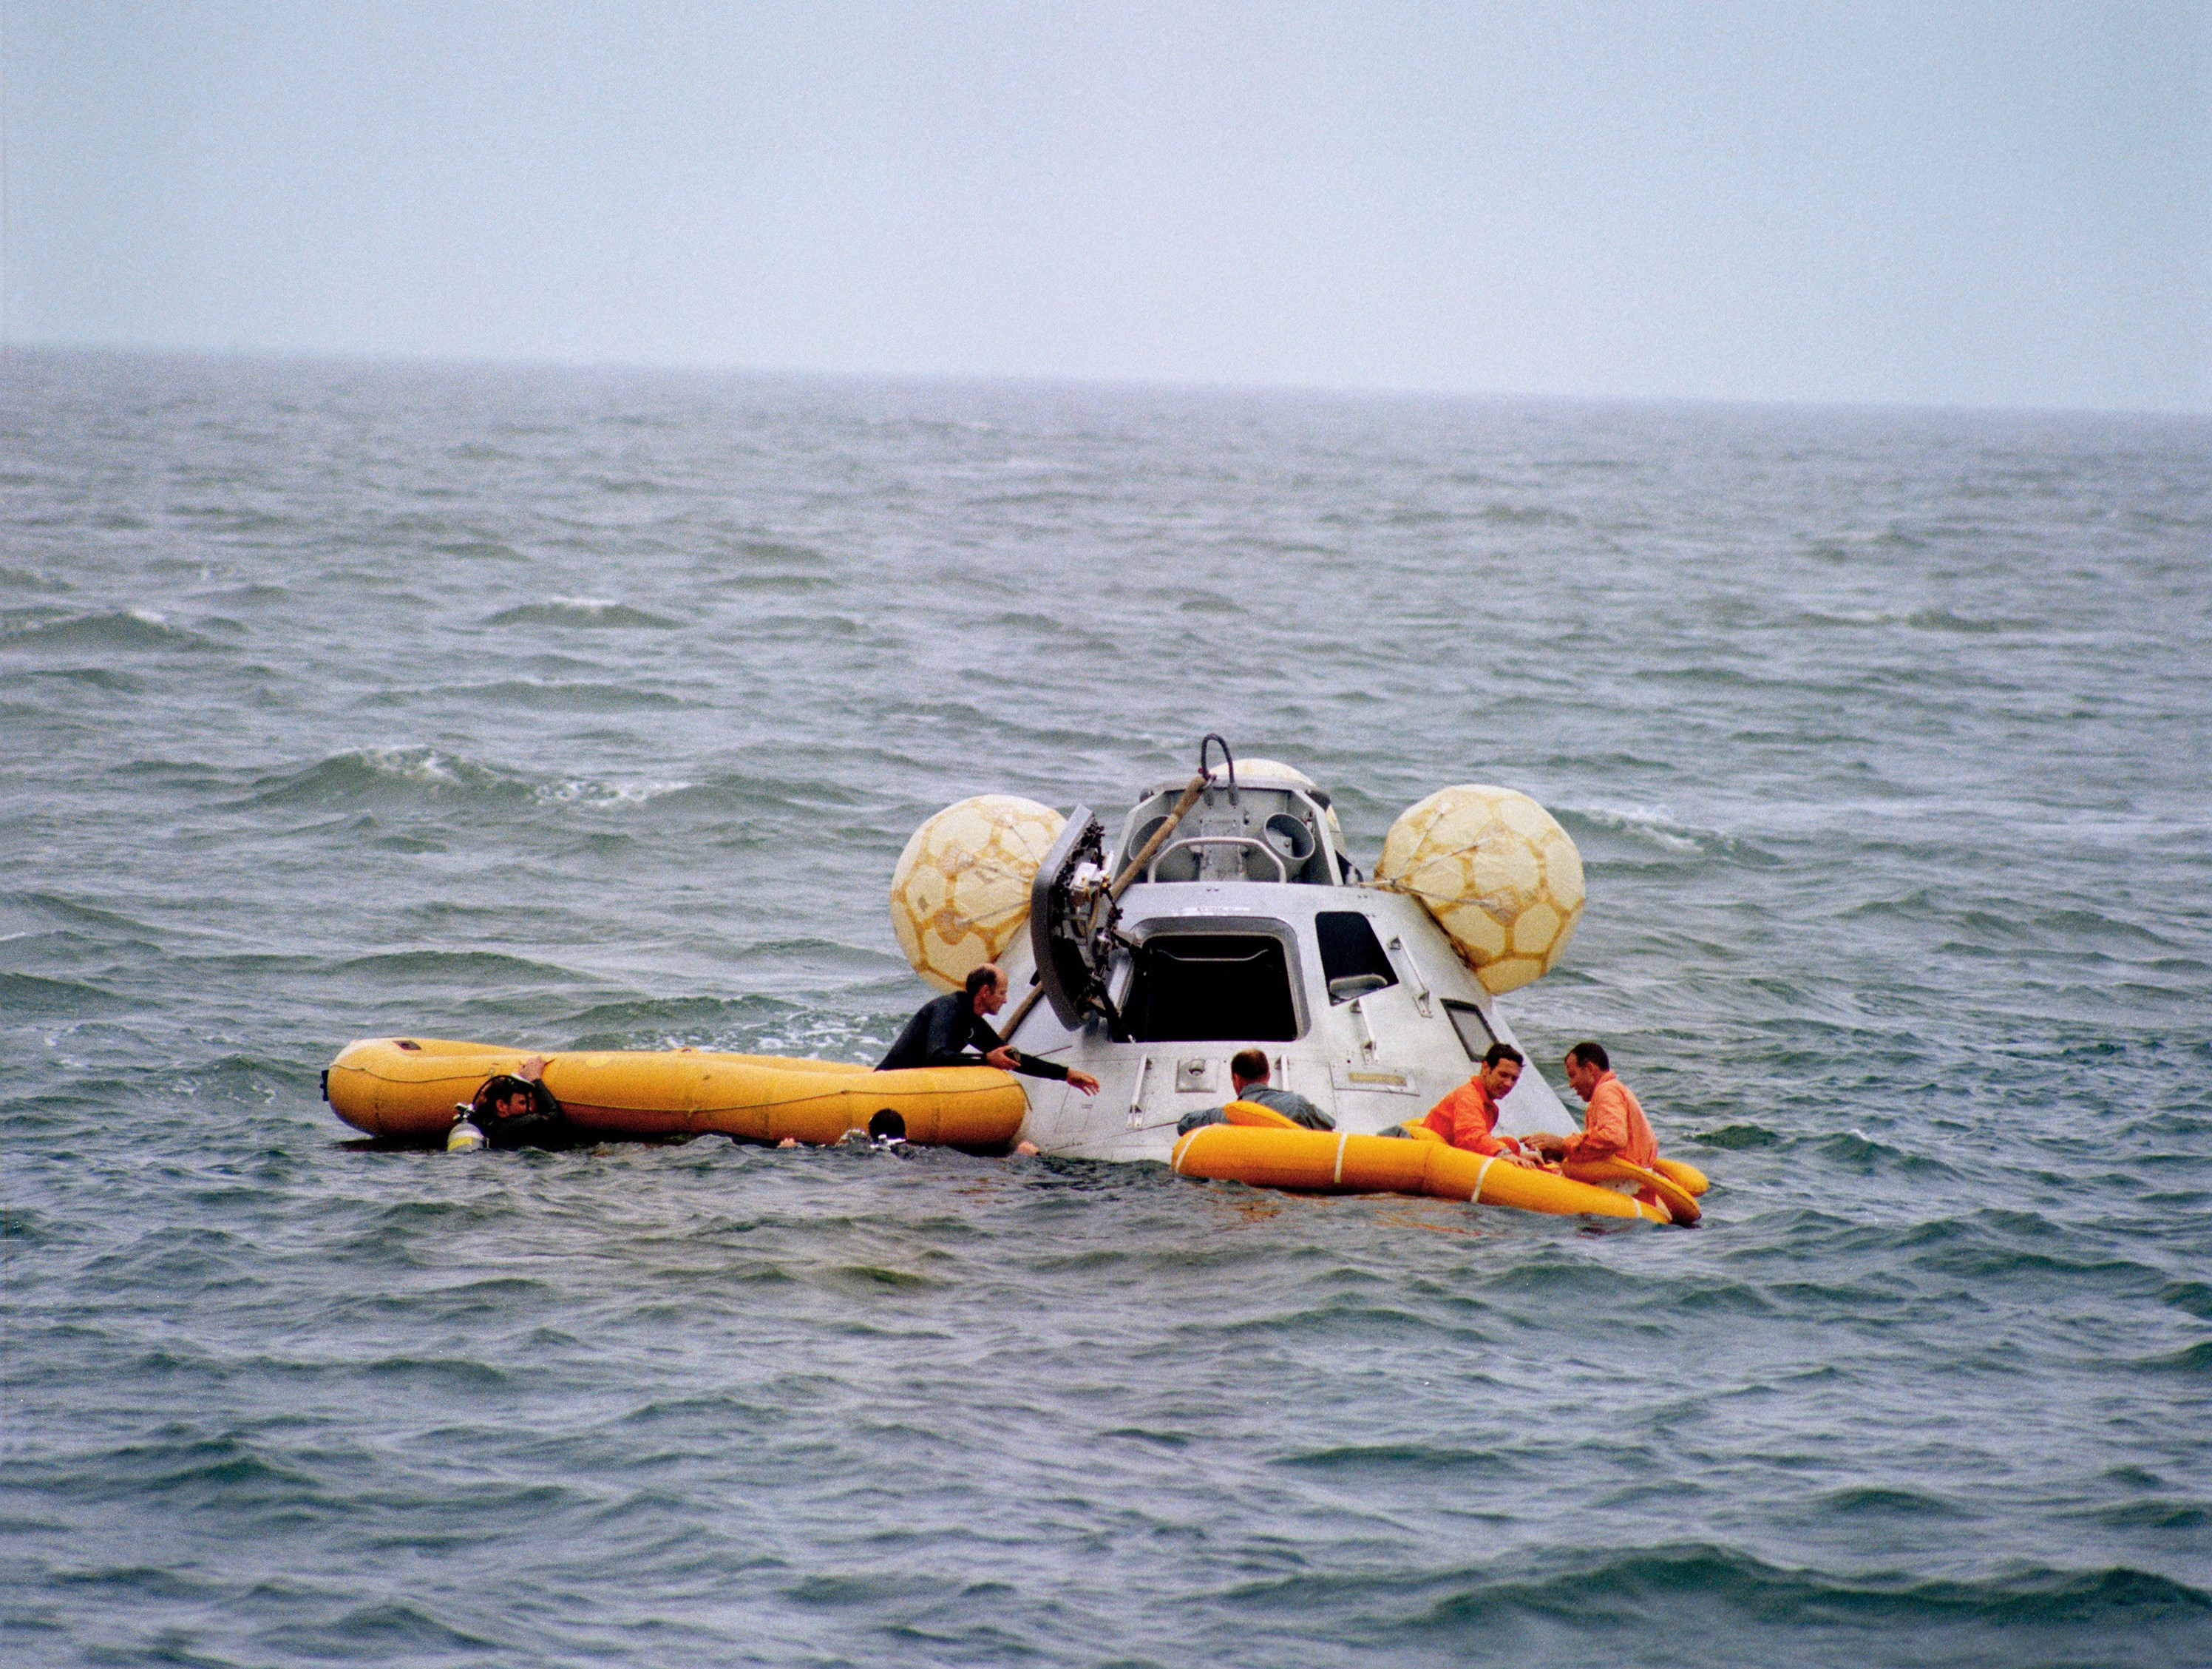
The Apollo 10 backup crew of L. Gordon Cooper, left, Edgar D. Mitchell, and Donn F. Eisele prepare for the water egress test aboard the MV Retriever in the Gulf of Mexico Mitchell, left, Eisele, and Cooper in the life raft await pickup by a helicopter during the water egress test
Left: The Apollo 10 backup crew of L. Gordon Cooper, left, Edgar D. Mitchell, and Donn F. Eisele prepare for the water egress test aboard the MV Retriever in the Gulf of Mexico. Right: Mitchell, left, Eisele, and Cooper in the life raft await pickup by a helicopter during the water egress test.

Apollo 10 backup crew members Cooper, Eisele, and Mitchell completed water egress training in the Gulf of Mexico on April 4. Using a boilerplate Apollo CM and tended by the Motorized Vessel (MV) Retriever, the astronauts practiced emerging from the capsule as if after splashdown, and with assistance from divers waited in a life raft for helicopter crews to retrieve them from the water.

Apollo 11
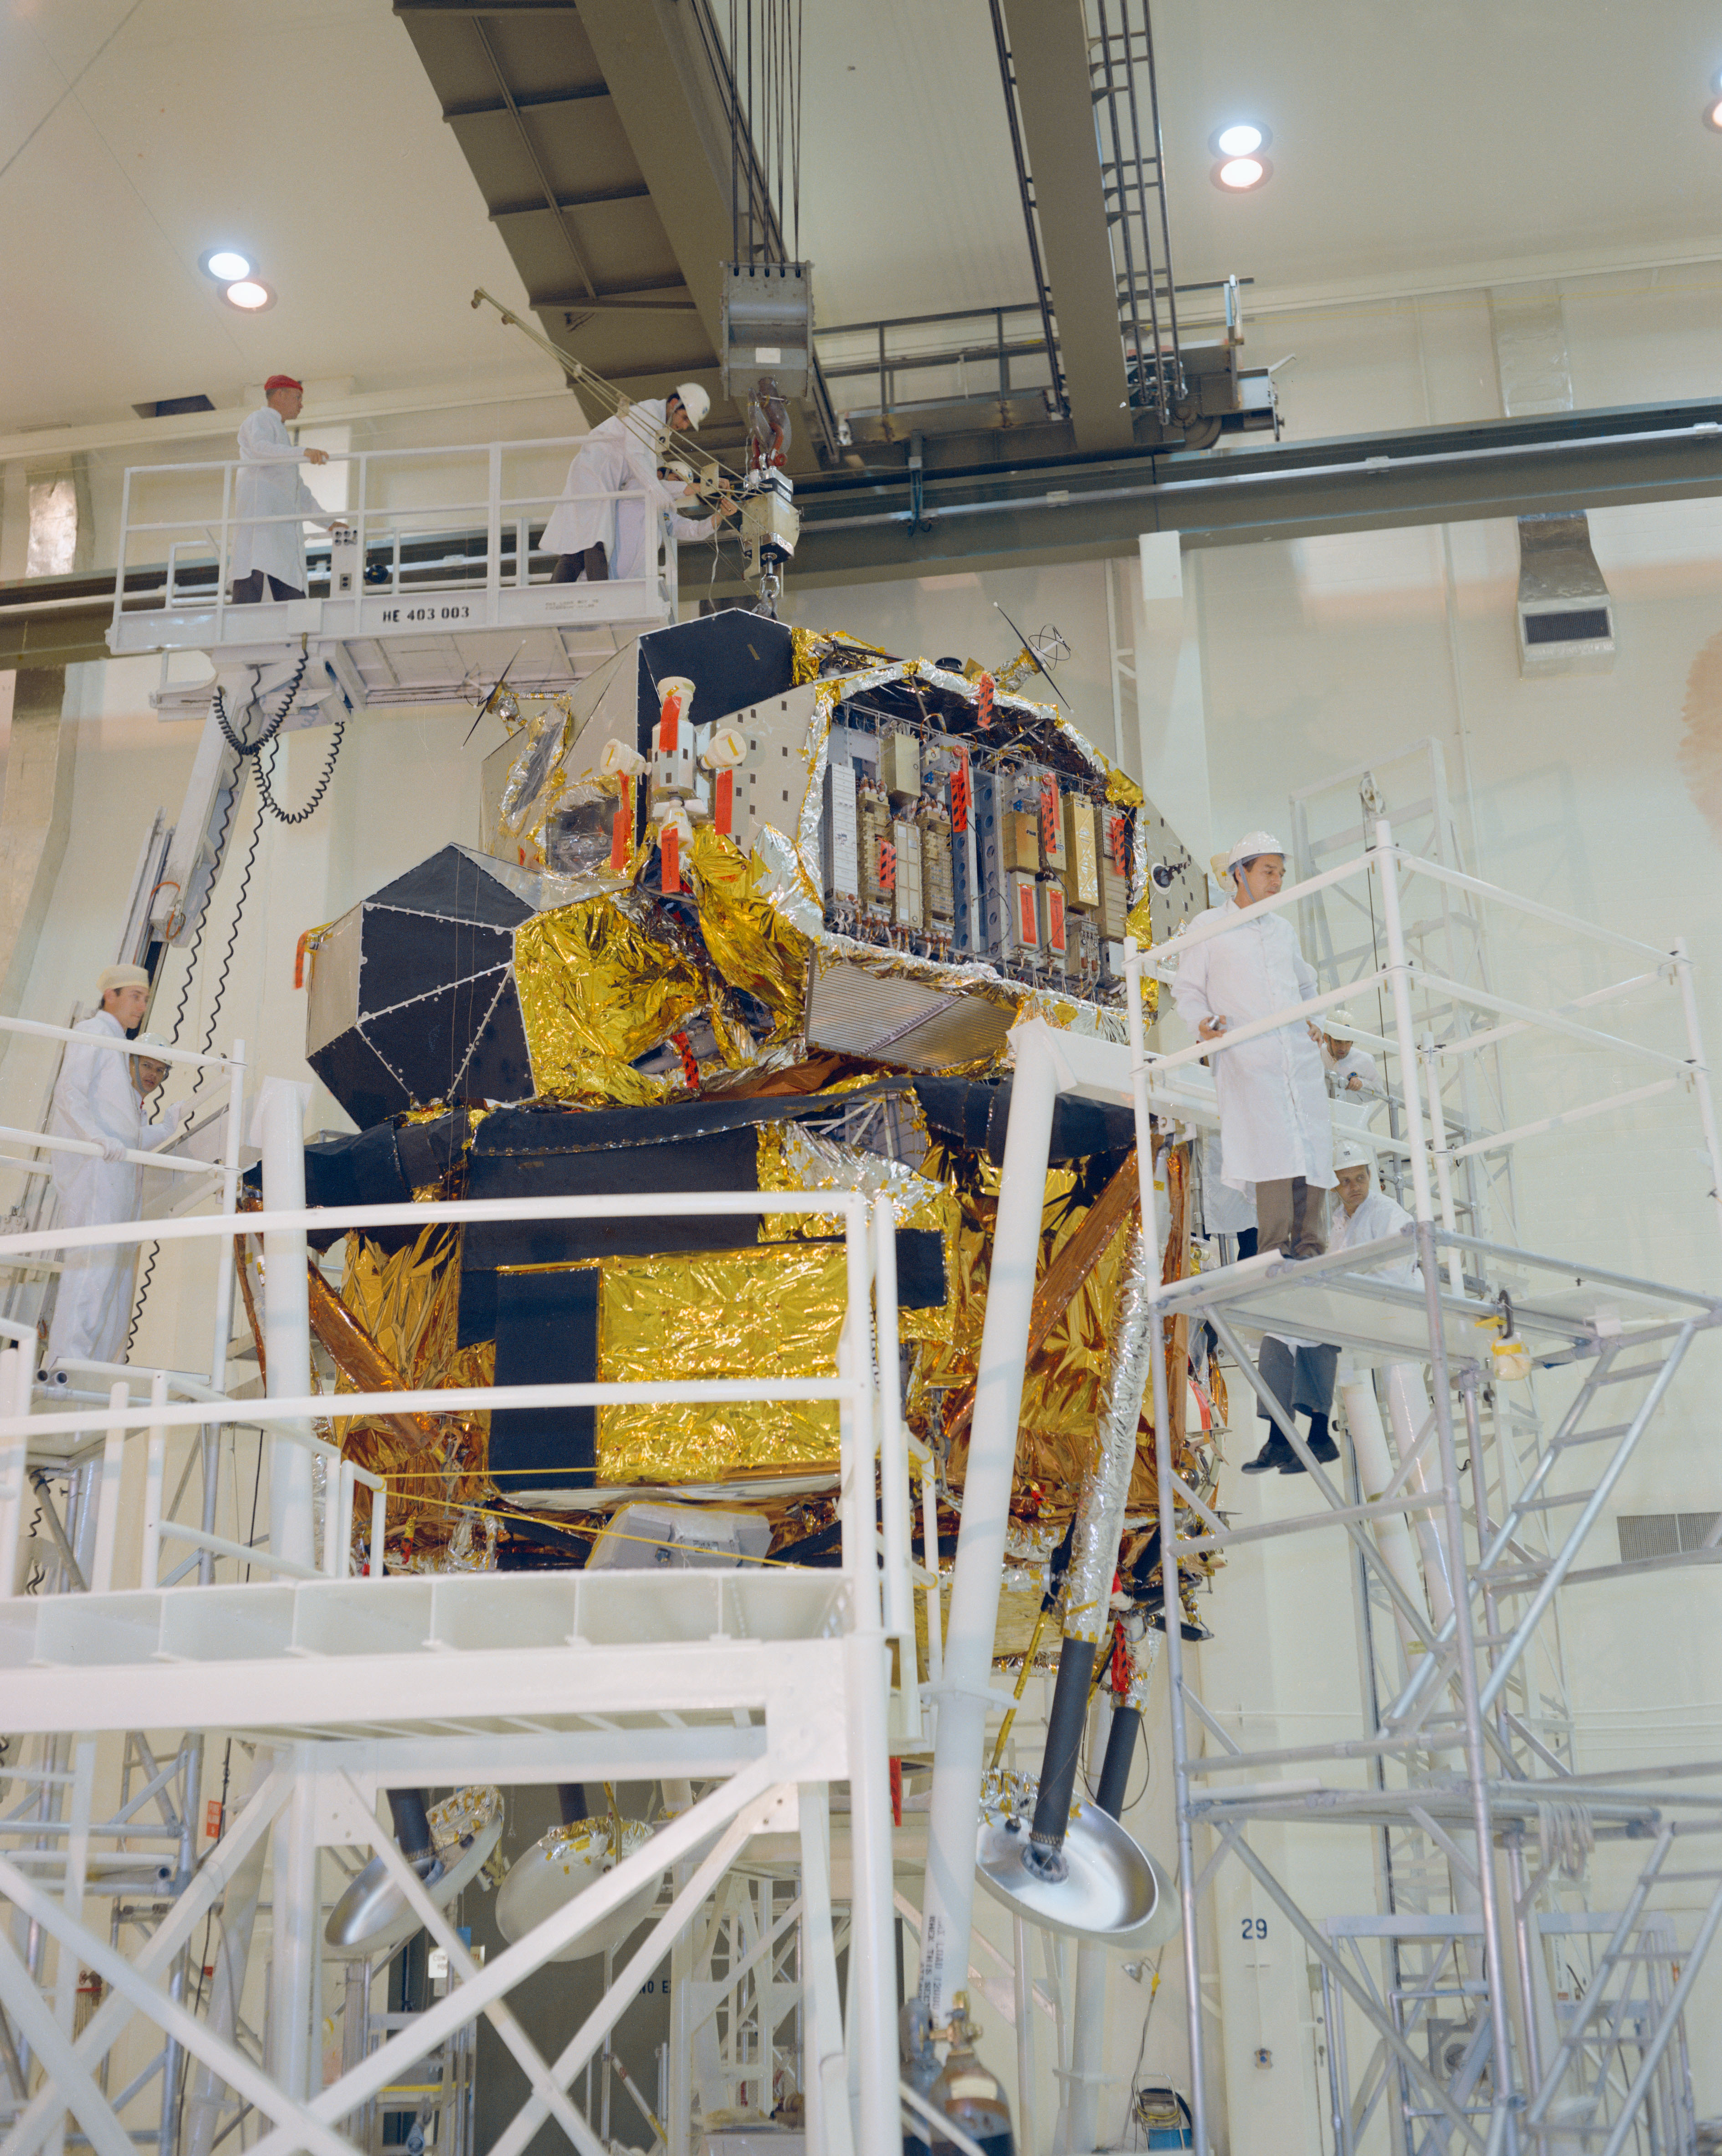
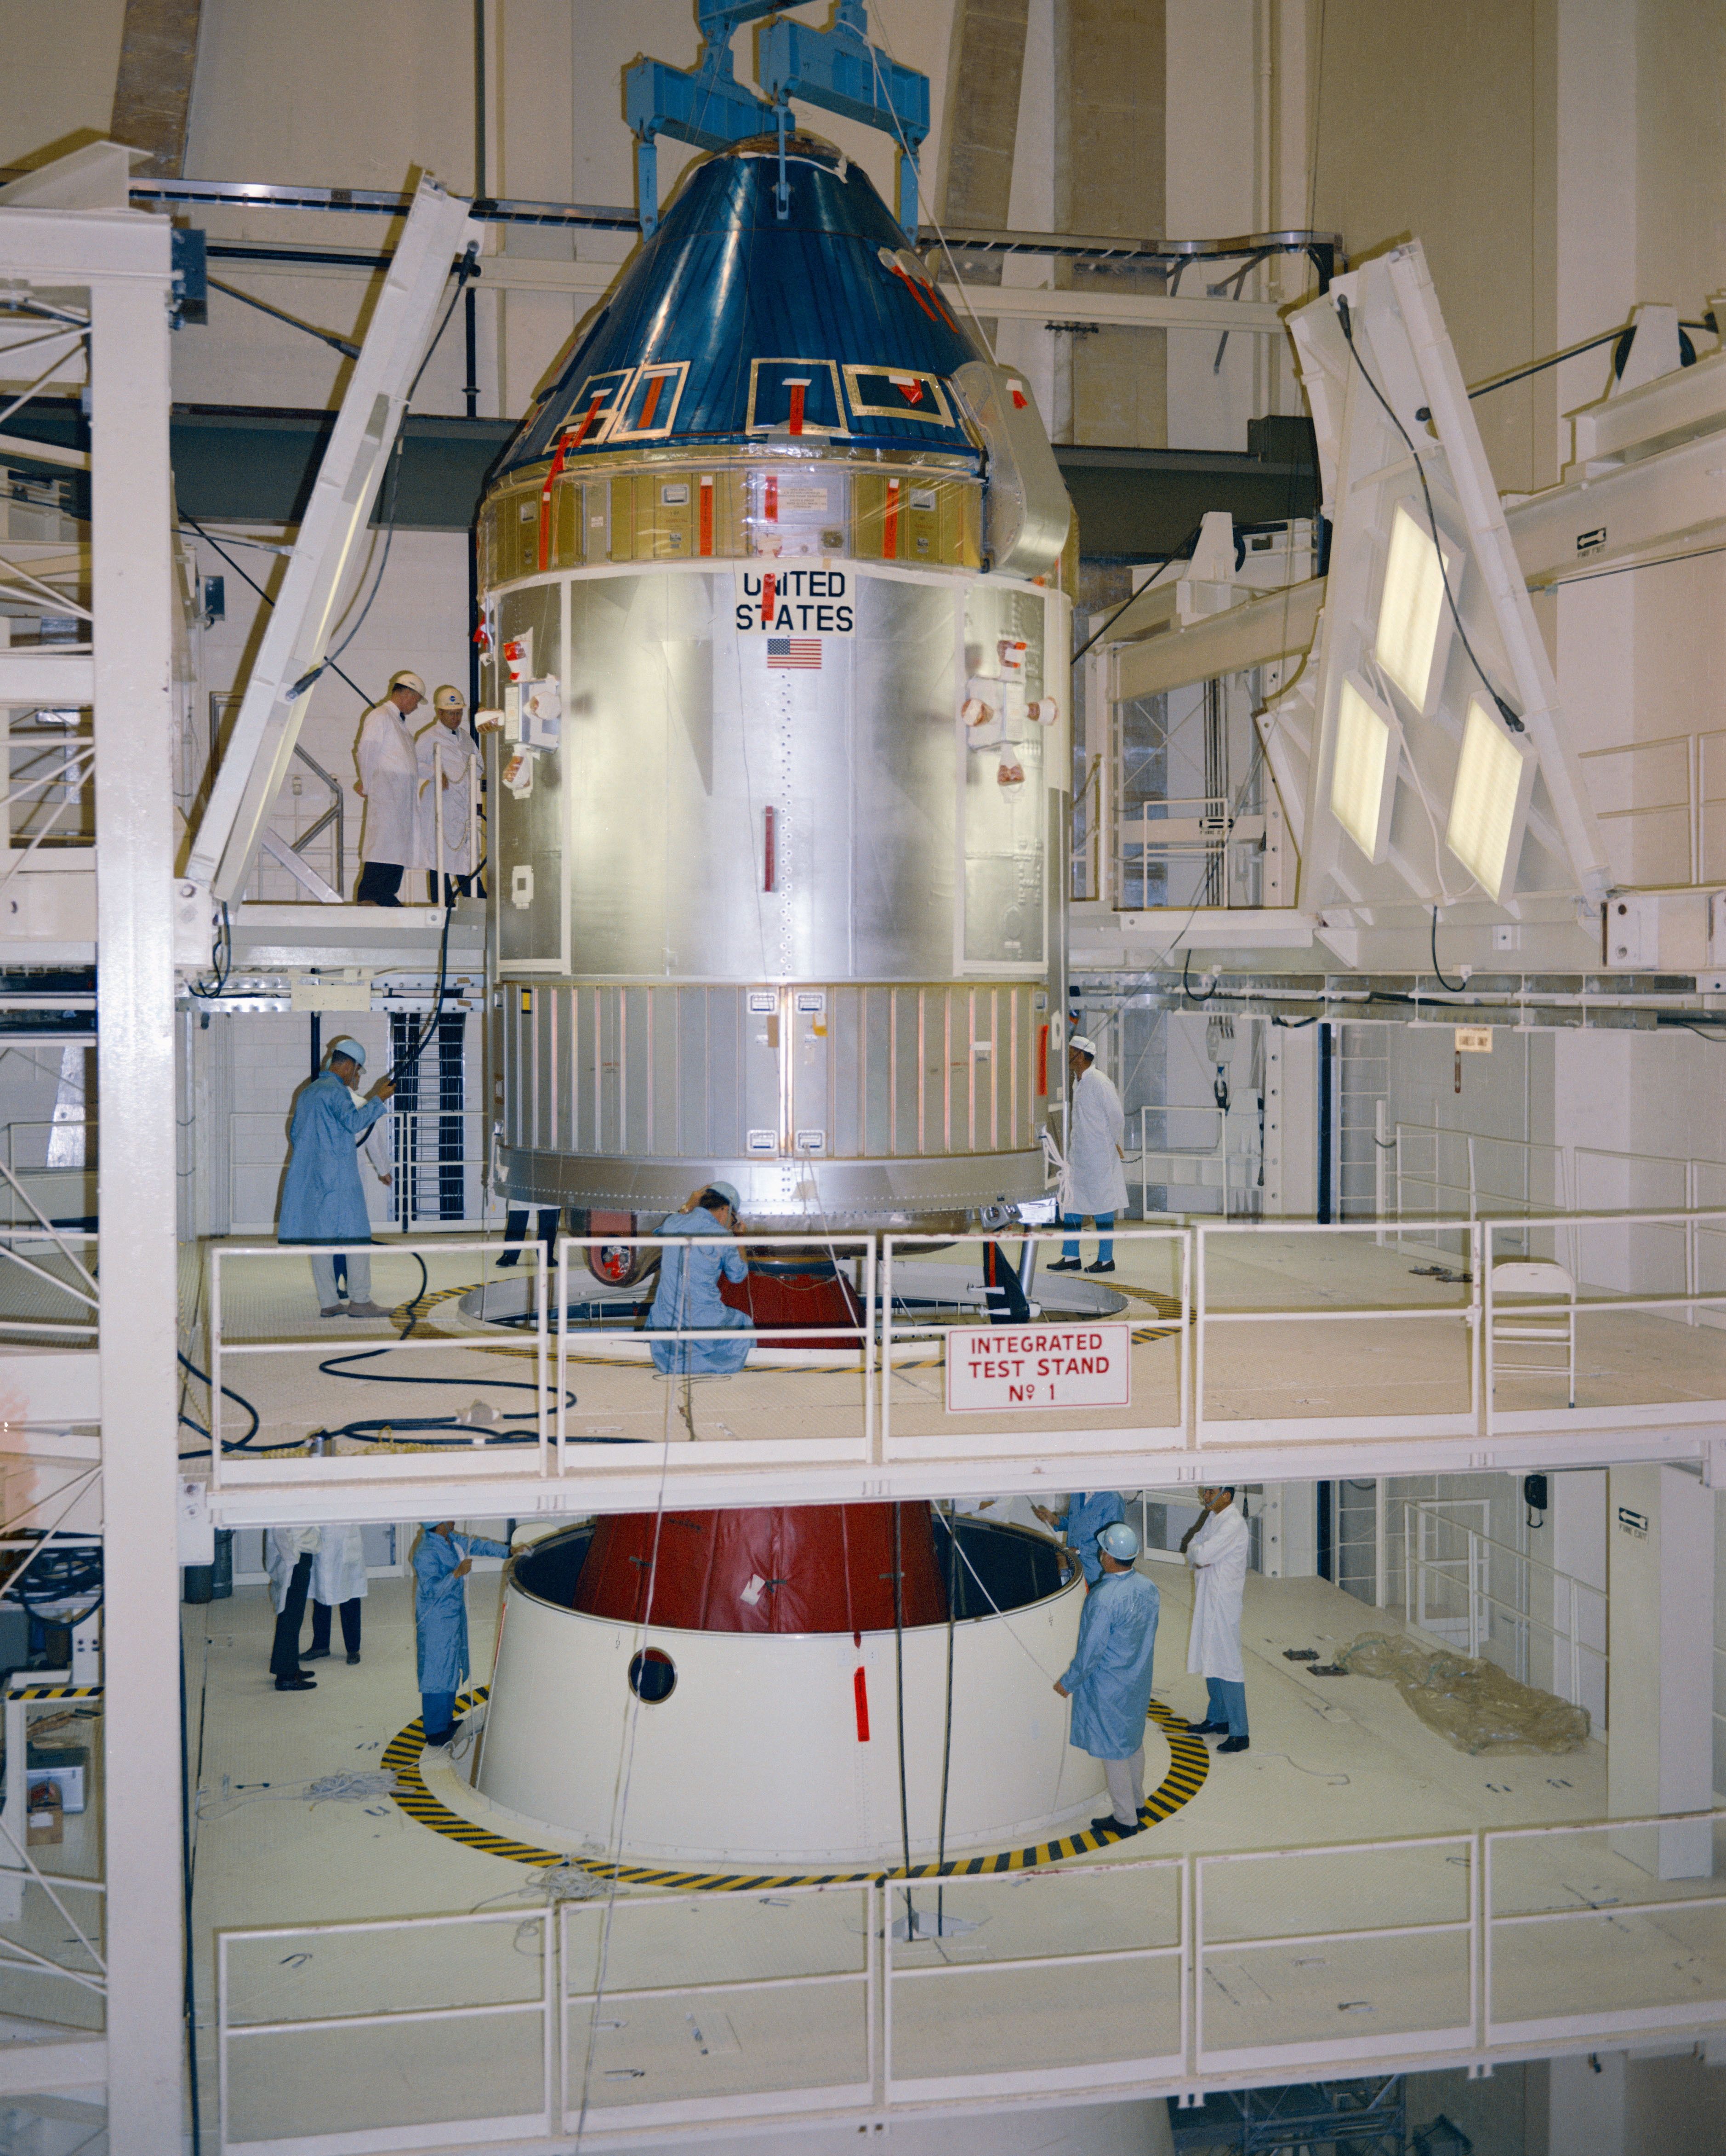
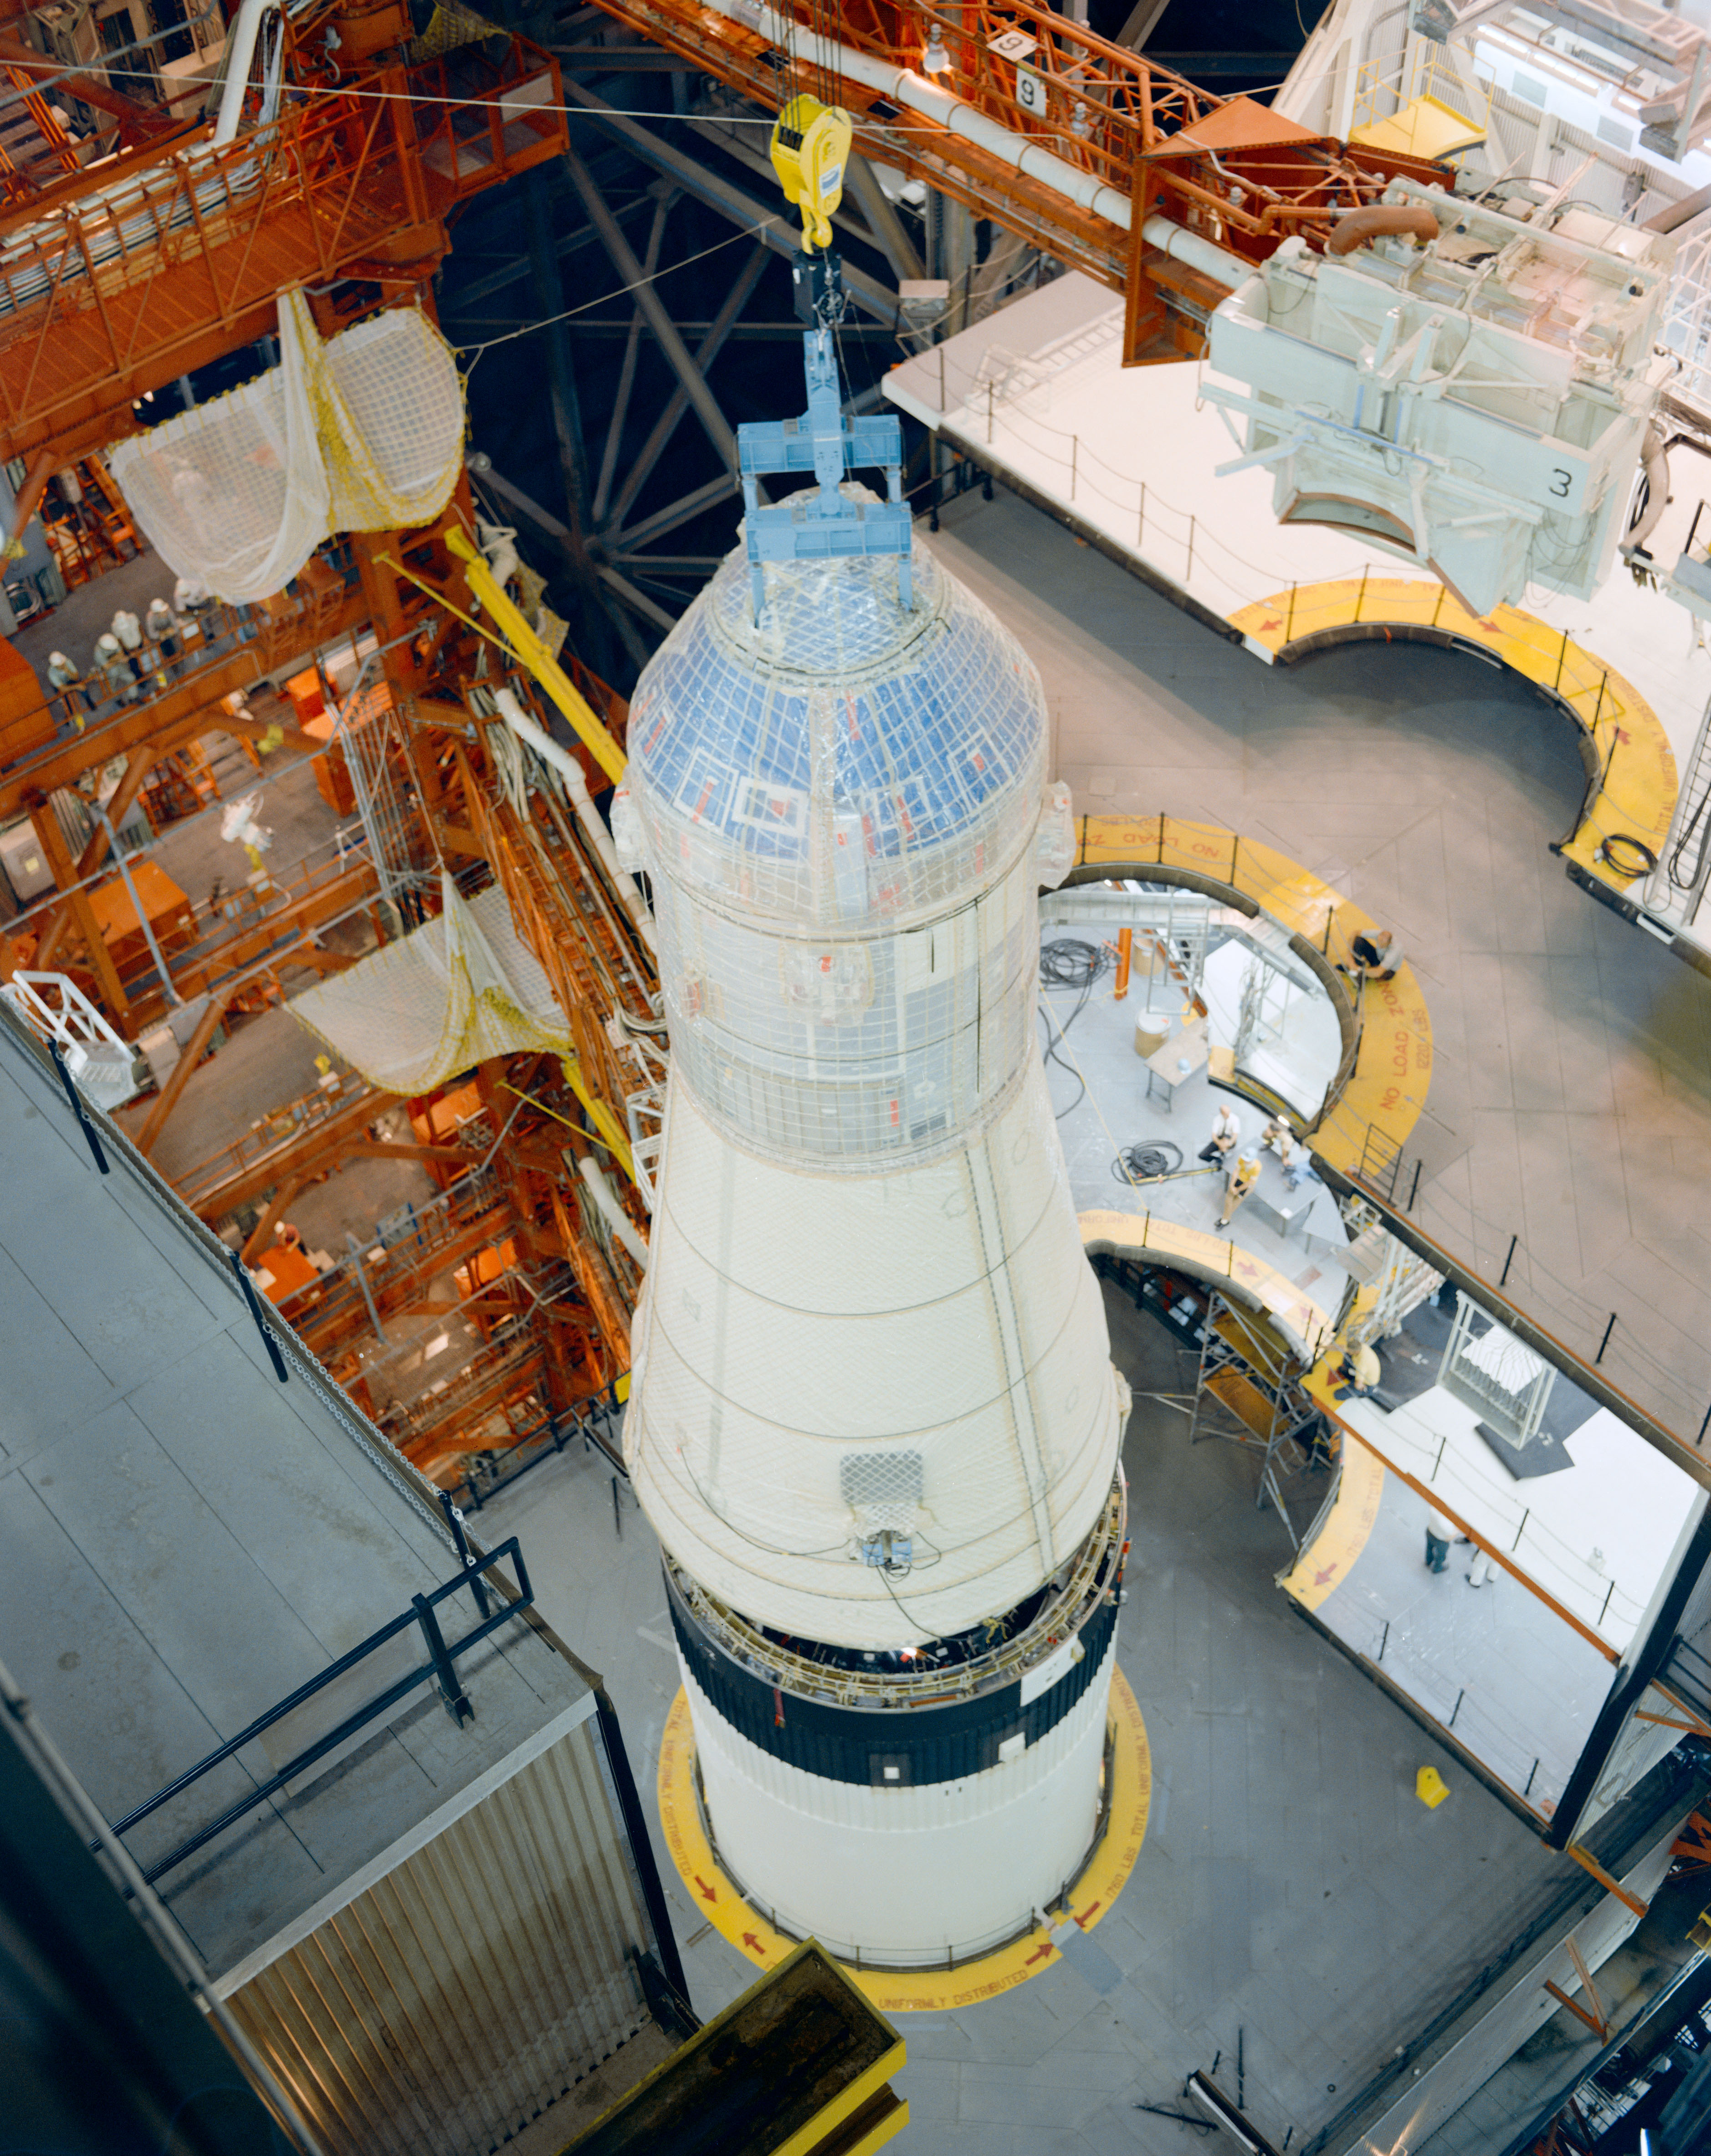
In the Manned Spacecraft Operations Building (MSOB) at NASA’s Kennedy Space Center (KSC) in Florida, workers complete attaching the landing legs to the Apollo 11 Lunar Module (LM) In the MSOB, workers lower the Command Service Module onto the Spacecraft LM Adaptor In KSC’s Vehicle Assembly Building, workers lower the Apollo 11 spacecraft onto its Saturn V rocket
Left: In the Manned Spacecraft Operations Building (MSOB) at NASA’s Kennedy Space Center (KSC) in Florida, workers complete attaching the landing legs to the Apollo 11 Lunar Module (LM). Middle: In the MSOB, workers lower the Command Service Module onto the Spacecraft LM Adaptor. Right: In KSC’s Vehicle Assembly Building, workers lower the Apollo 11 spacecraft onto its Saturn V rocket.

As launch day neared for Apollo 10, work progressed to get Apollo 11 ready for its historic mission. In KSC’s Manned Spacecraft Operations Building (MSOB), workers attached the four landing legs to the Apollo 11 LM, mated it with its Spacecraft LM Adapter (SLA) on April 4, and three days later completed assembly of the spacecraft by adding the CSM. On April 14, they transported the spacecraft to the Vehicle Assembly Building (VAB), where engineers stacked it atop its Saturn V rocket. They performed tests on the vehicle prior to its rollout to the launch pad in mid-May.
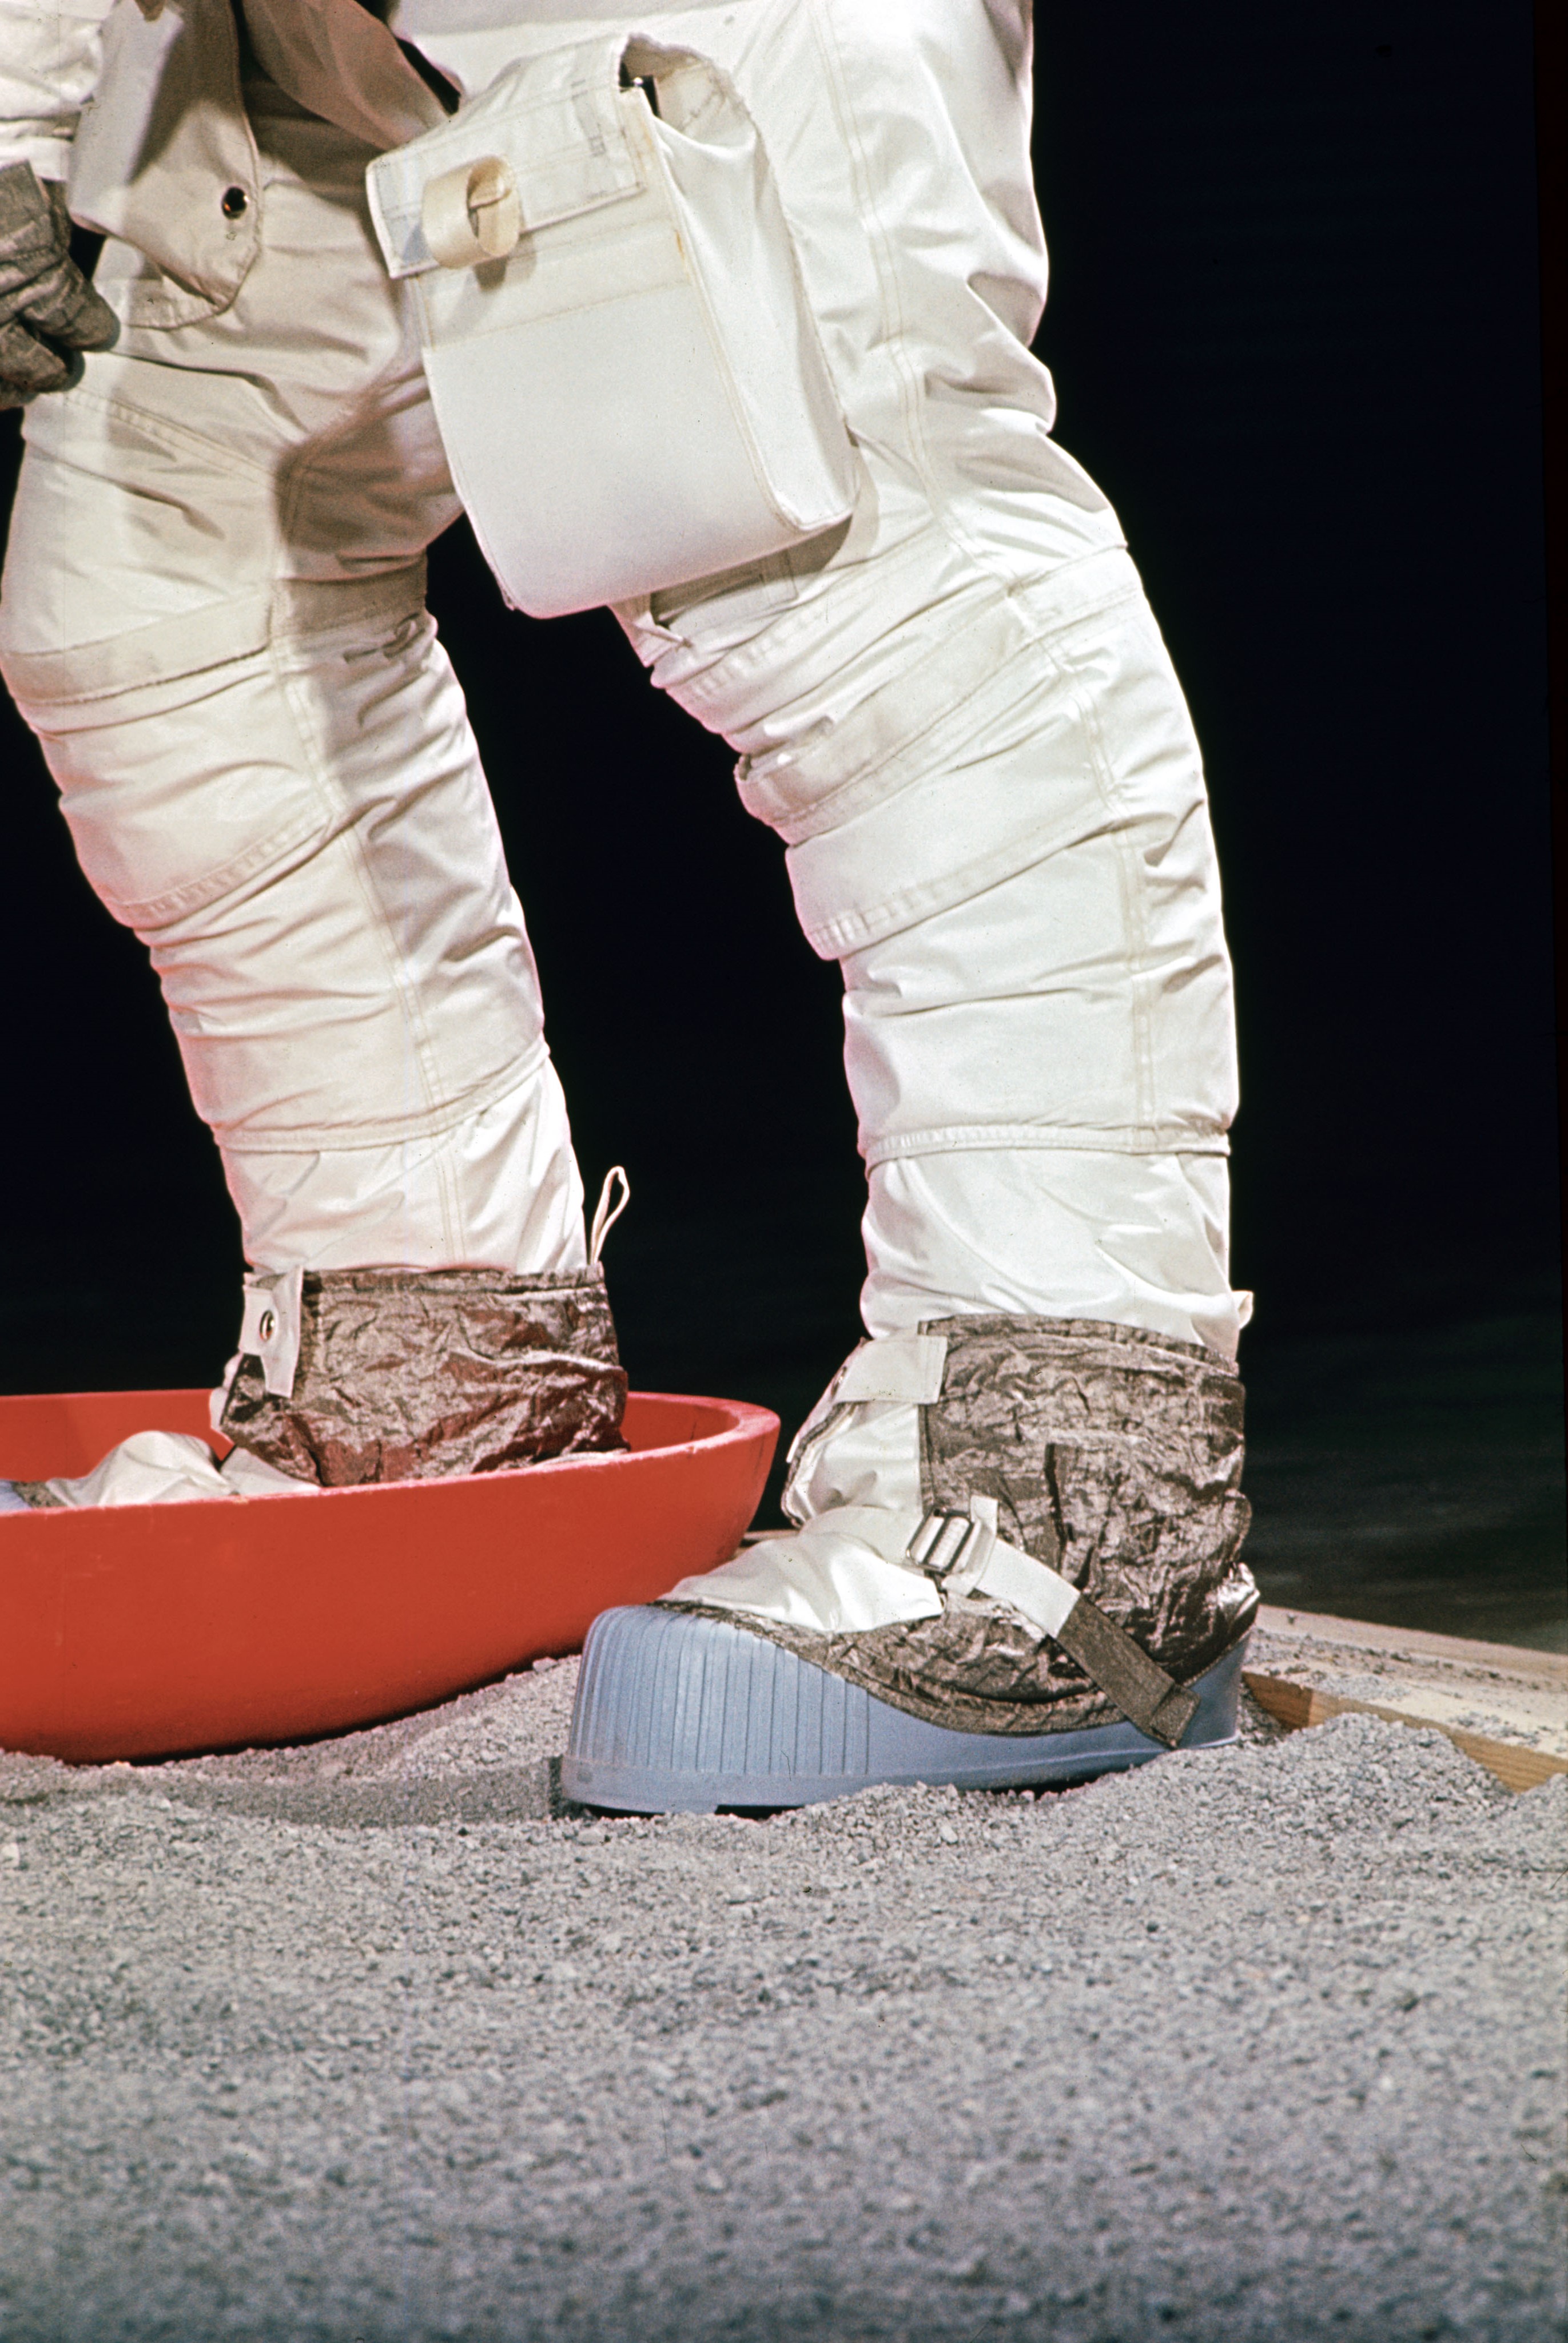
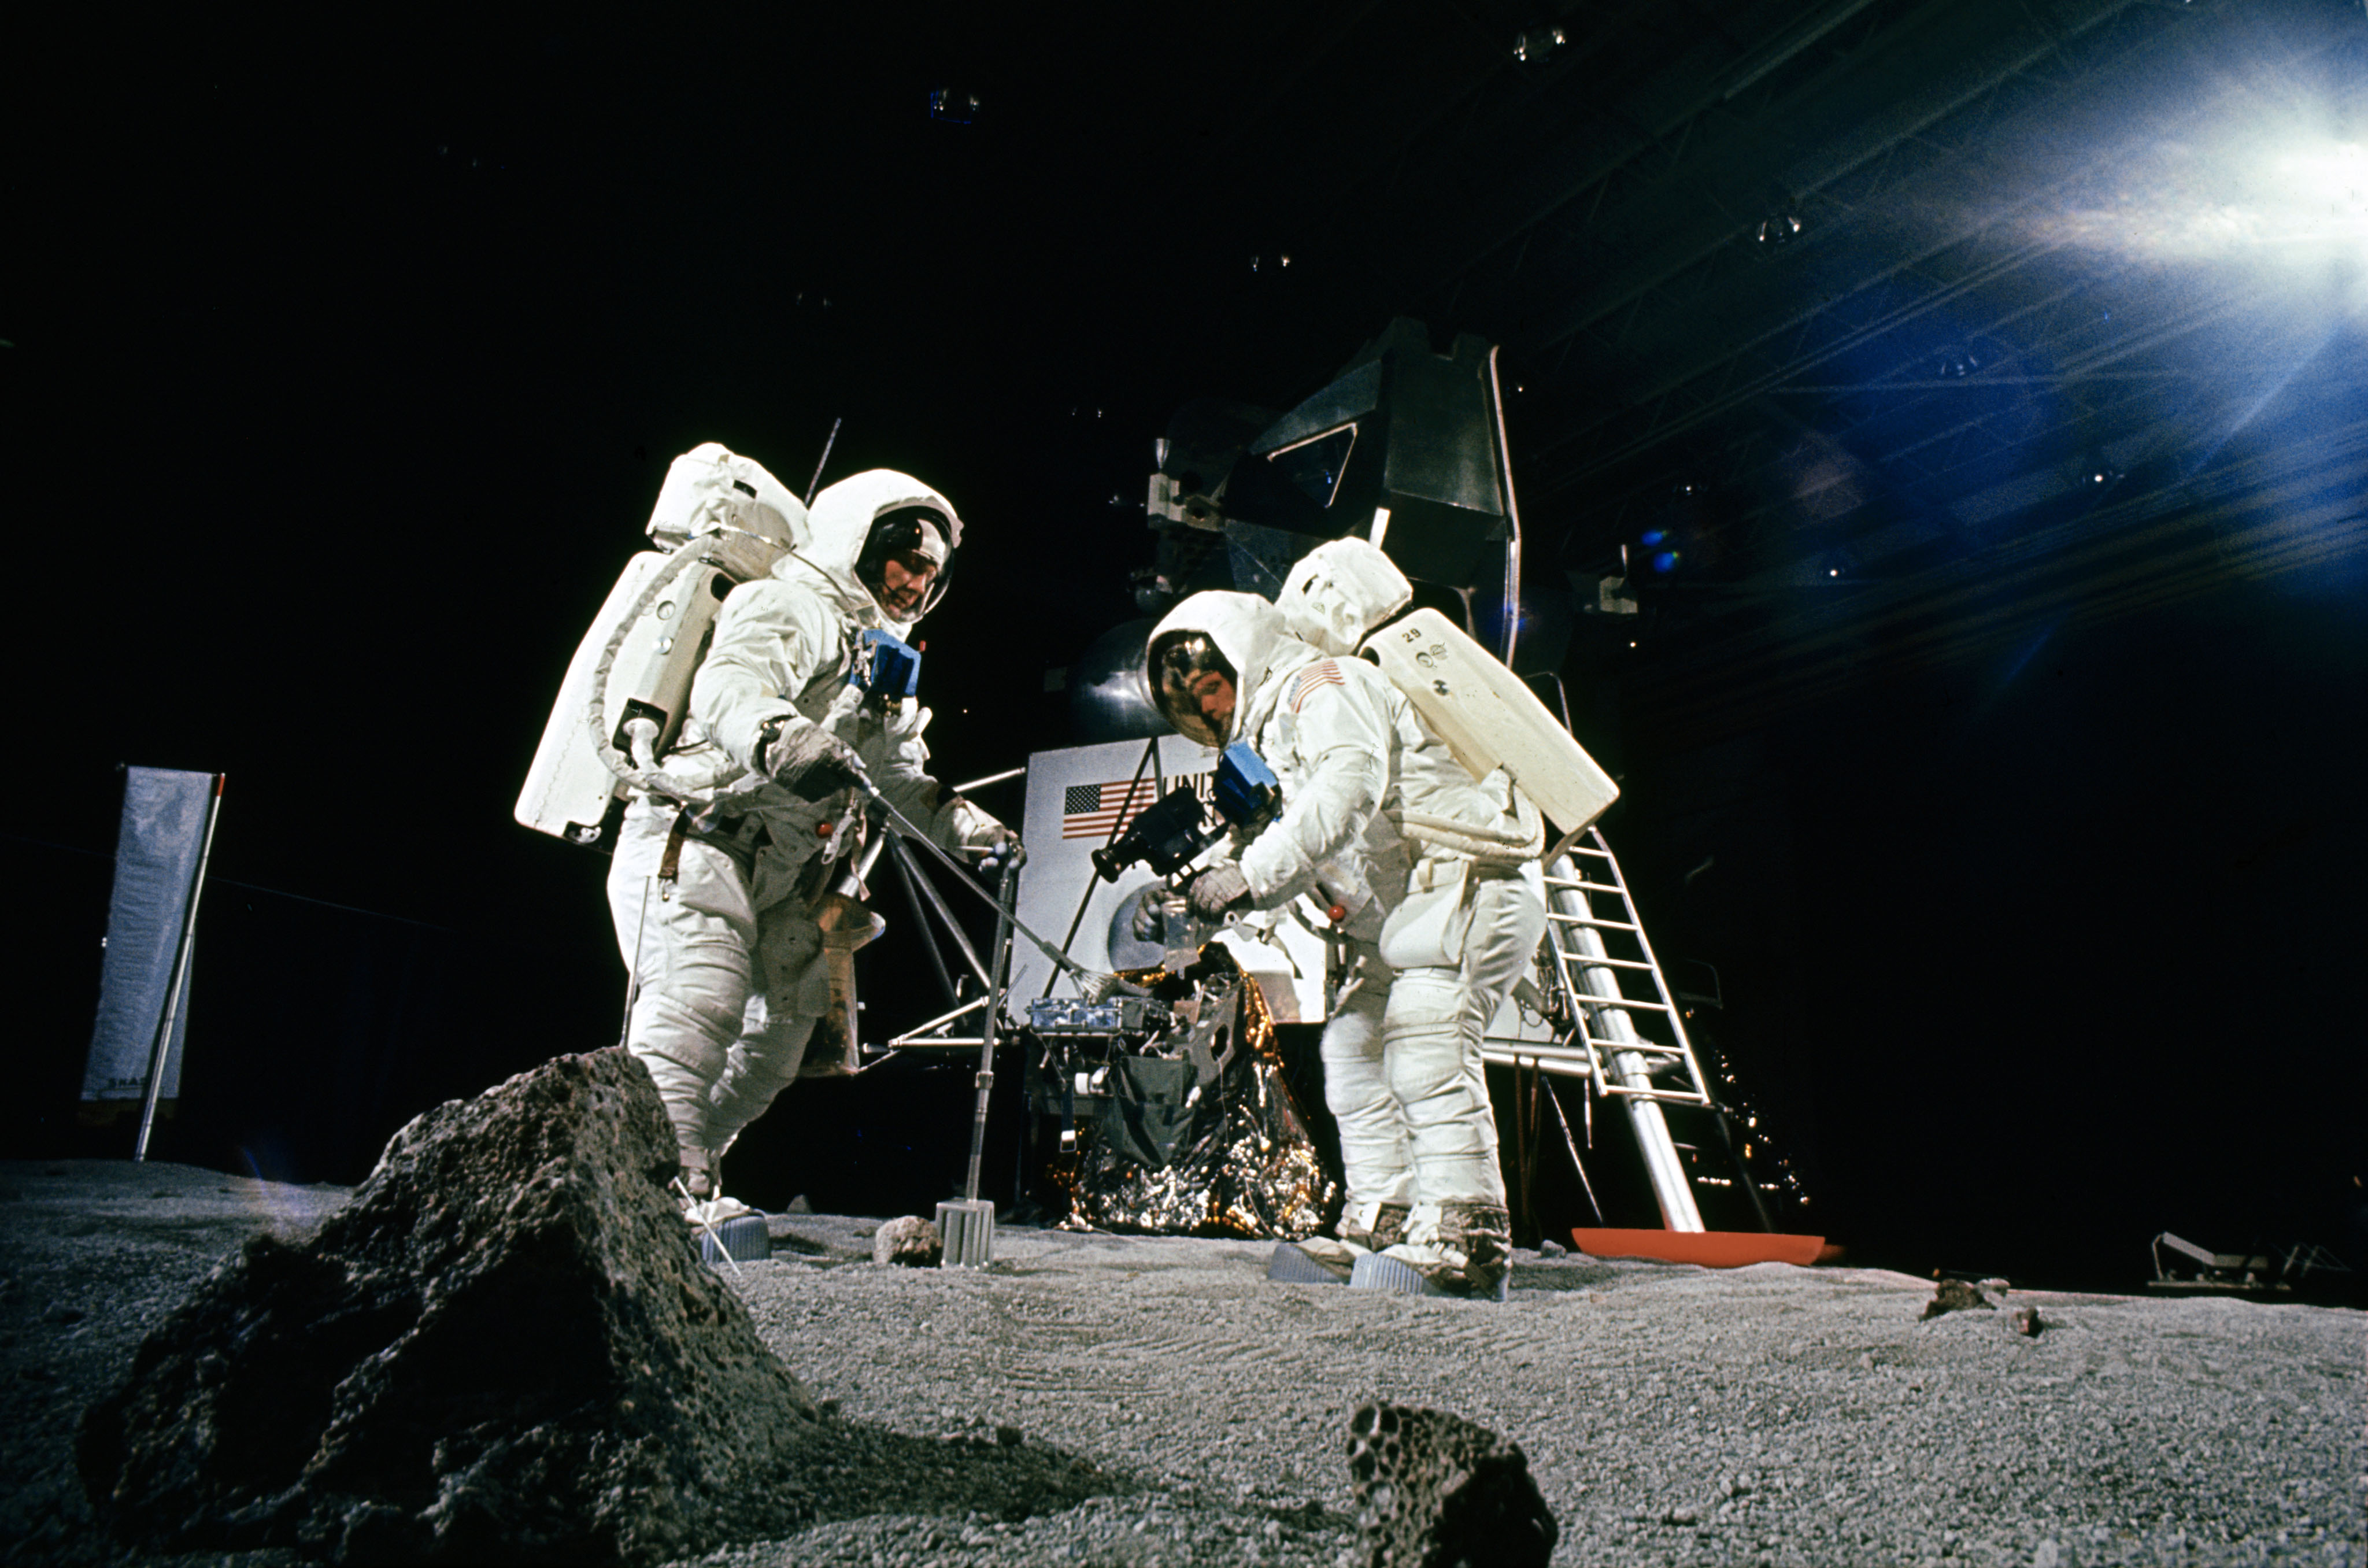
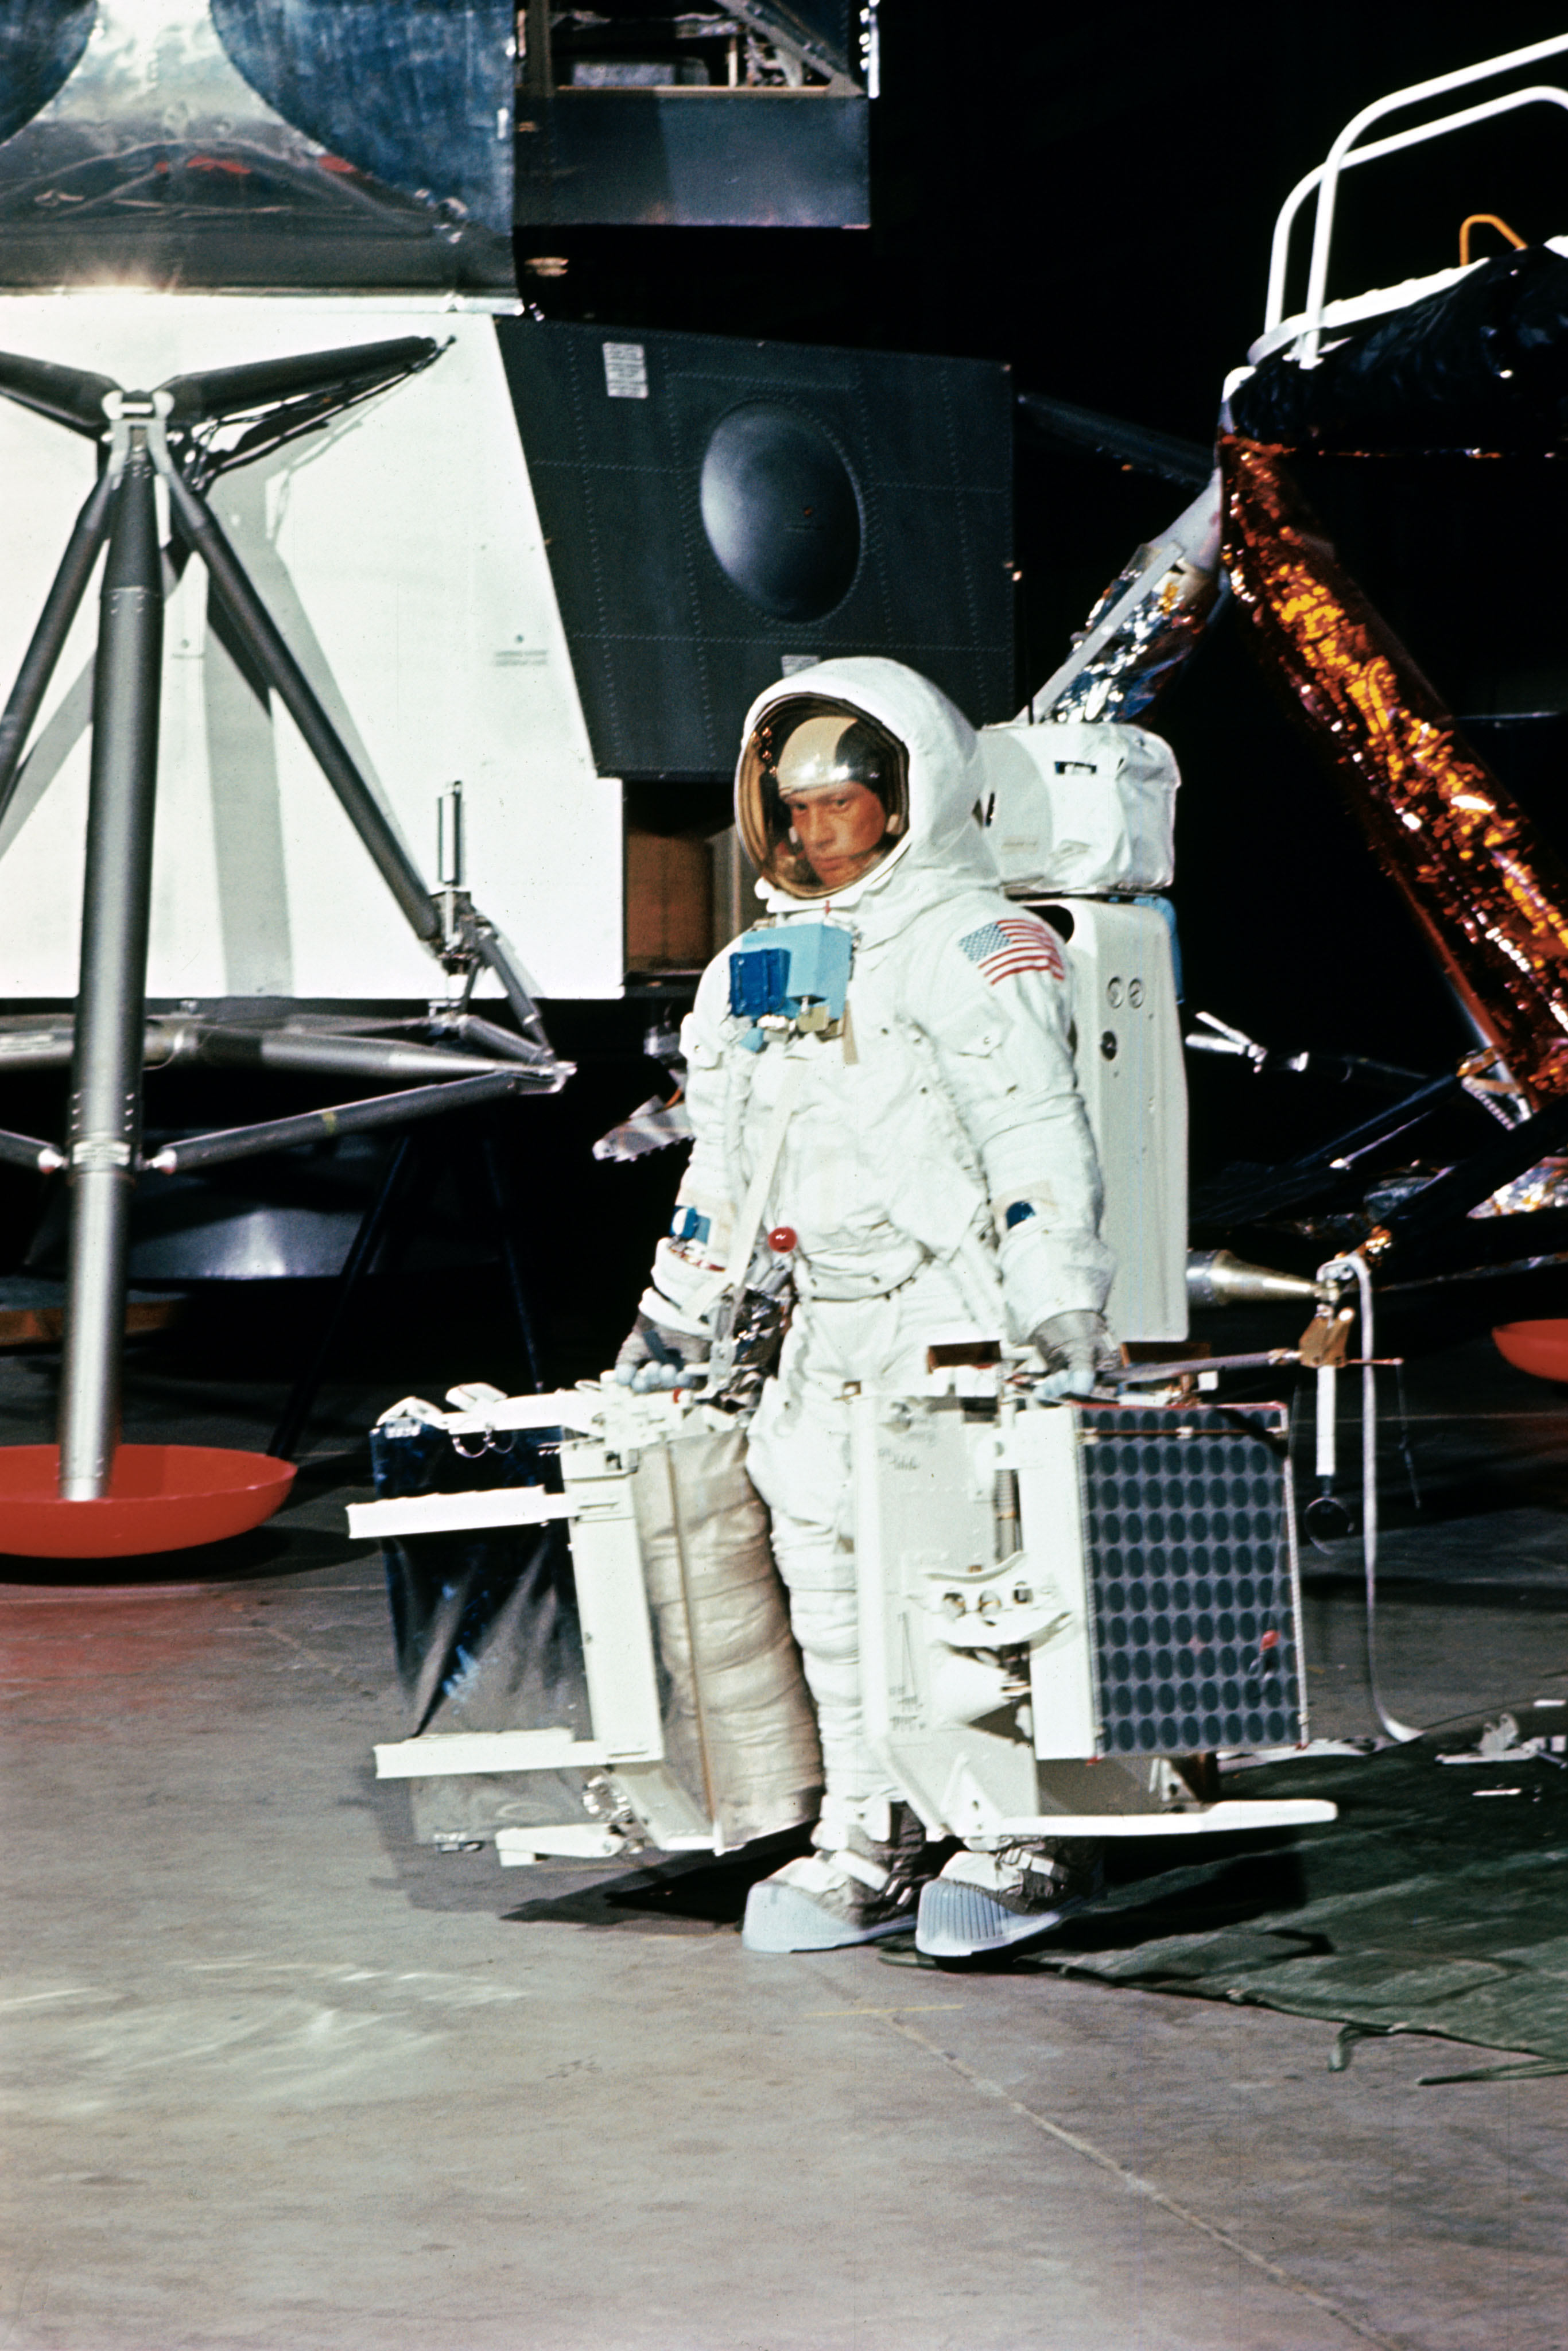
Apollo 11 astronaut Neil A. Armstrong practices taking the first step onto the lunar surface Edwin E. “Buzz” Aldrin, left, and Armstrong train for lunar surface activities Aldrin trains to carry the science instruments
Left: Apollo 11 astronaut Neil A. Armstrong practices taking the first step onto the lunar surface. Middle: Edwin E. “Buzz” Aldrin, left, and Armstrong train for lunar surface activities. Right: Aldrin trains to carry the science instruments.

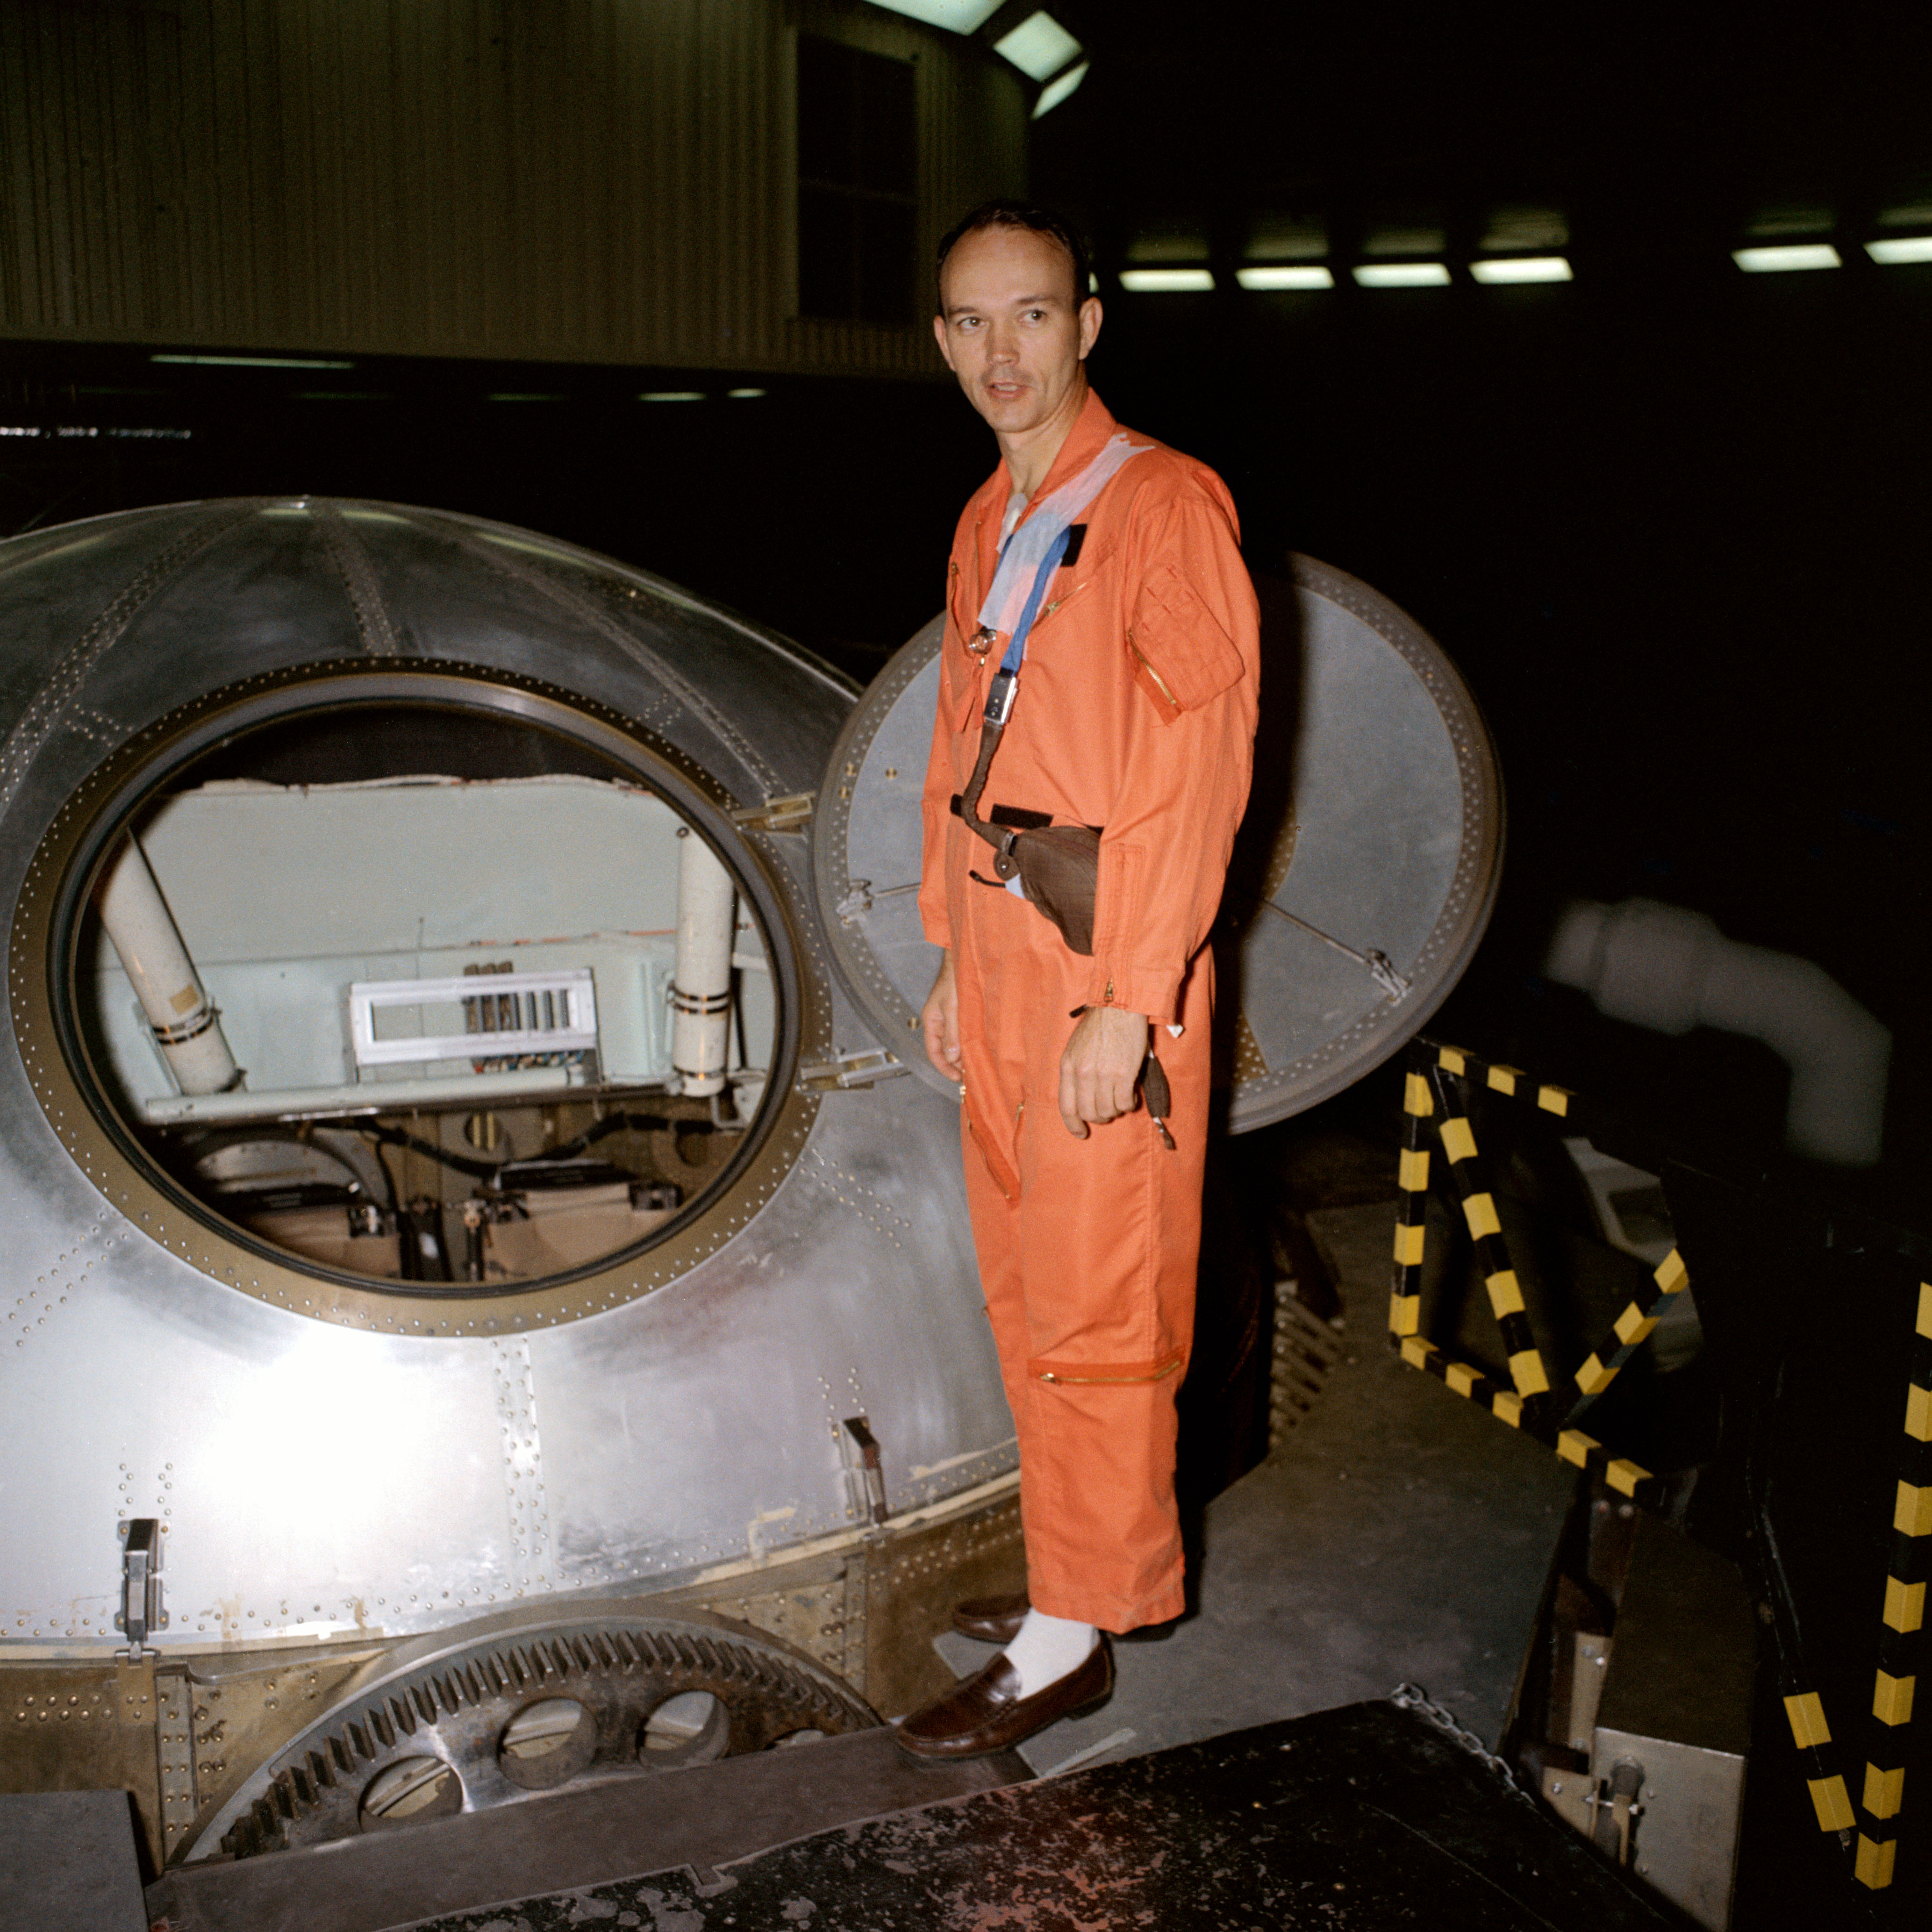
The Apollo 11 prime crew of Neil A. Armstrong, Michael Collins, and Edwin E. “Buzz” Aldrin and their backups James A. Lovell, William A. Anders, and Fred W. Haise busied themselves training for the Moon landing. On April 14, Apollo Spacecraft Program Manager Low announced in a press conference that Armstrong would most likely be the first person to exit the LM and take humanity’s first steps on the lunar surface. Aldrin would follow about 20 minutes later. The LM cabin’s configuration primarily dictated the rationale for this decision – because of the way the LM’s hatch opened inward, it would be difficult at best for Aldrin to exit first, since he would need to climb over Armstrong in the cramped quarters of the cabin, both of them wearing bulky spacesuits. 
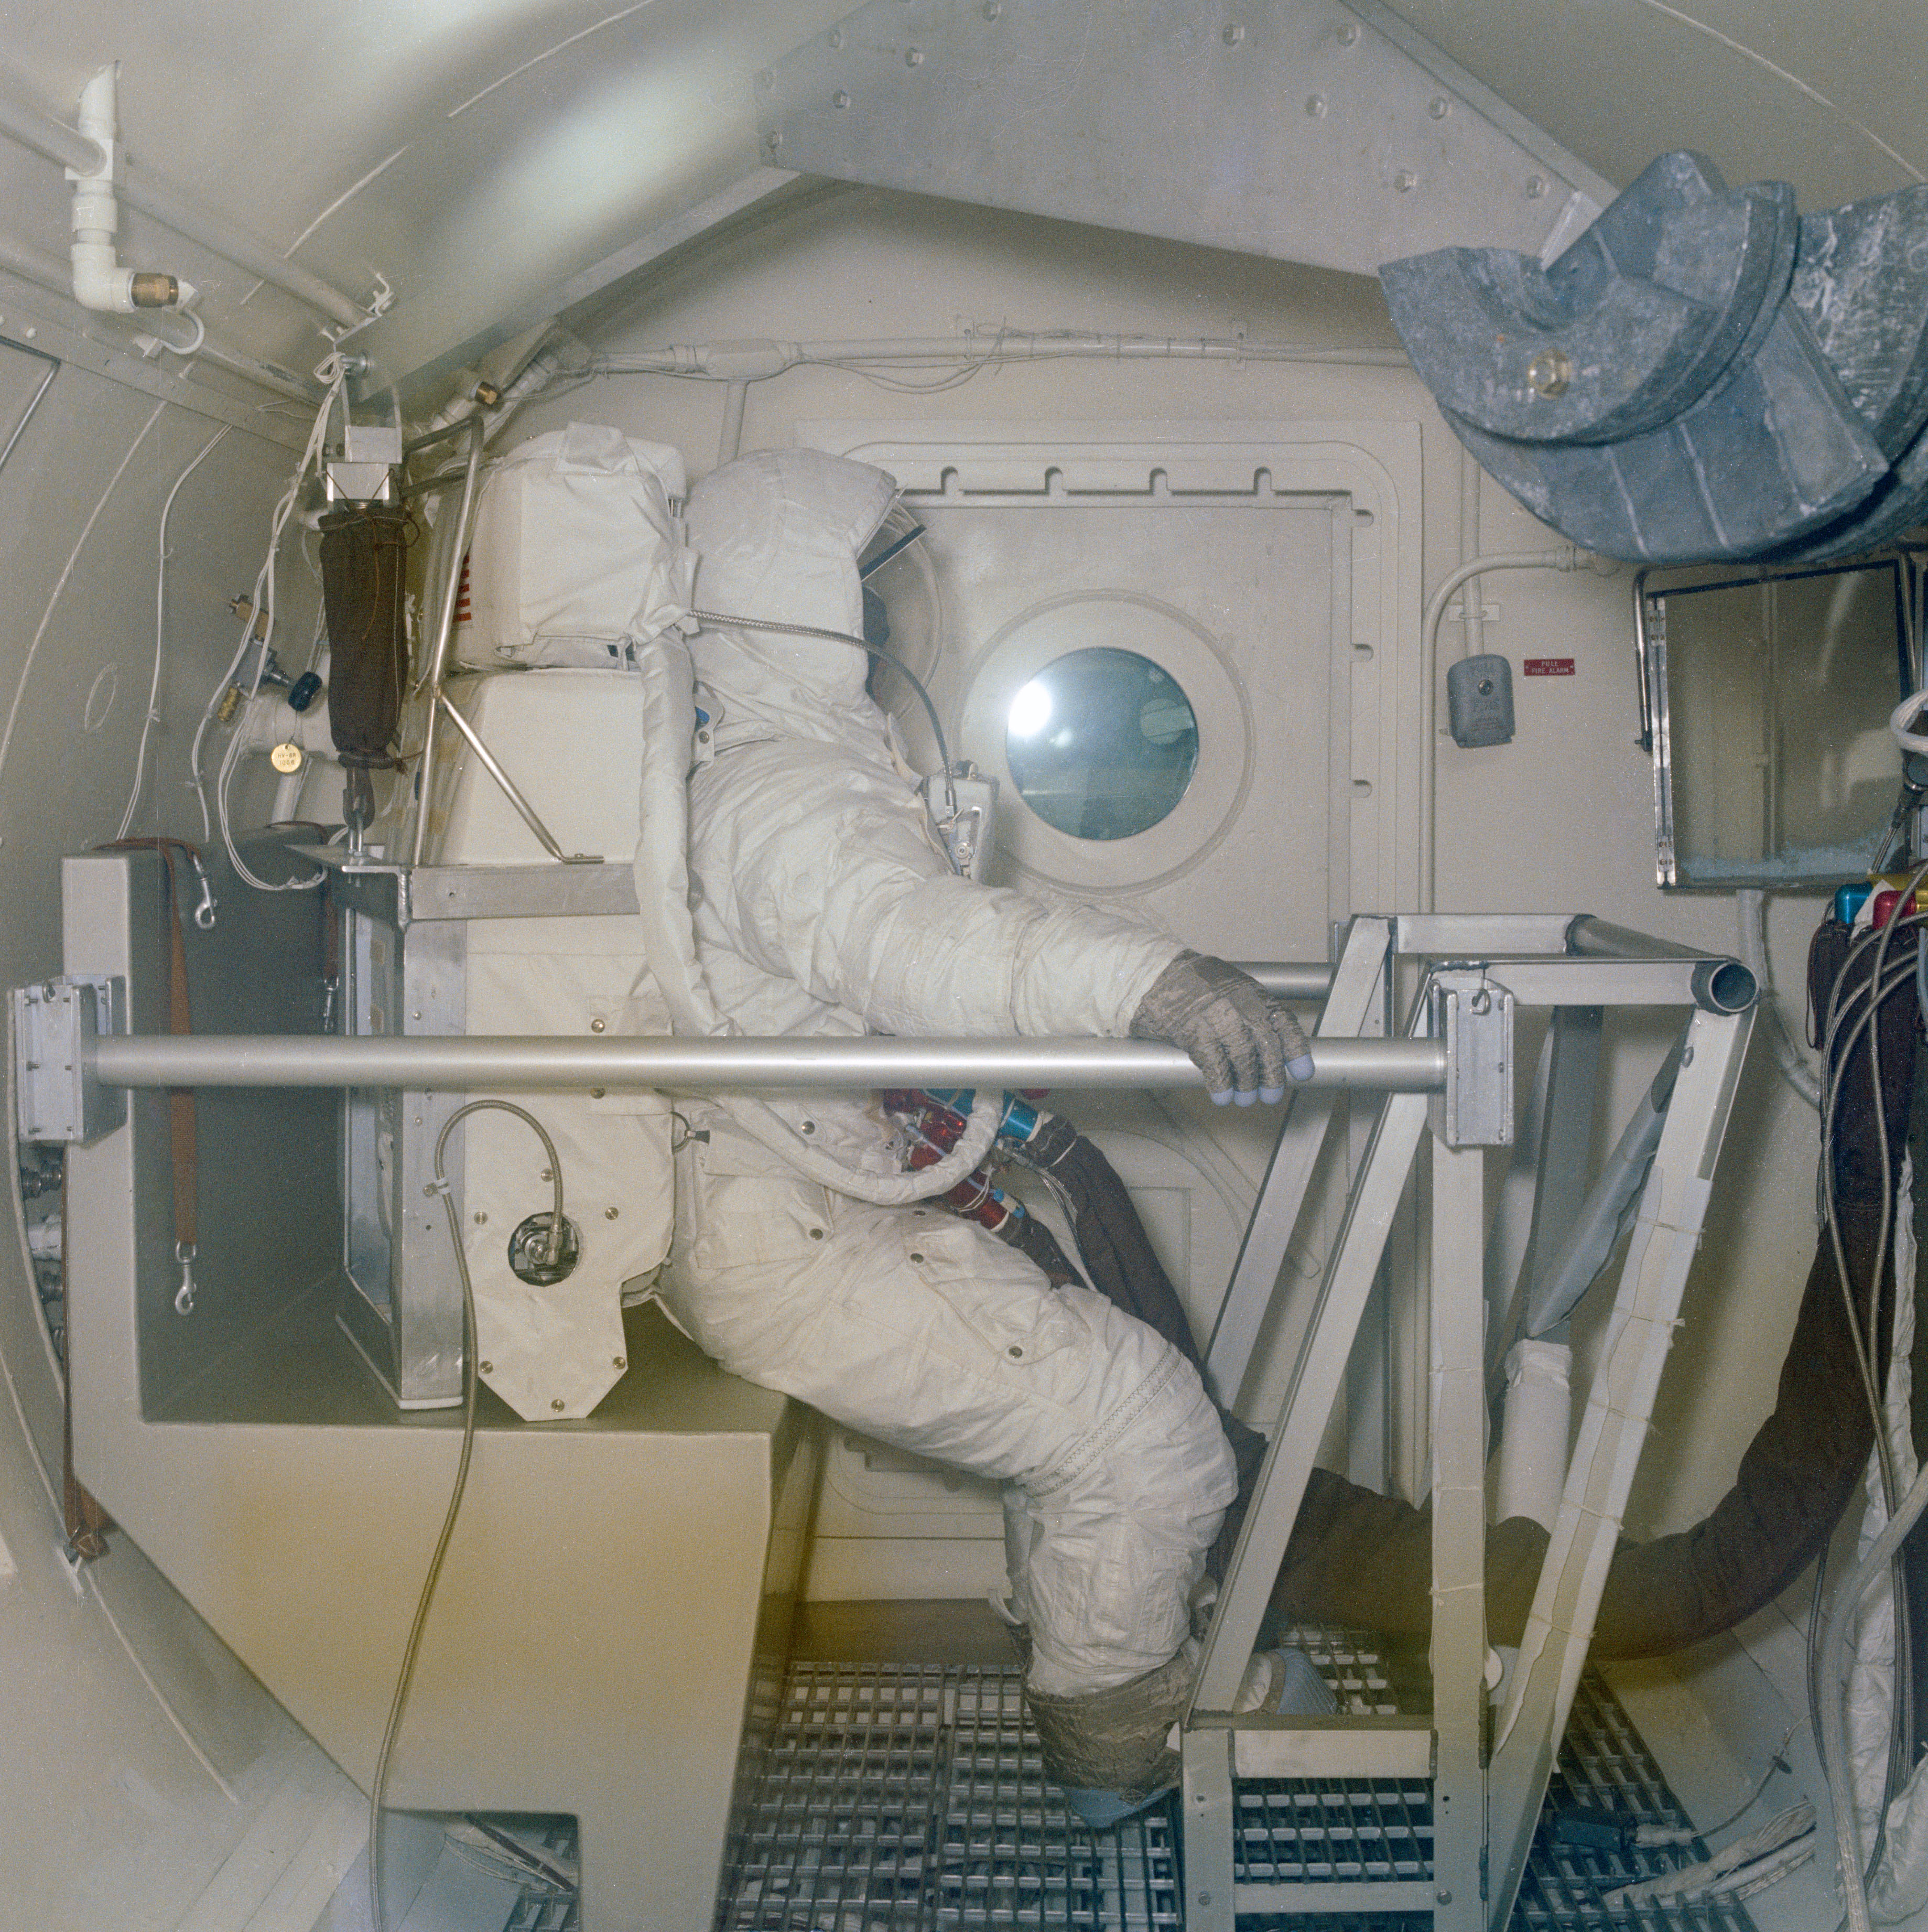
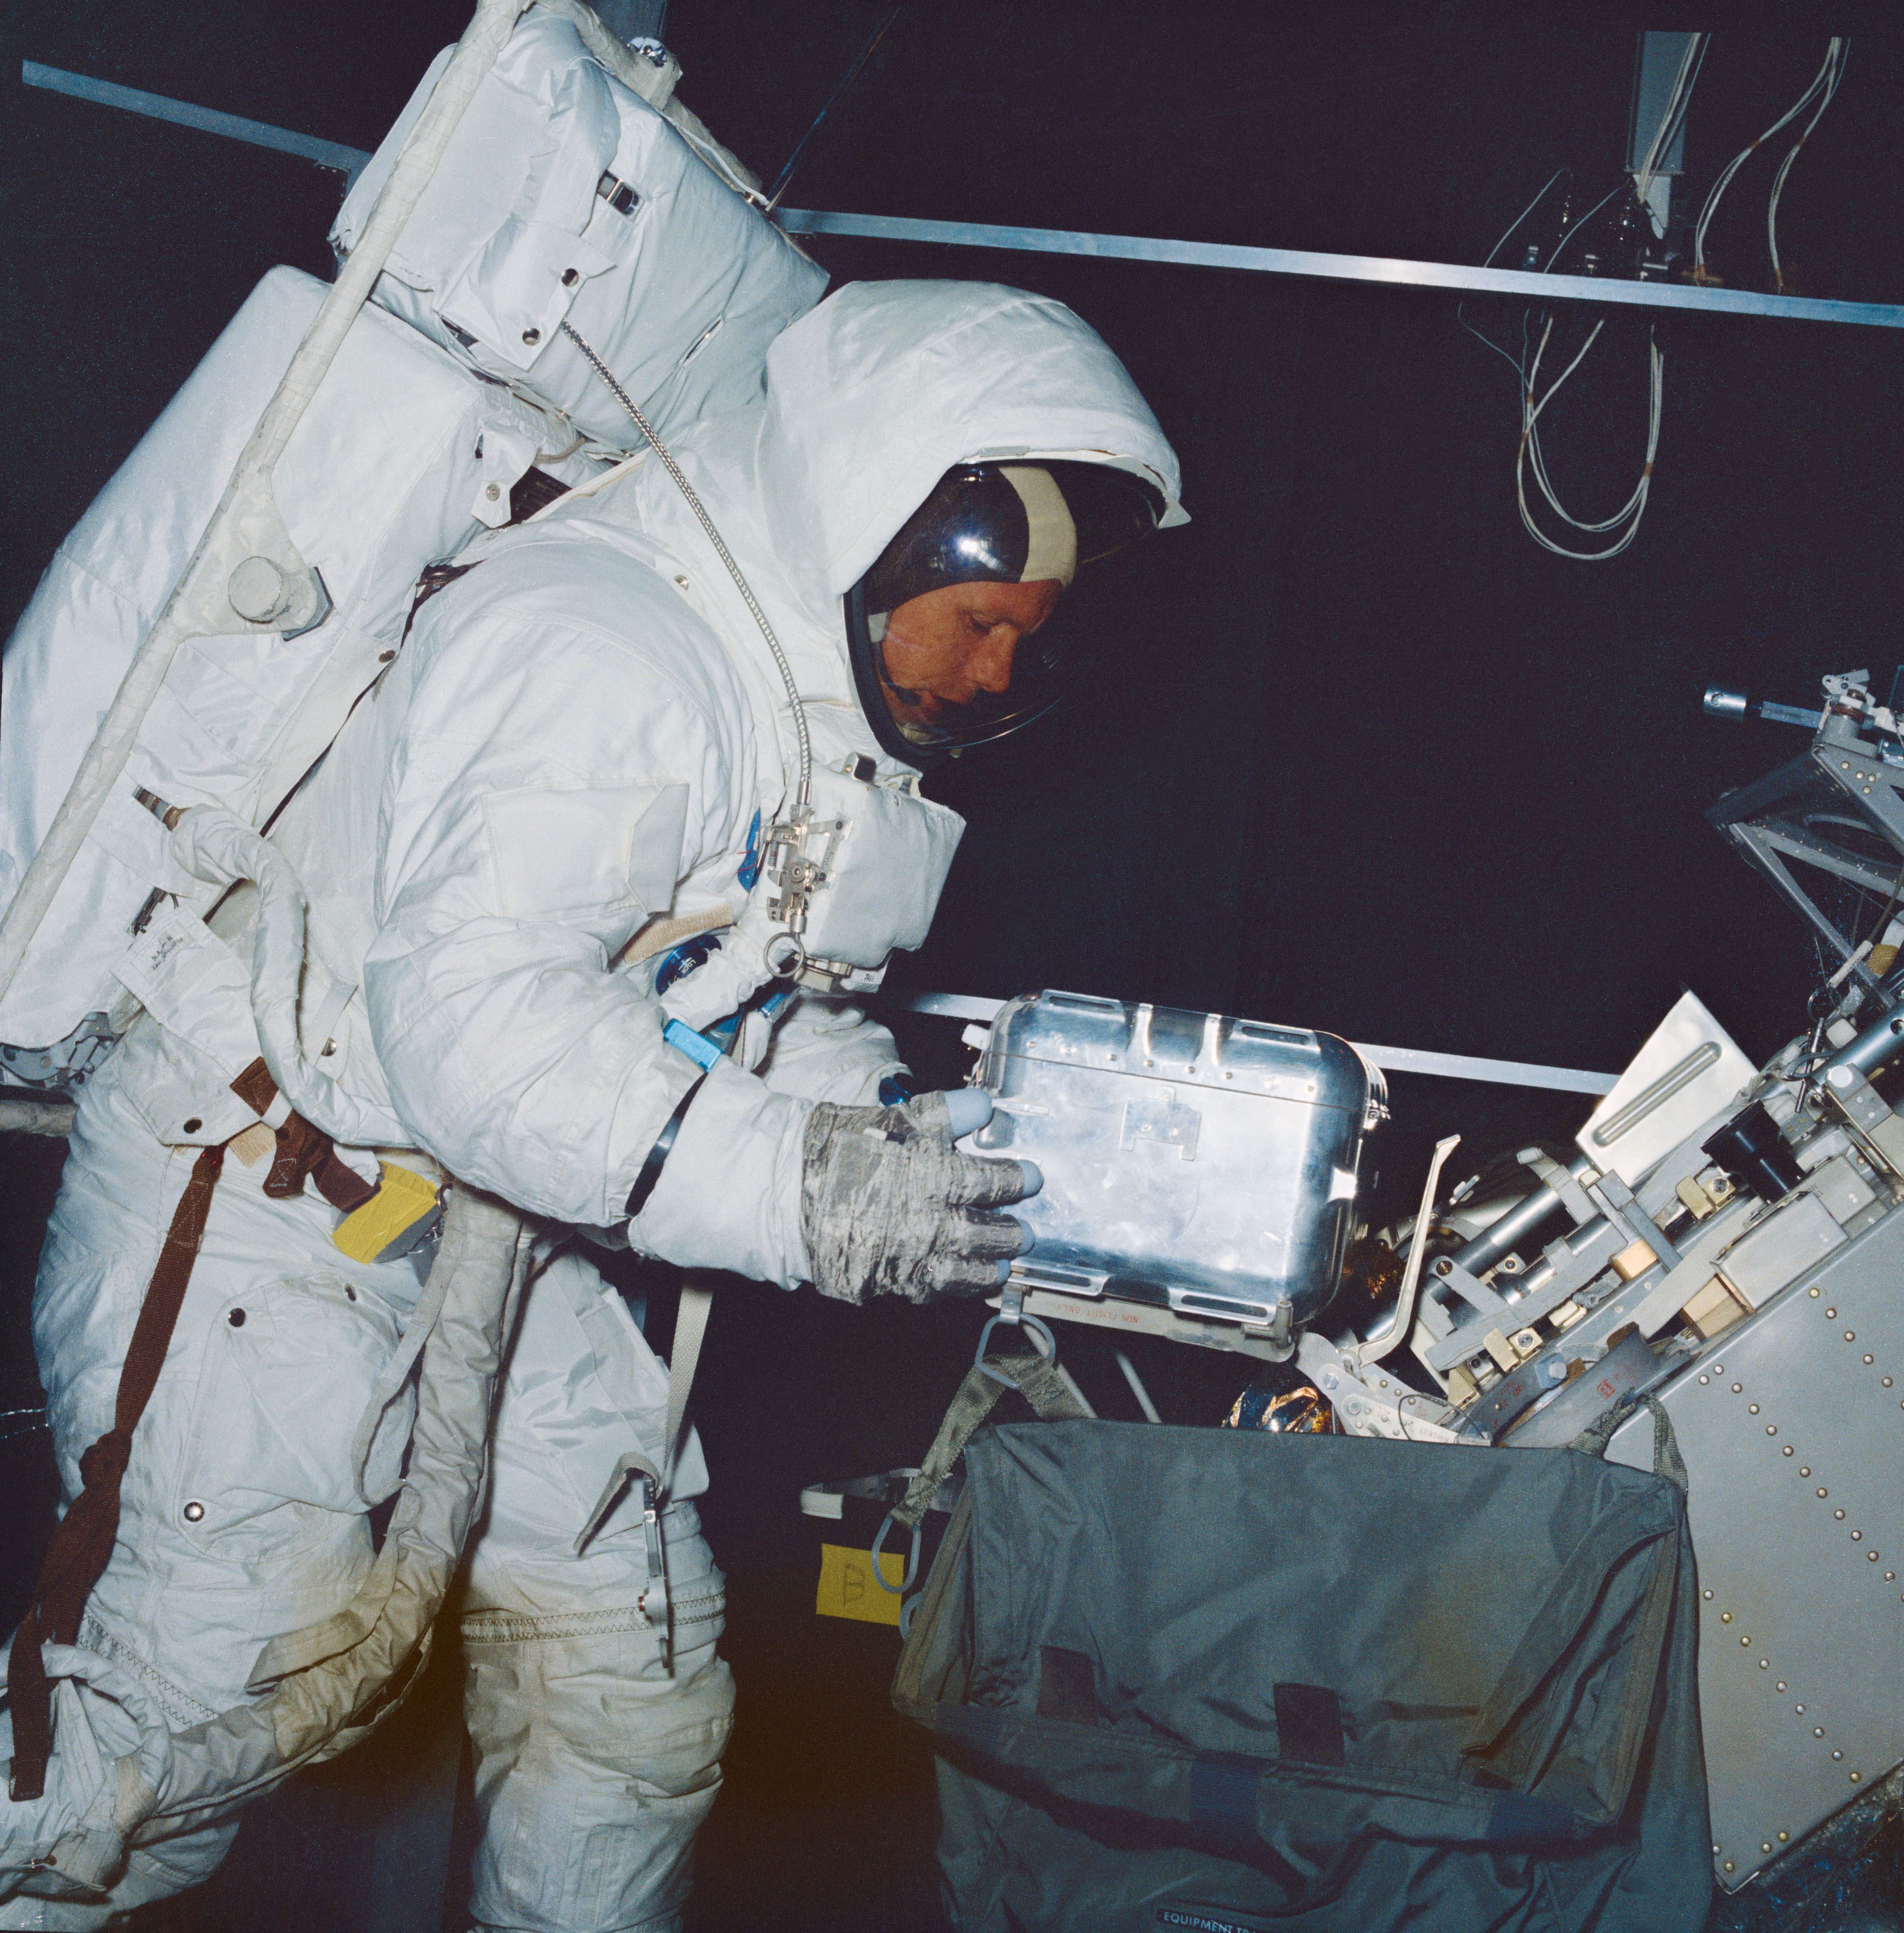
Apollo 11 astronaut Edwin E. “Buzz” Aldrin tests his spacesuit in a vacuum chamber Michael Collins prepares to enter the centrifuge gondola Neil A. Armstrong trains with a lunar sample container in a vacuum chamber
Left: Apollo 11 astronaut Edwin E. “Buzz” Aldrin tests his spacesuit in a vacuum chamber. Middle: Michael Collins prepares to enter the centrifuge gondola. Right: Neil A. Armstrong trains with a lunar sample container in a vacuum chamber.

To ensure the space-worthiness of their spacesuits, the astronauts tested them in the 8-foot altitude chamber in MSC’s Crew Systems Division. Collins and Anders spent time in the centrifuge in MSC’s Flight Acceleration Facility, practicing profiles of a launch and a reentry from a lunar mission. In MSC’s Building 9, on April 18 Armstrong and Aldrin, wearing their spacesuits, completed a 2.5-hour simulation of activities, such as collecting rock and soil samples and deploying scientific instruments, that they will perform on the lunar surface. Armstrong, Aldrin, Lovell, and Haise each completed sea-level runs in Chamber B of MSC’s Space Environment Simulation Laboratory. During these tests, the astronauts wore their spacesuits and practiced the various lunar surface activities, such as activating the television camera, collecting rock samples, and deploying the scientific experiments of the Early Apollo Surface Experiment Package (EASEP). They followed up these ambient sessions with altitude runs in early May.
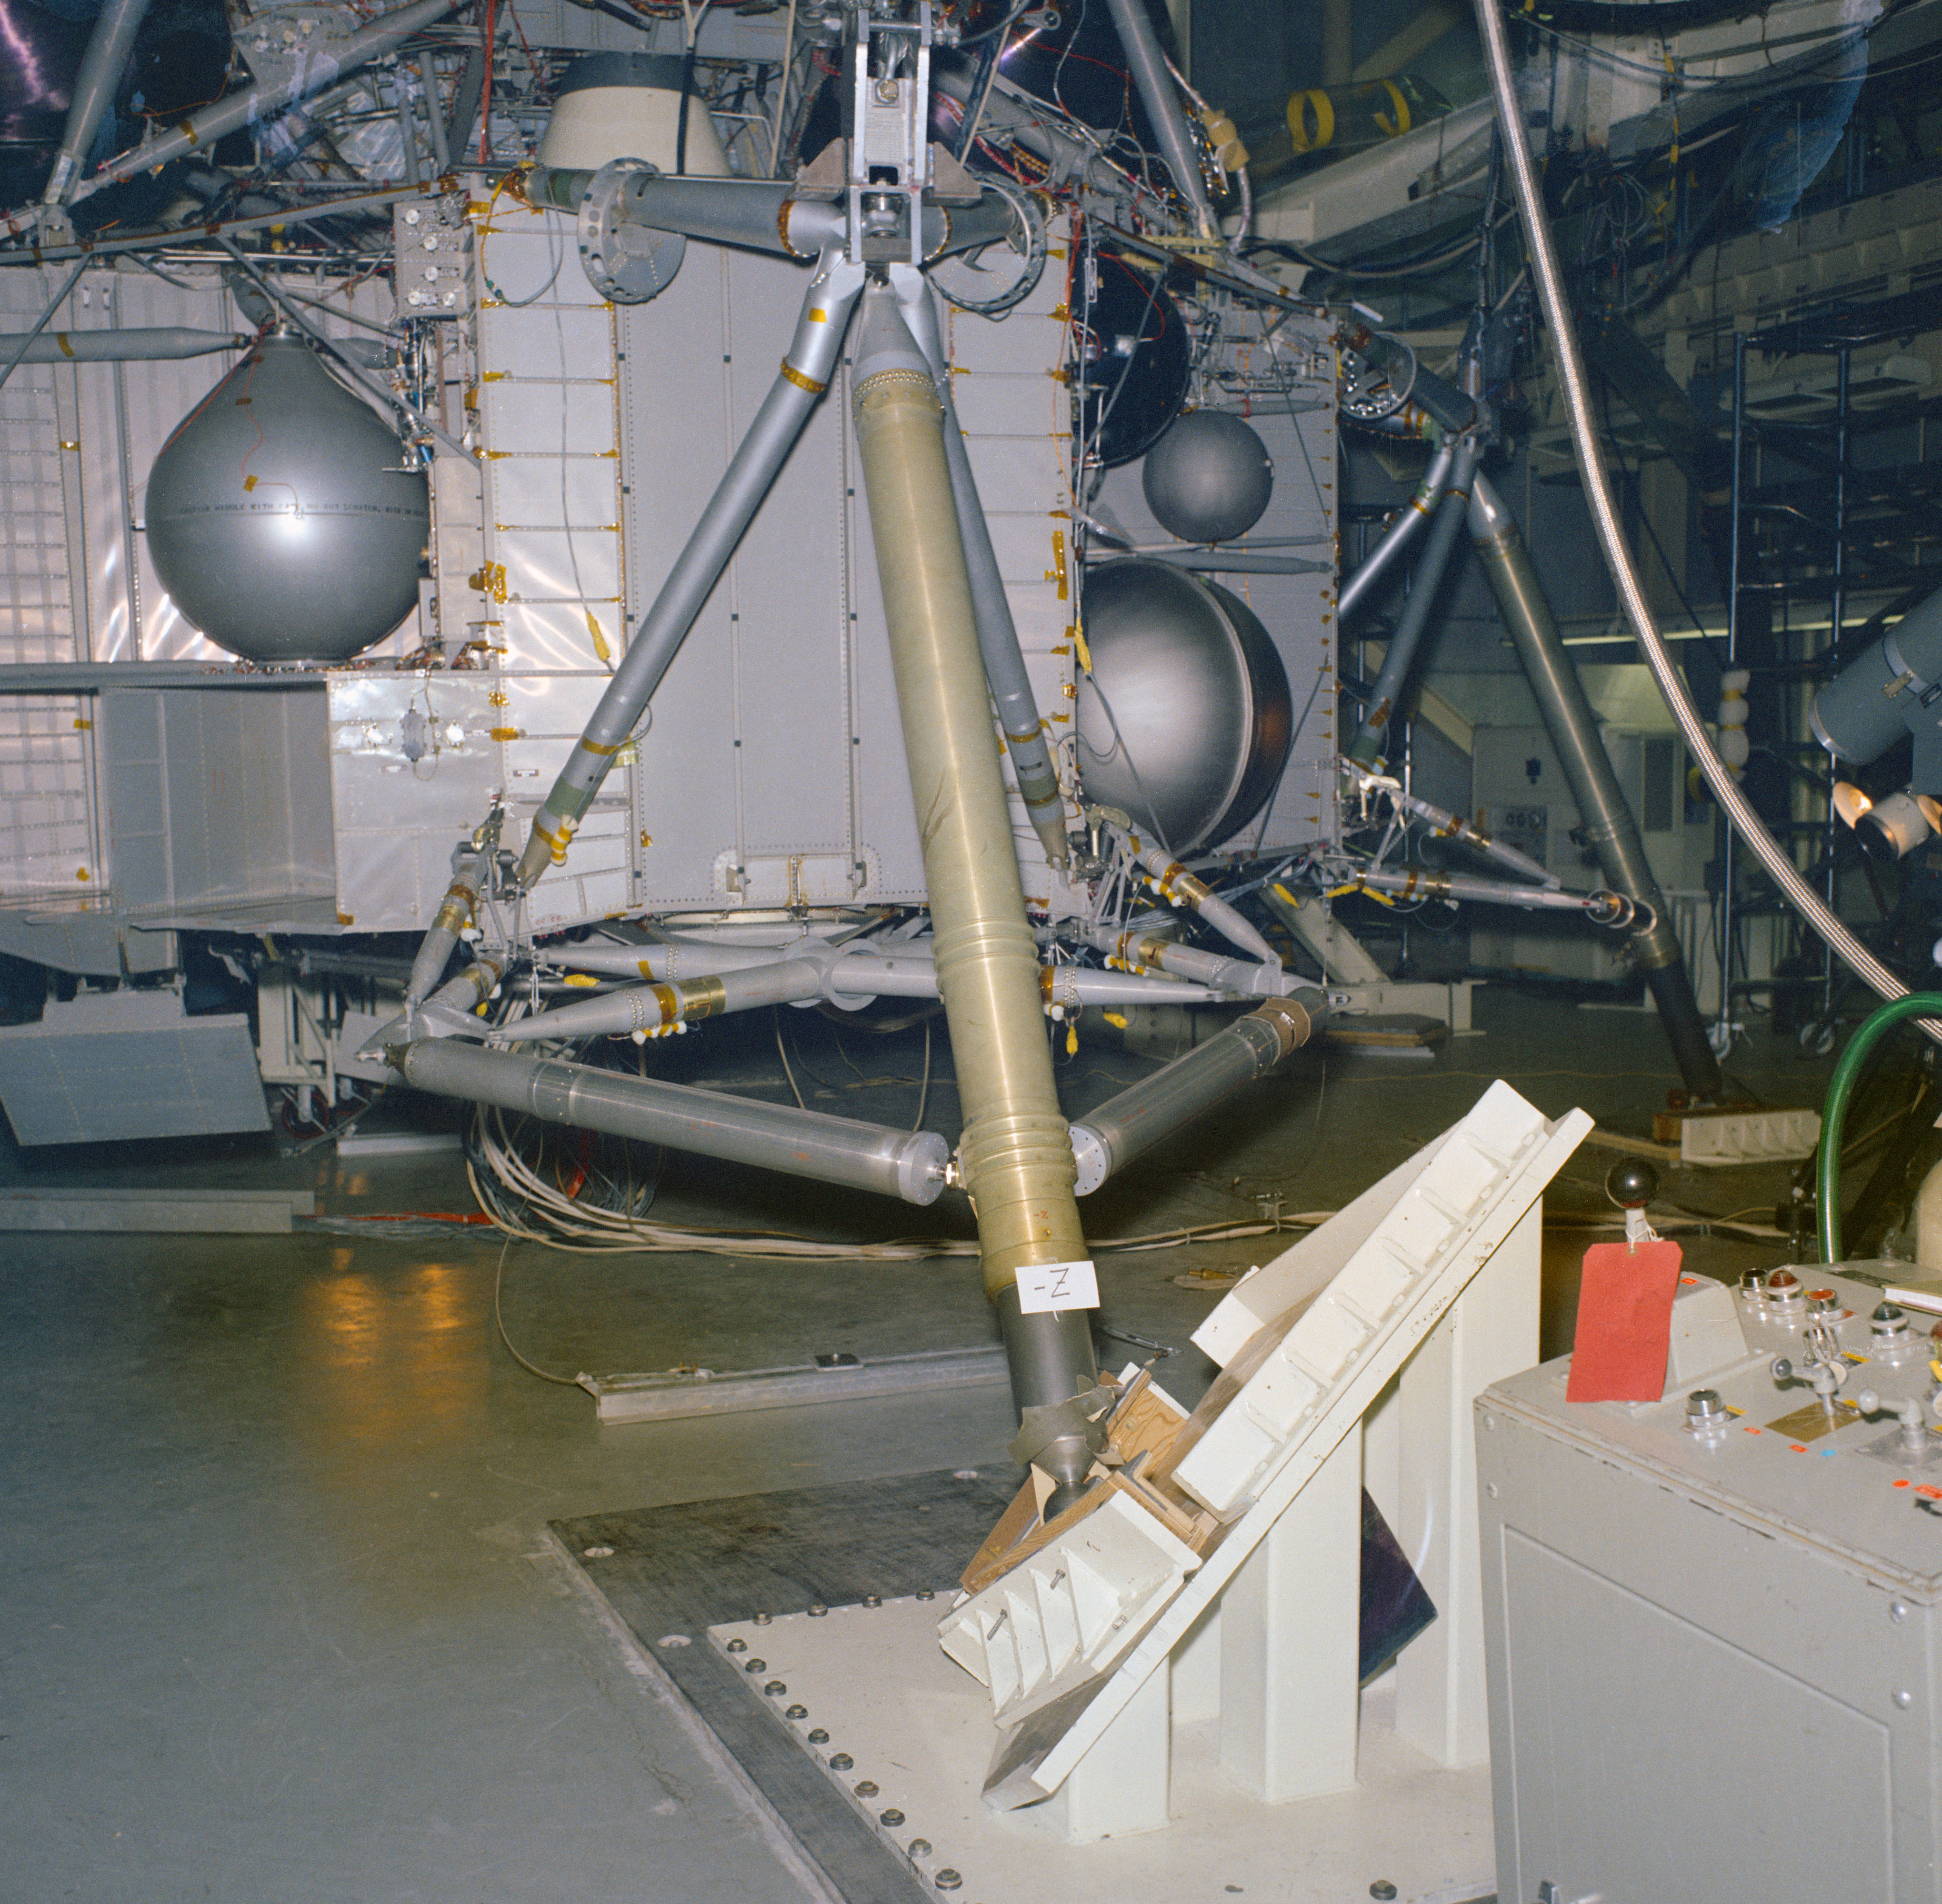
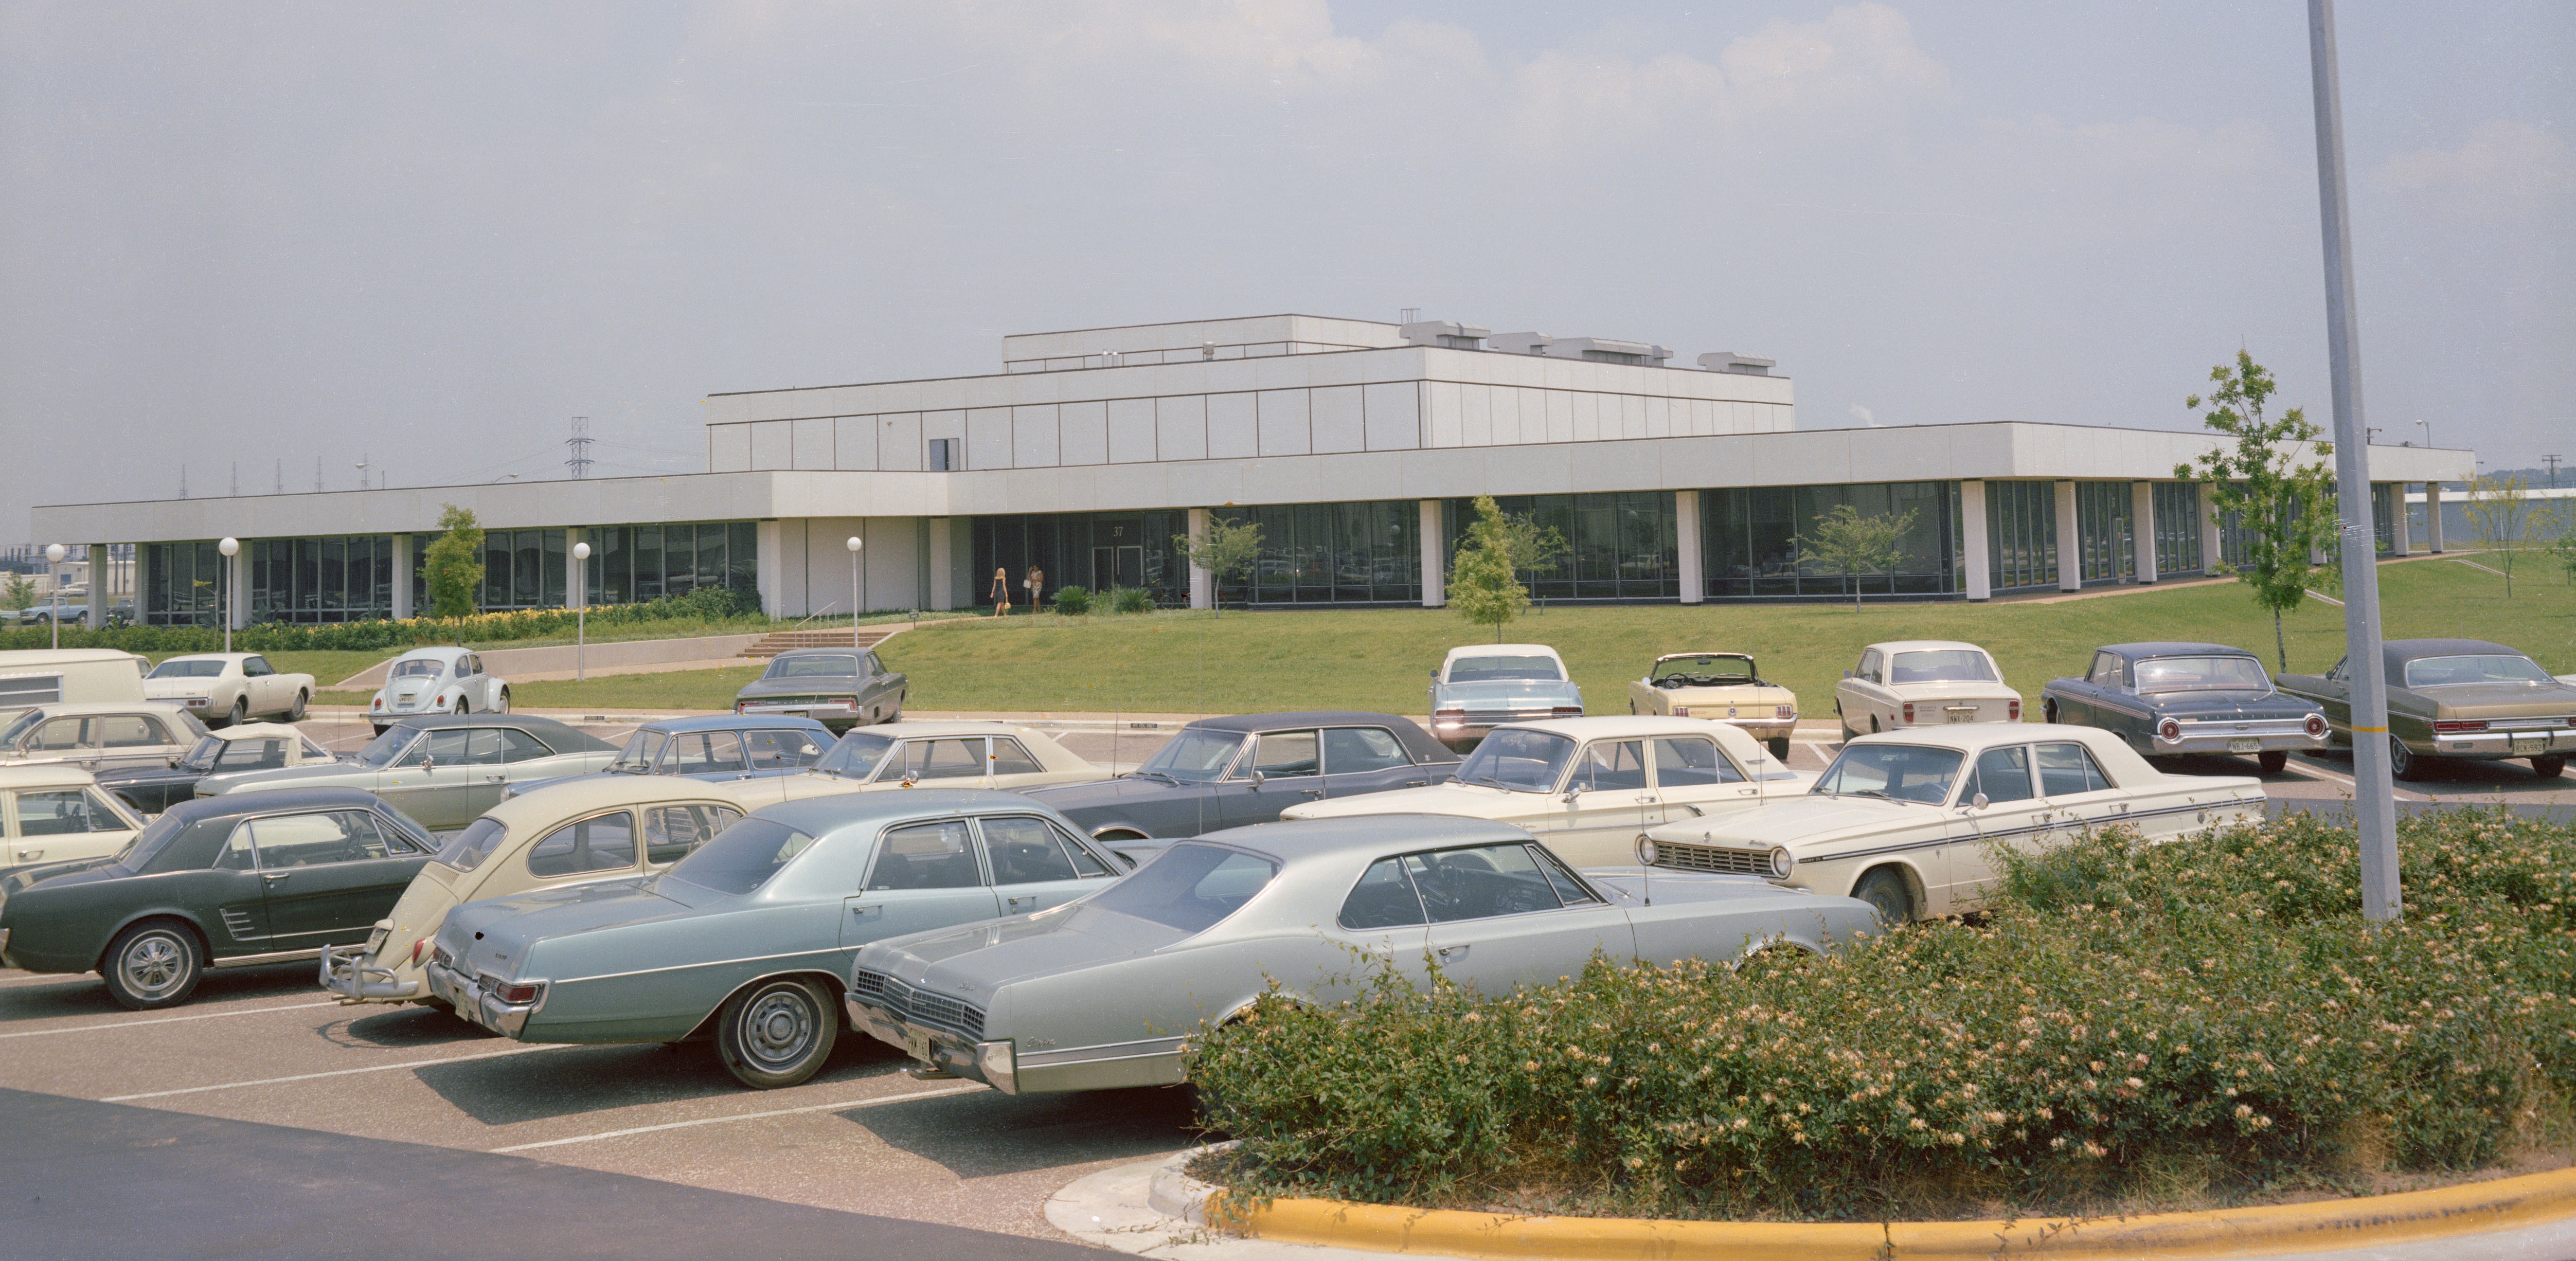
One of the three Lunar Module-2 drop tests conducted during the first week of April The Lunar Receiving Laboratory for astronauts and lunar samples returning from the Moon
Left: One of the three Lunar Module-2 drop tests conducted during the first week of April. Right: The Lunar Receiving Laboratory for astronauts and lunar samples returning from the Moon.

To certify the LM and its systems for the loads it would encounter during a lunar landing, engineers at MSC continued drop tests with the flight-like LM-2 in the Vibration and Acoustics Test Facility (VATF).  Beginning the series in late March, engineers completed three of the five drop tests in early April. These tests induced lateral accelerations on the wire harnesses and plumbing in the spacecraft’s aft equipment bay, produced high acceleration loads around the inertial measurement unit and the environmental control system, and stressed the LM’s front face and side hatch. The final test in early May completed the certification of the LM for the first lunar landing. Elsewhere at MSC, staff continued to prepare the Lunar Receiving Laboratory (LRL) for the return of astronauts and samples from the Moon. Workers completed long-duration simulations of the LRL’s major functions including the Crew Reception Area in early April. The tests highlighted some deficiencies requiring correction prior to the first Moon landing flight. These included problems with the sterilization equipment and the gloves used in gloveboxes to handle lunar samples repeatedly developed holes, compromising the biological barrier. A management readiness review held April 17-18 also noted these as areas needing improvement. To solve these issues, MSC Director Robert R. Gilruth named his special assistant Richard S. Johnston to oversee all aspects of the LRL. Workers corrected the problems and the LRL received certification just prior to the Apollo 11 mission.
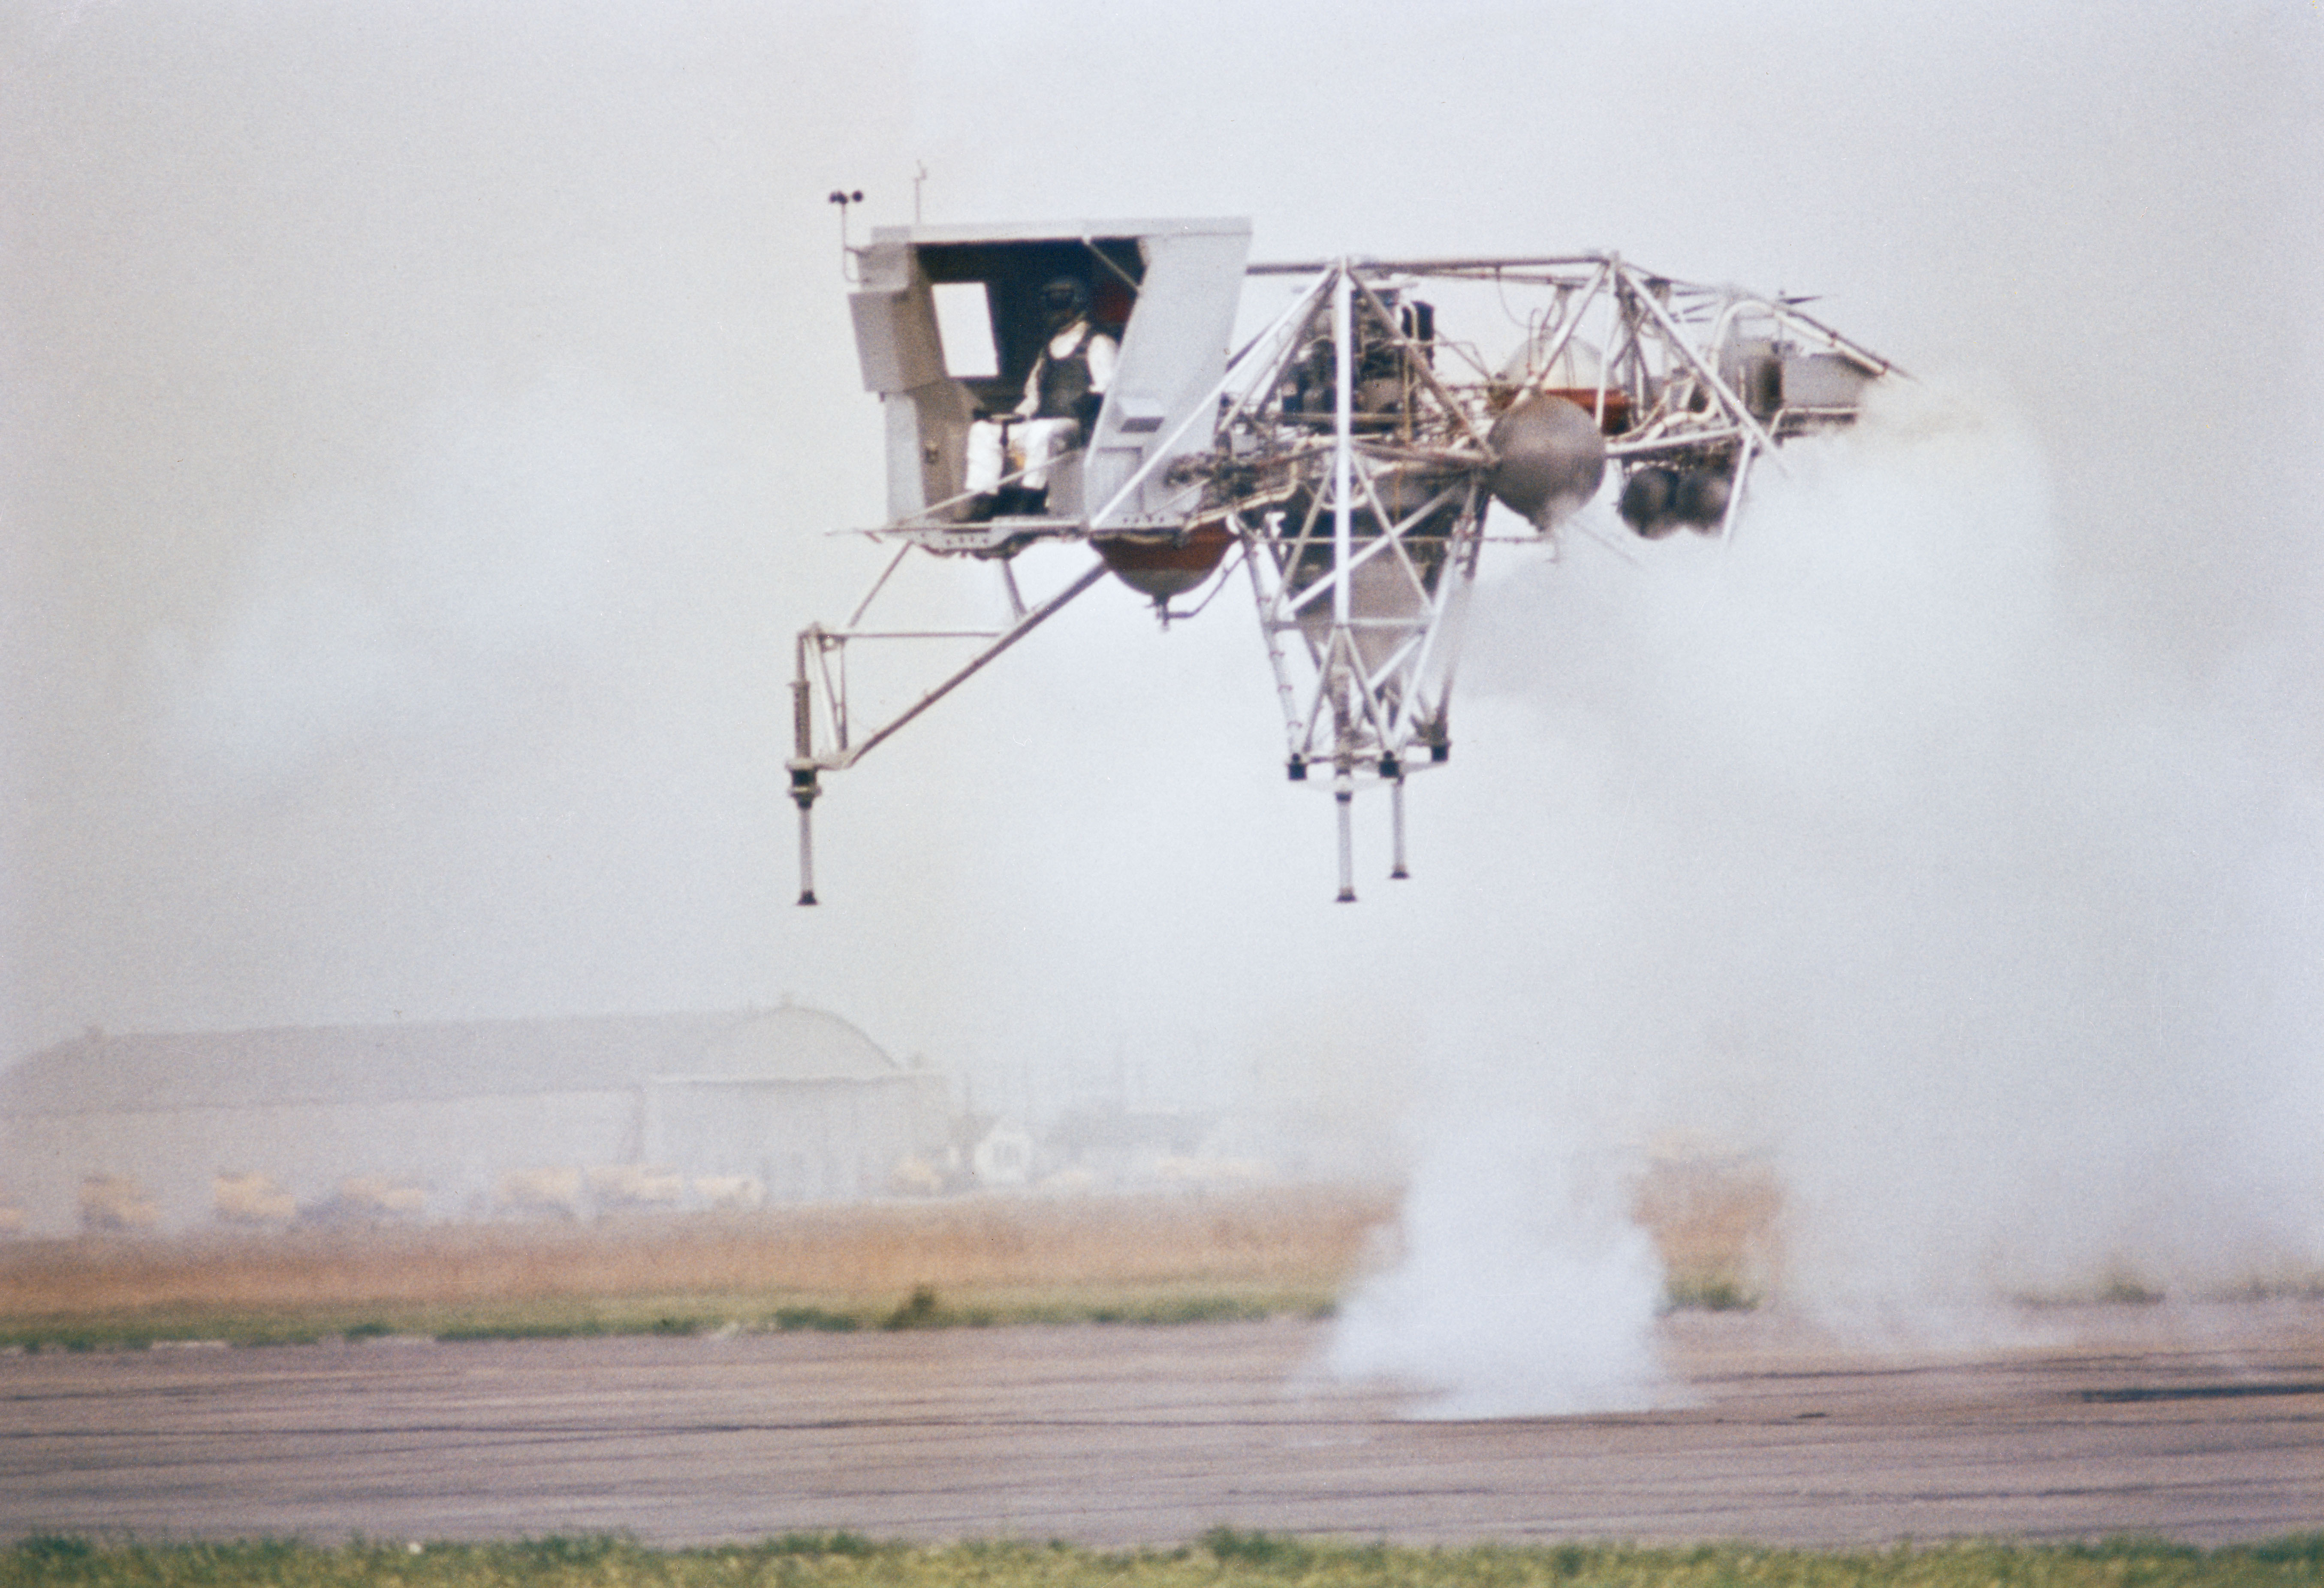
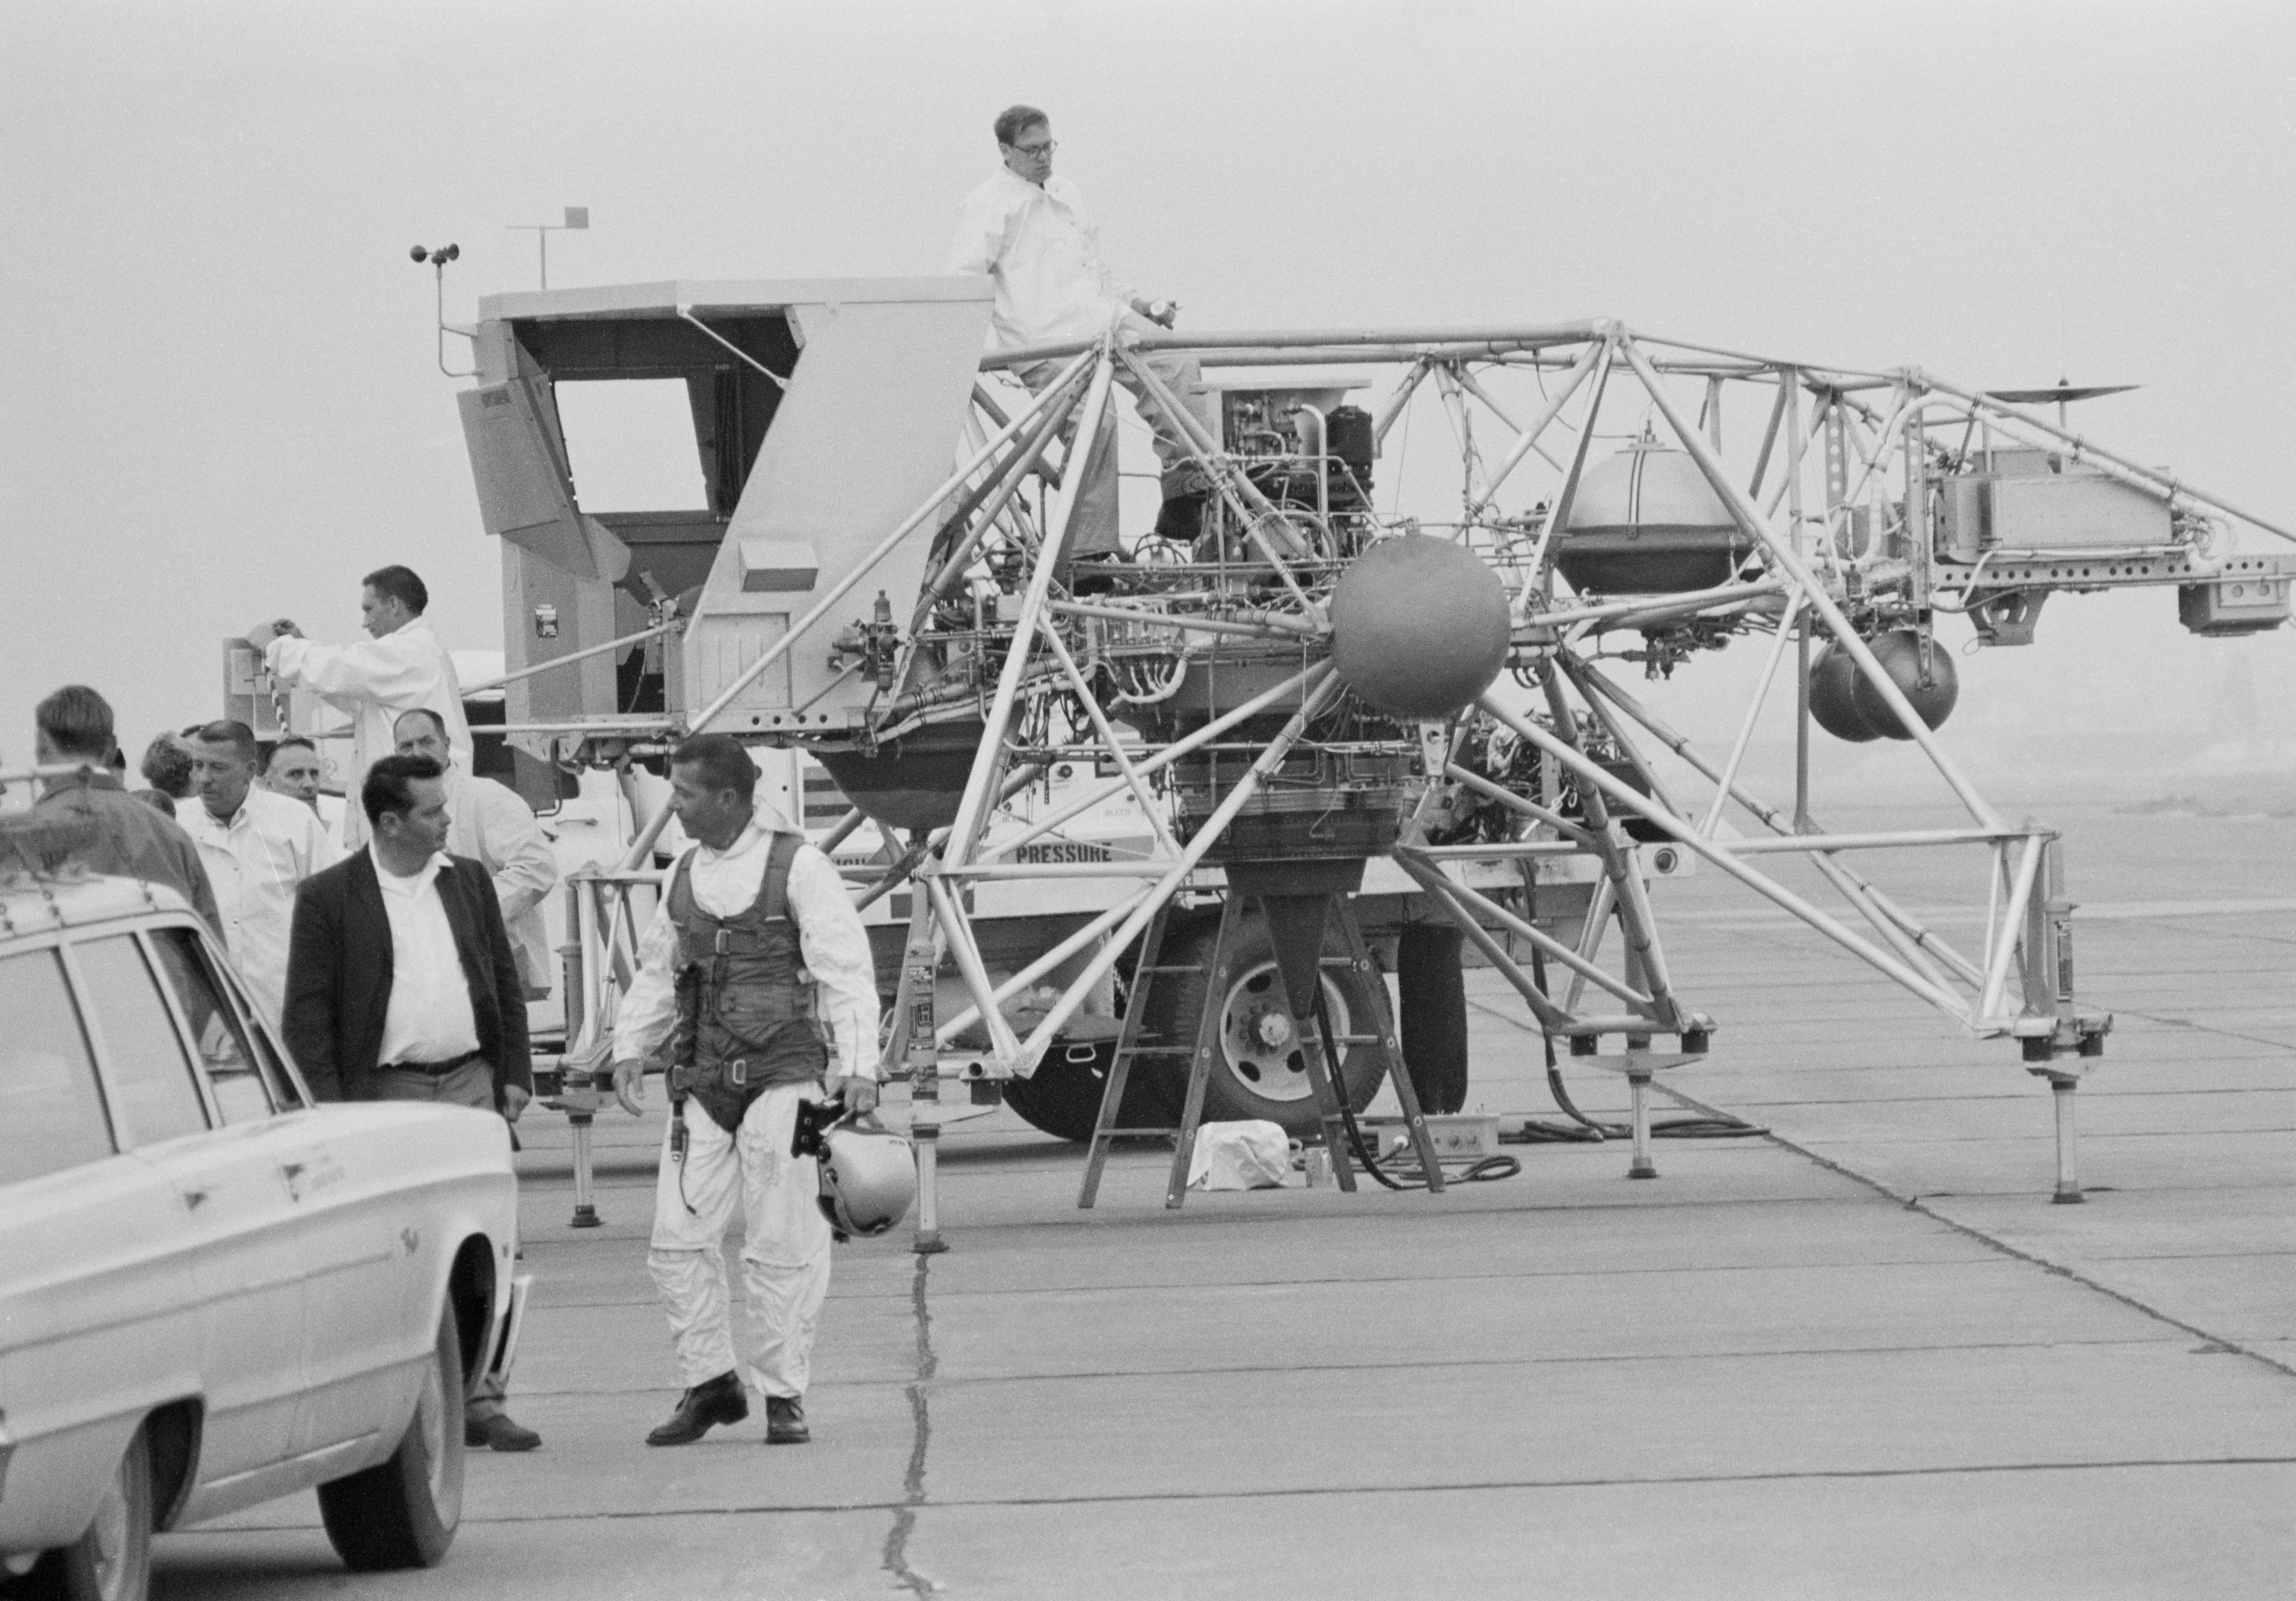
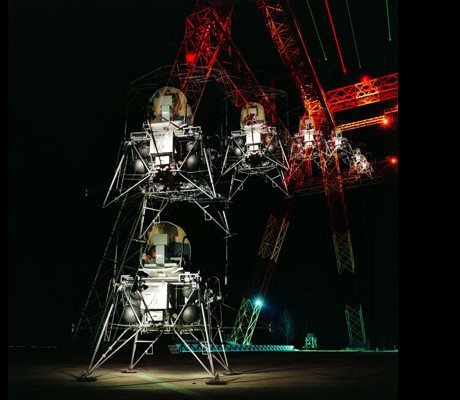
At Ellington Air Force Base in Houston, NASA pilot Harold E. “Bud” Ream at the controls of Lunar Landing Training Vehicle-2 (LLTV-2) on its first flight after flights resumed Ream walks away from LLTV-2 after the successful flight Multiple exposure of a practice landing at the Lunar Landing Research Facility at NASA’s Langley Research Center in Hampton, Virginia
Left: At Ellington Air Force Base in Houston, NASA pilot Harold E. “Bud” Ream at the controls of Lunar Landing Training Vehicle-2 (LLTV-2) on its first flight after flights resumed. Middle: Ream walks away from LLTV-2 after the successful flight. Right: Multiple exposure of a practice landing at the Lunar Landing Research Facility at NASA’s Langley Research Center in Hampton, Virginia. 

At Ellington Air Force Base near MSC, the Lunar Landing Training Vehicle (LLTV) resumed flight operations on April 7 with MSC pilot Harold E. “Bud” Ream at the controls. Apollo commanders relied on the LLTV as a key training tool to simulate the flying characteristics of the LM, especially of the final 500 feet of the descent. But NASA managers had grounded the LLTV after a crash in December 1968, and following investigations had allowed flights to resume but only by test pilots. Ream completed more than a dozen flights before managers cleared the LLTV for astronaut training in June. While the LLTV remained grounded, Apollo 11 astronauts made use of the Lunar Landing Research Facility (LLRF) at the NASA Langley Research Center in Hampton, Virginia, to train for the final descent to the lunar surface.  Lovell and Haise practiced Moon landings in the LLRF in mid-April. Armstrong and Aldrin would use the facility for practice landings in late June. Once managers cleared the LLTV for astronaut use in early June, Armstrong and Lovell completed training flights in that higher fidelity vehicle later that month.

Apollo 12

Looking beyond Apollo 11, NASA continued preparations for the next missions. In case Apollo 11 could not achieve the Moon landing, the agency established readiness dates for Apollo 12 of Sept. 13 and Apollo 13 of Nov. 10, to try again. If Apollo 11 succeeded, the follow on missions would occur at four-month intervals and explore different regions of the Moon with an expanded set of science instruments and geology objectives.
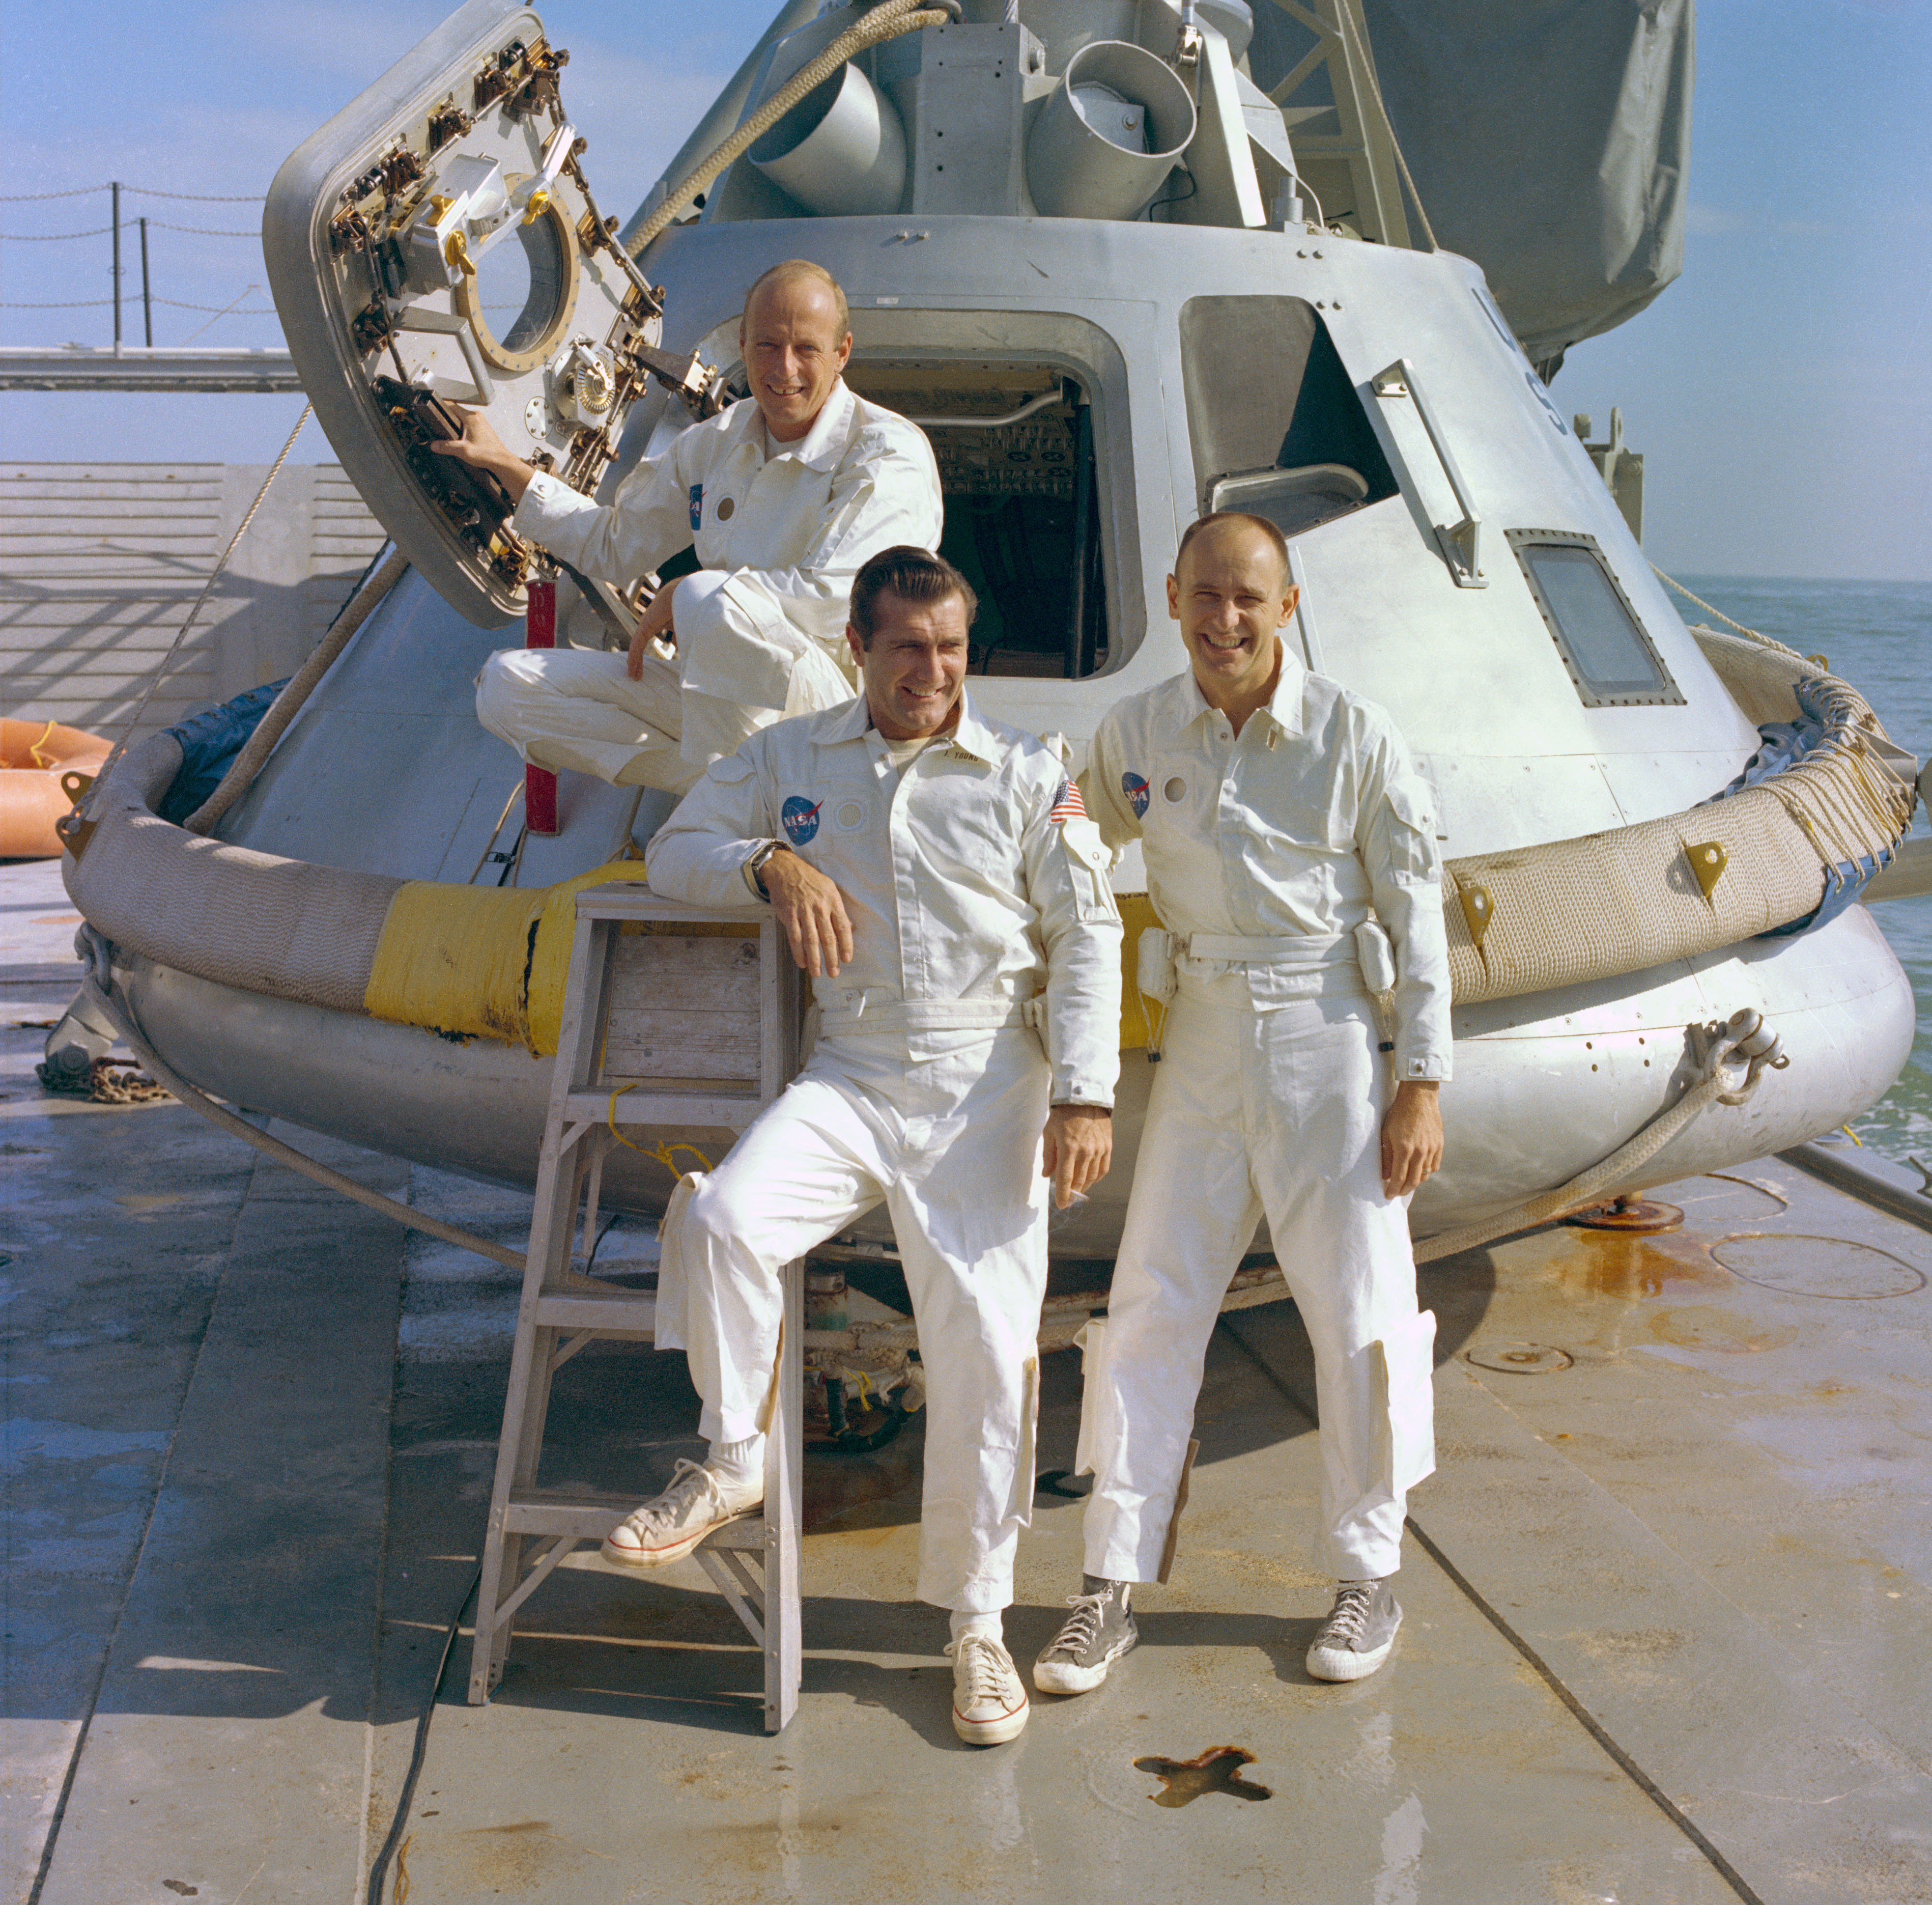
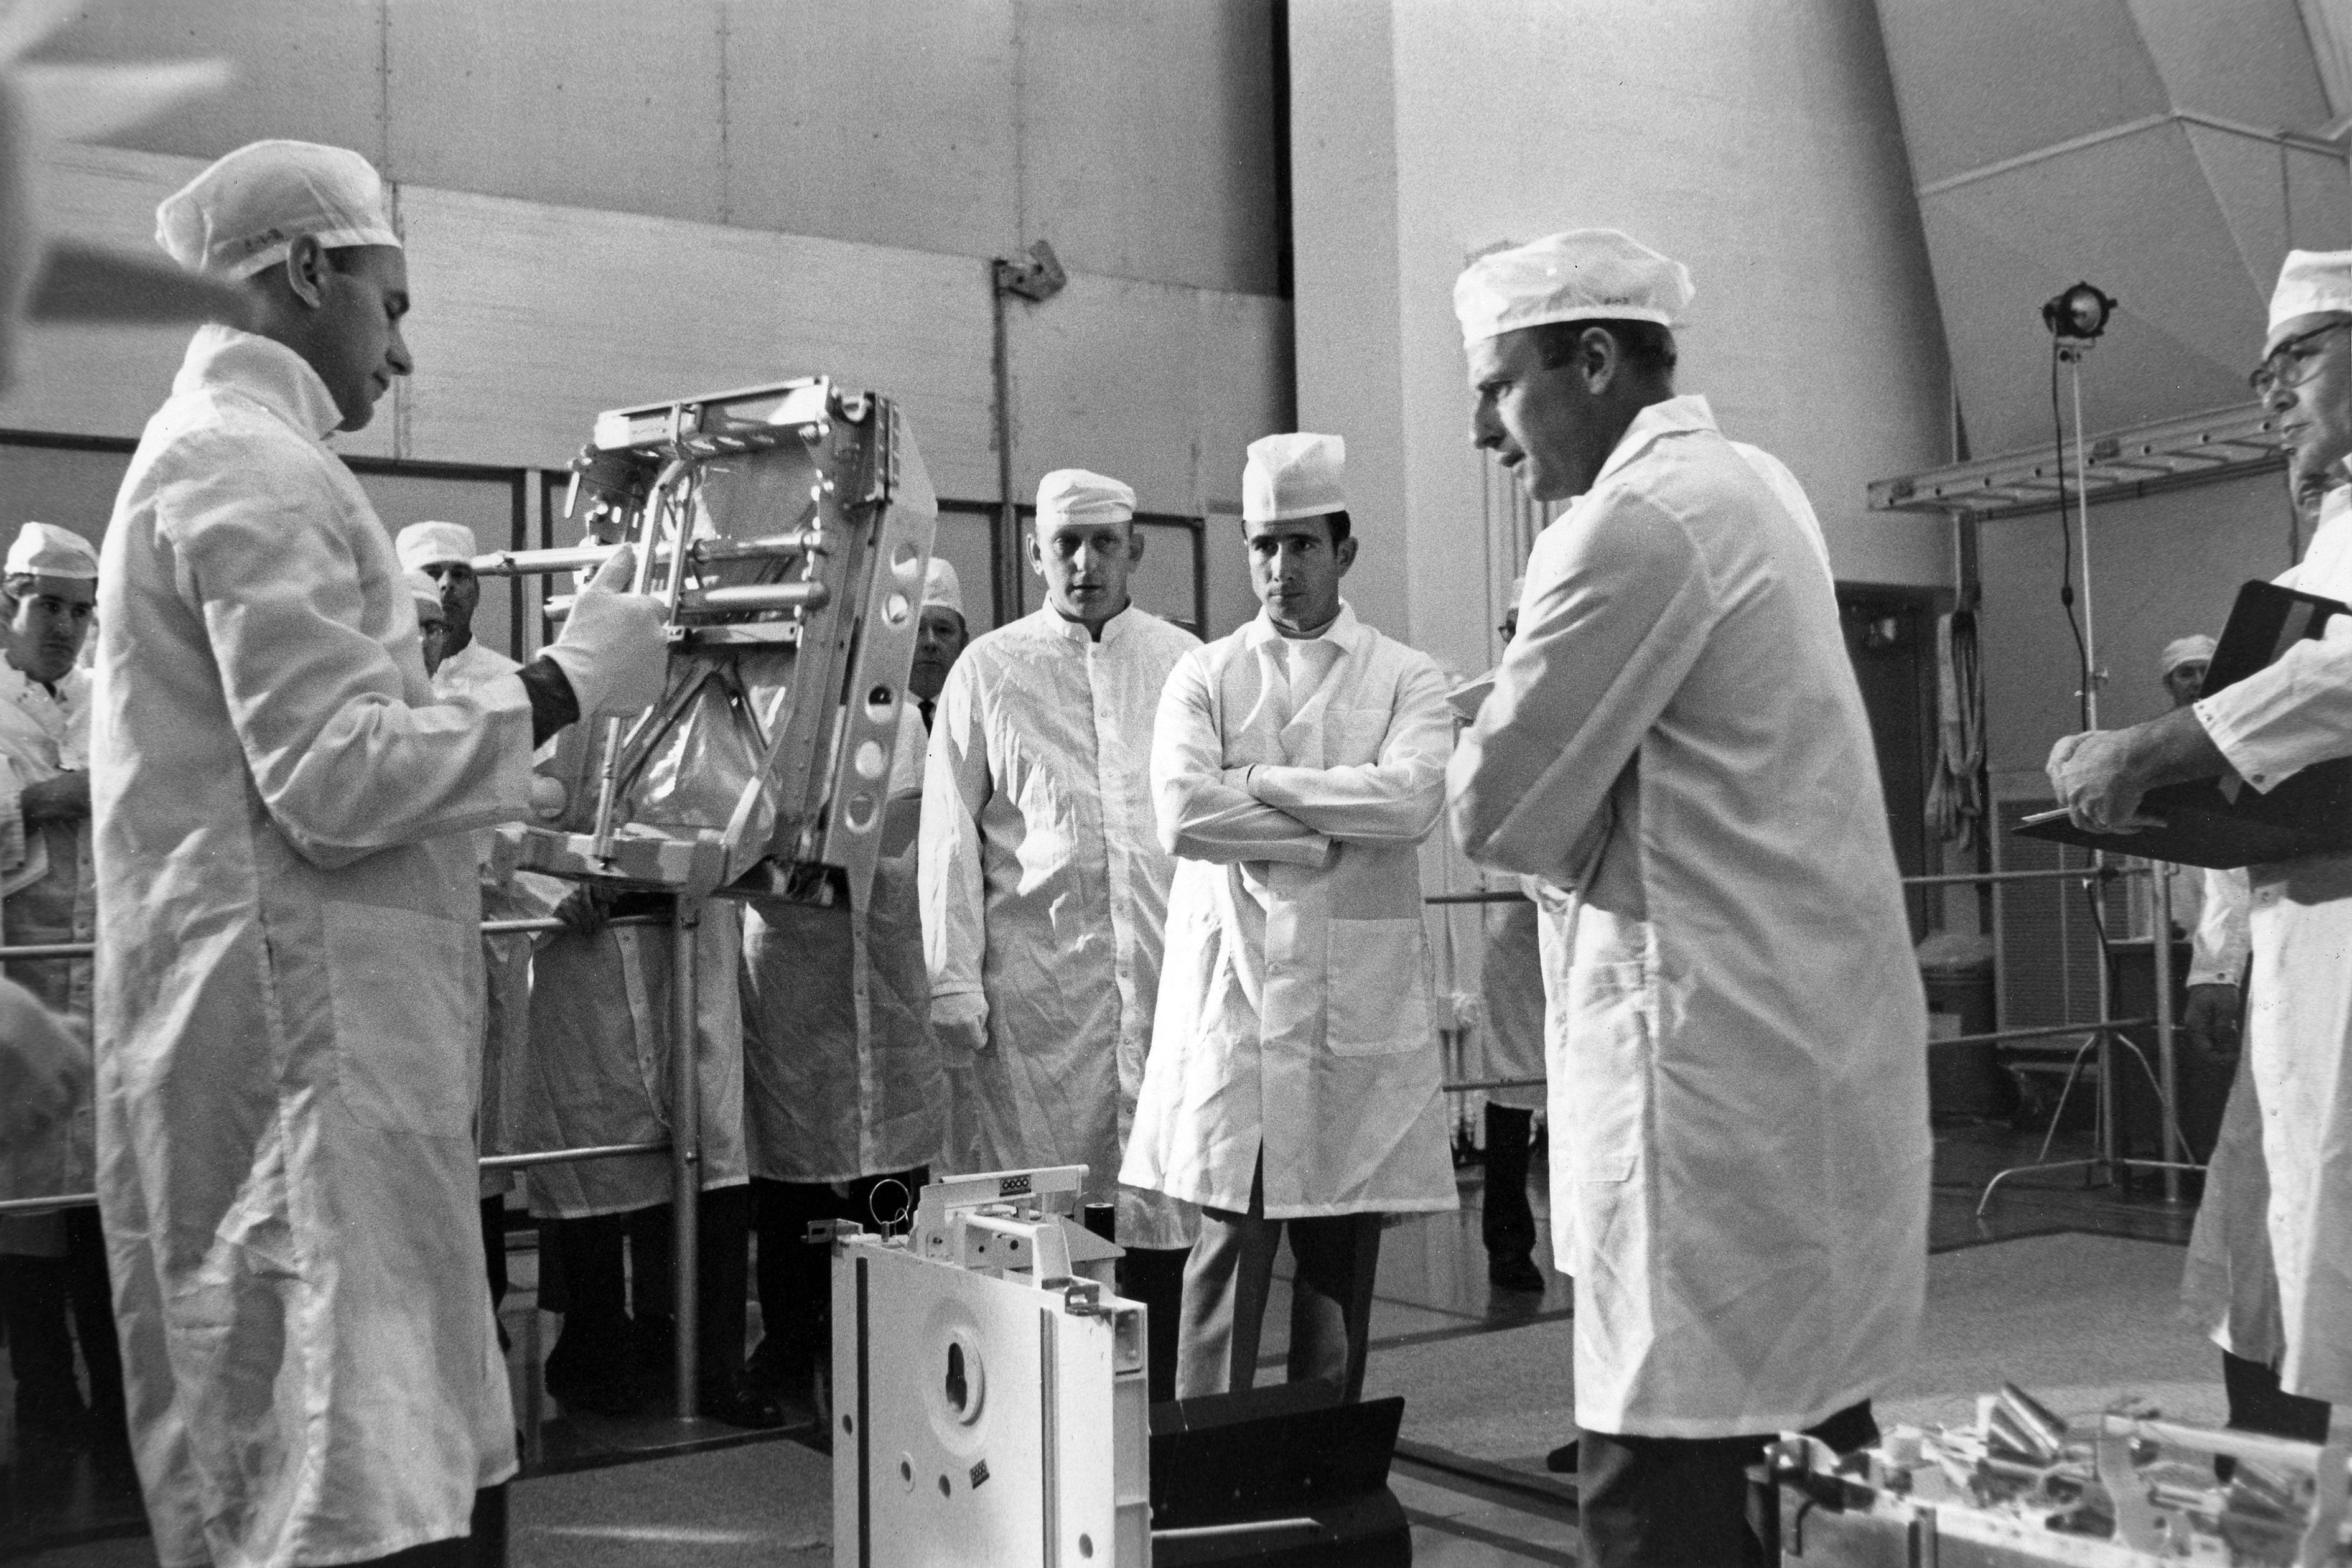
Apollo 12 astronauts Charles “Pete” Conrad, left, Richard F. Gordon, and Alan L. Bean pose in front of a boilerplate Apollo capsule during water egress training when they served as the backup crew for Apollo 9 Apollo 12 prime crew members Conrad, left, and Bean, right, review Apollo Lunar Surface Experiment Package equipment as backup astronaut James B. Irwin, with arms folded, looks on
Left: Apollo 12 astronauts Charles “Pete” Conrad, left, Richard F. Gordon, and Alan L. Bean pose in front of a boilerplate Apollo capsule during water egress training when they served as the backup crew for Apollo 9. Right: Apollo 12 prime crew members Conrad, left, and Bean, right, review Apollo Lunar Surface Experiment Package equipment as backup astronaut James B. Irwin, with arms folded, looks on.

On April 10, NASA announced the prime and backup crews for Apollo 12. The prime crew consisted of Charles “Pete” Conrad, Richard F. Gordon, and Alan L. Bean. The three had served as the backup crew for the March 1969 Apollo 9 mission. Conrad had flown in space twice before, during the then record-breaking eight-day Gemini V mission in 1965 and with Gordon on his only previous mission during Gemini XI in 1966, when they achieved a then-record human space flight altitude of 853 miles. NASA selected Bean, a spaceflight rookie, in 1963. The Apollo 12 backup crew of David R. Scott, Alfred M. Worden, and James B. Irwin would fly the mission in case something happened to the prime crew. Scott had previously flown in space aboard Gemini VIII in 1966, the mission that accomplished the first docking in space and also made the first emergency landing, and more recently he flew aboard Apollo 9. Worden and Irwin had not yet flown in space, but Worden had served on support crews and Irwin as the commander of the crew that conducted tests with LM Test Article-8 (LTA-8) in 1968 to evaluate the LM in a vacuum chamber at MSC.
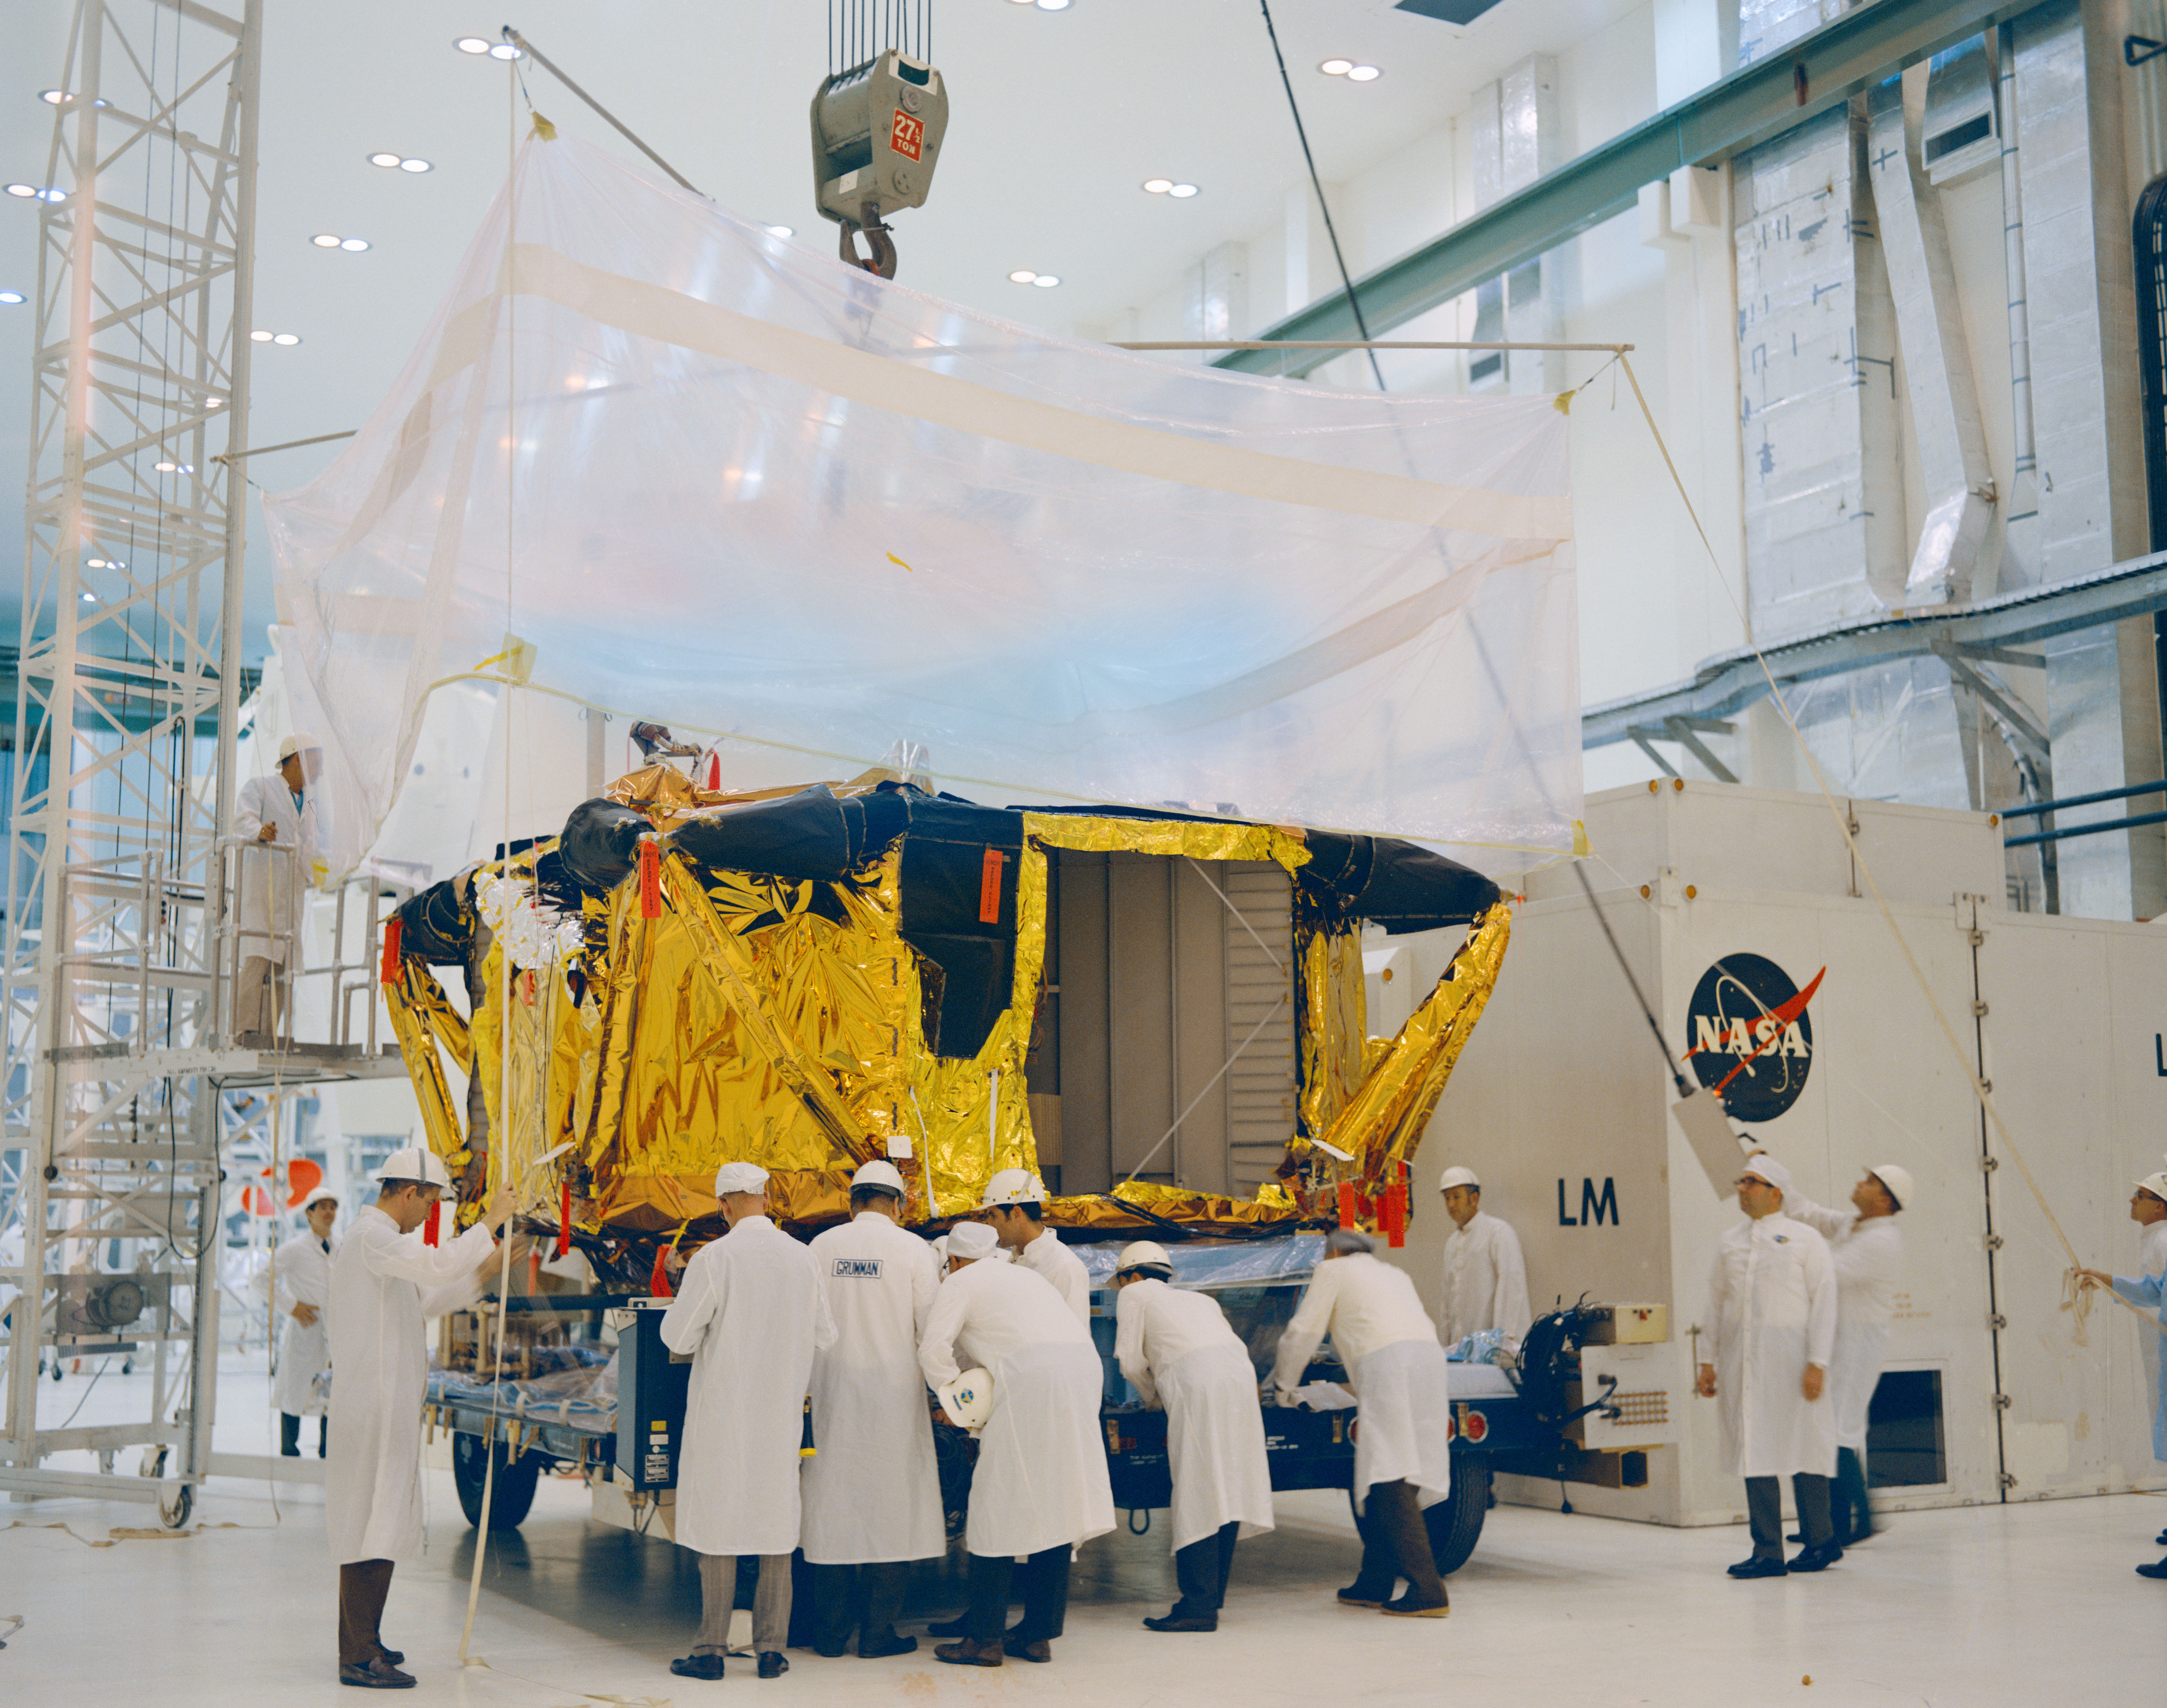
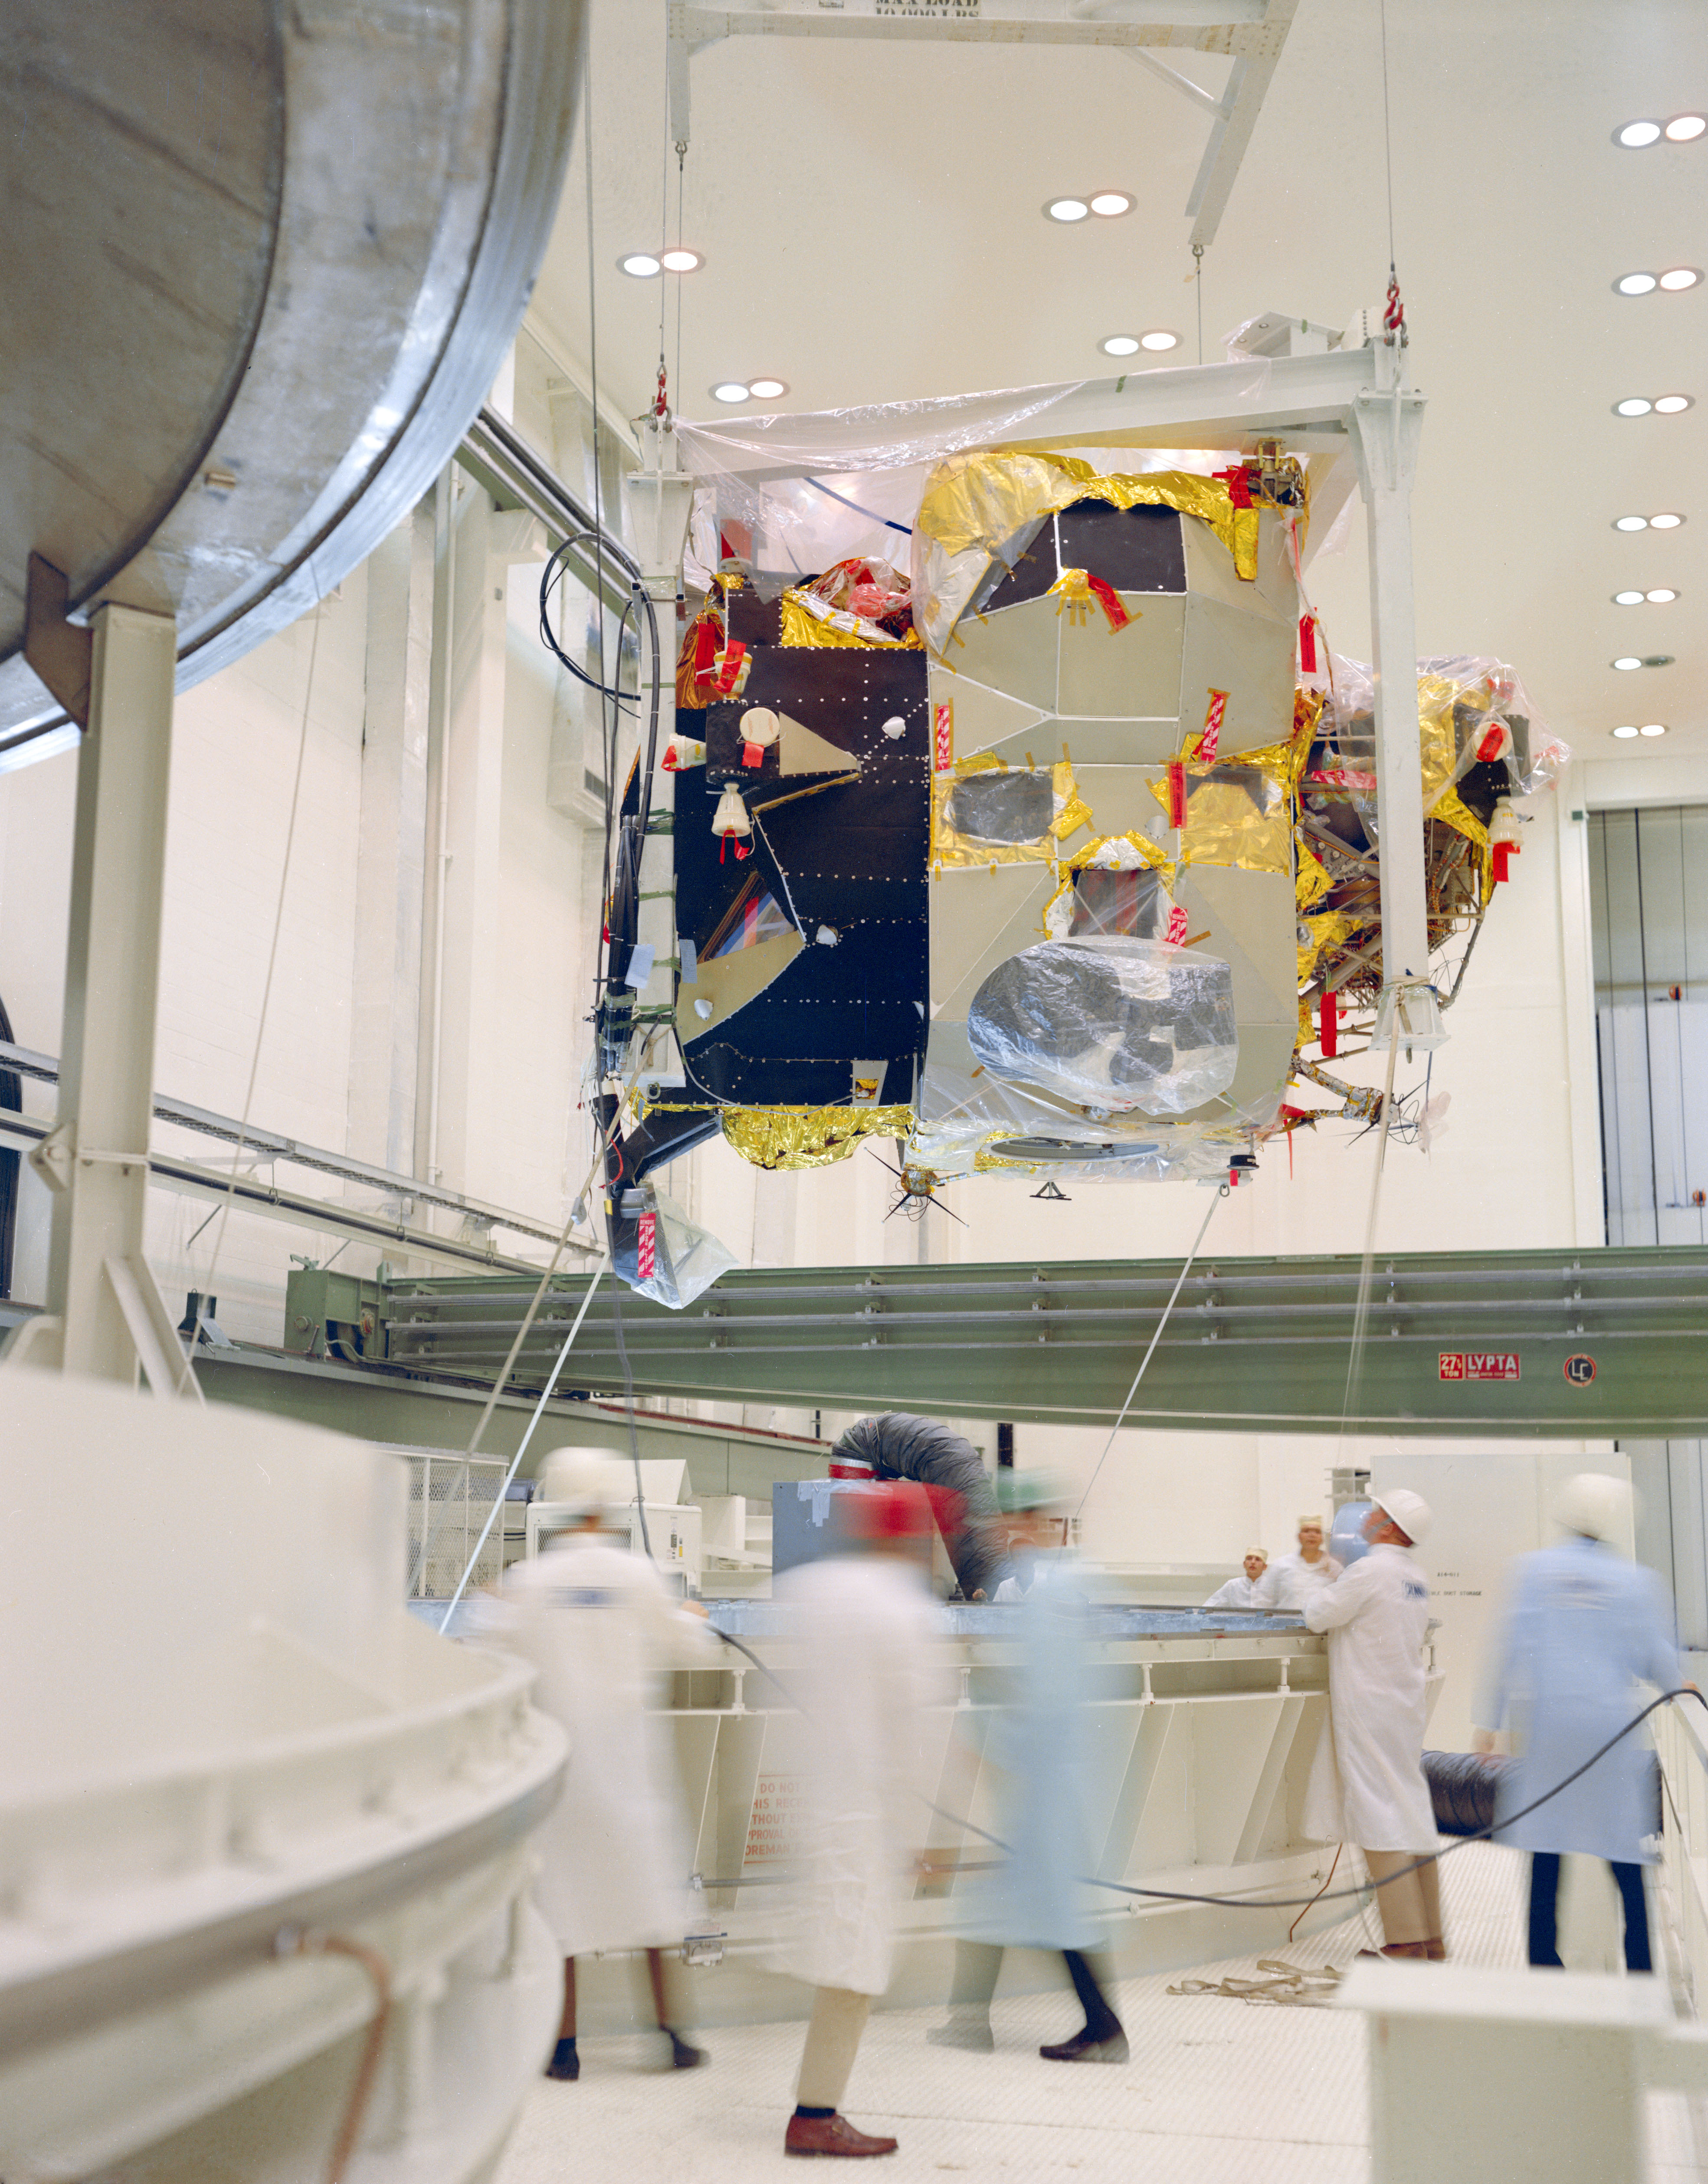
At NASA’s Kennedy Space Center (KSC) in Florida, workers unwrap the Apollo 12 Lunar Module (LM) descent stage shortly after its arrival in the Manned Spacecraft Operations Building Workers lower the Apollo 12 LM ascent stage onto the Command Module for a docking test Workers roll the Apollo 12 Saturn V S-II second stage into KSC’s Vehicle Assembly Building
Left: At NASA’s Kennedy Space Center (KSC) in Florida, workers unwrap the Apollo 12 Lunar Module (LM) descent stage shortly after its arrival in the Manned Spacecraft Operations Building. Middle: Workers lower the Apollo 12 LM ascent stage onto the Command Module for a docking test. Right: Workers roll the Apollo 12 Saturn V S-II second stage into KSC’s Vehicle Assembly Building.

At KSC, components for Apollo 12 began to arrive for processing. The Saturn V’s S-IVB third stage had arrived at the VAB in March, joined by the S-II second stage on April 21, with the S-IC first stage expected in May. The Apollo 12 LM and CSM had arrived in the MSOB in March, and as workers finished up work with the Apollo 11 spacecraft, they shifted their focus to processing Apollo 12. On April 18, they conducted a docking test between the LM’s ascent stage and the CSM, already placed in its altitude chamber for future testing.

To be continued …

News from around the world in April 1969:

April 1 – At MSC, Director of Engineering Maxime A. Faget displayed a wood and paper model of a concept that would develop into the reusable space shuttle.

April 1 – The Hawker-Siddeley Harrier – a vertical take-off and landing fighter jet – began service with the Royal Air Force.

April 4 – Surgeon Dr. Denton Cooley implanted the first temporary artificial heart in a human in an operation at St. Luke’s Episcopal Hospital in Houston.

April 7 – First use of what became the Internet, with circulation of a Request for Comments document among the Network Working Group developing communications protocols for the ARPANET, the Internet’s forerunner.

April 14 – The Montreal Expos beat the visiting St. Louis Cardinals in the first Major League Baseball game played outside the U.S.

April 20 – Princeton University announced that for the first time in its 223- year history it would admit women starting in the fall of 1969.

April 22 – Robin Knox-Johnson completed the first solo sail around the world without stopping or taking on supplies during the entire 312-day voyage.

April 28 – Charles de Gaulle resigned as president of France after 11 years in office.

April 29 – President Richard M. Nixon awarded the Presidential Medal of Freedom to bandleader Duke Ellington.

Powered by WPeMatico

Get The Details…
Kelli Mars
Two NASA Sounding Rockets Launch from Alaska During Solar Flare

Two NASA Sounding Rockets Launch from Alaska During Solar Flare

1 min read

Preparations for Next Moonwalk Simulations Underway (and Underwater)

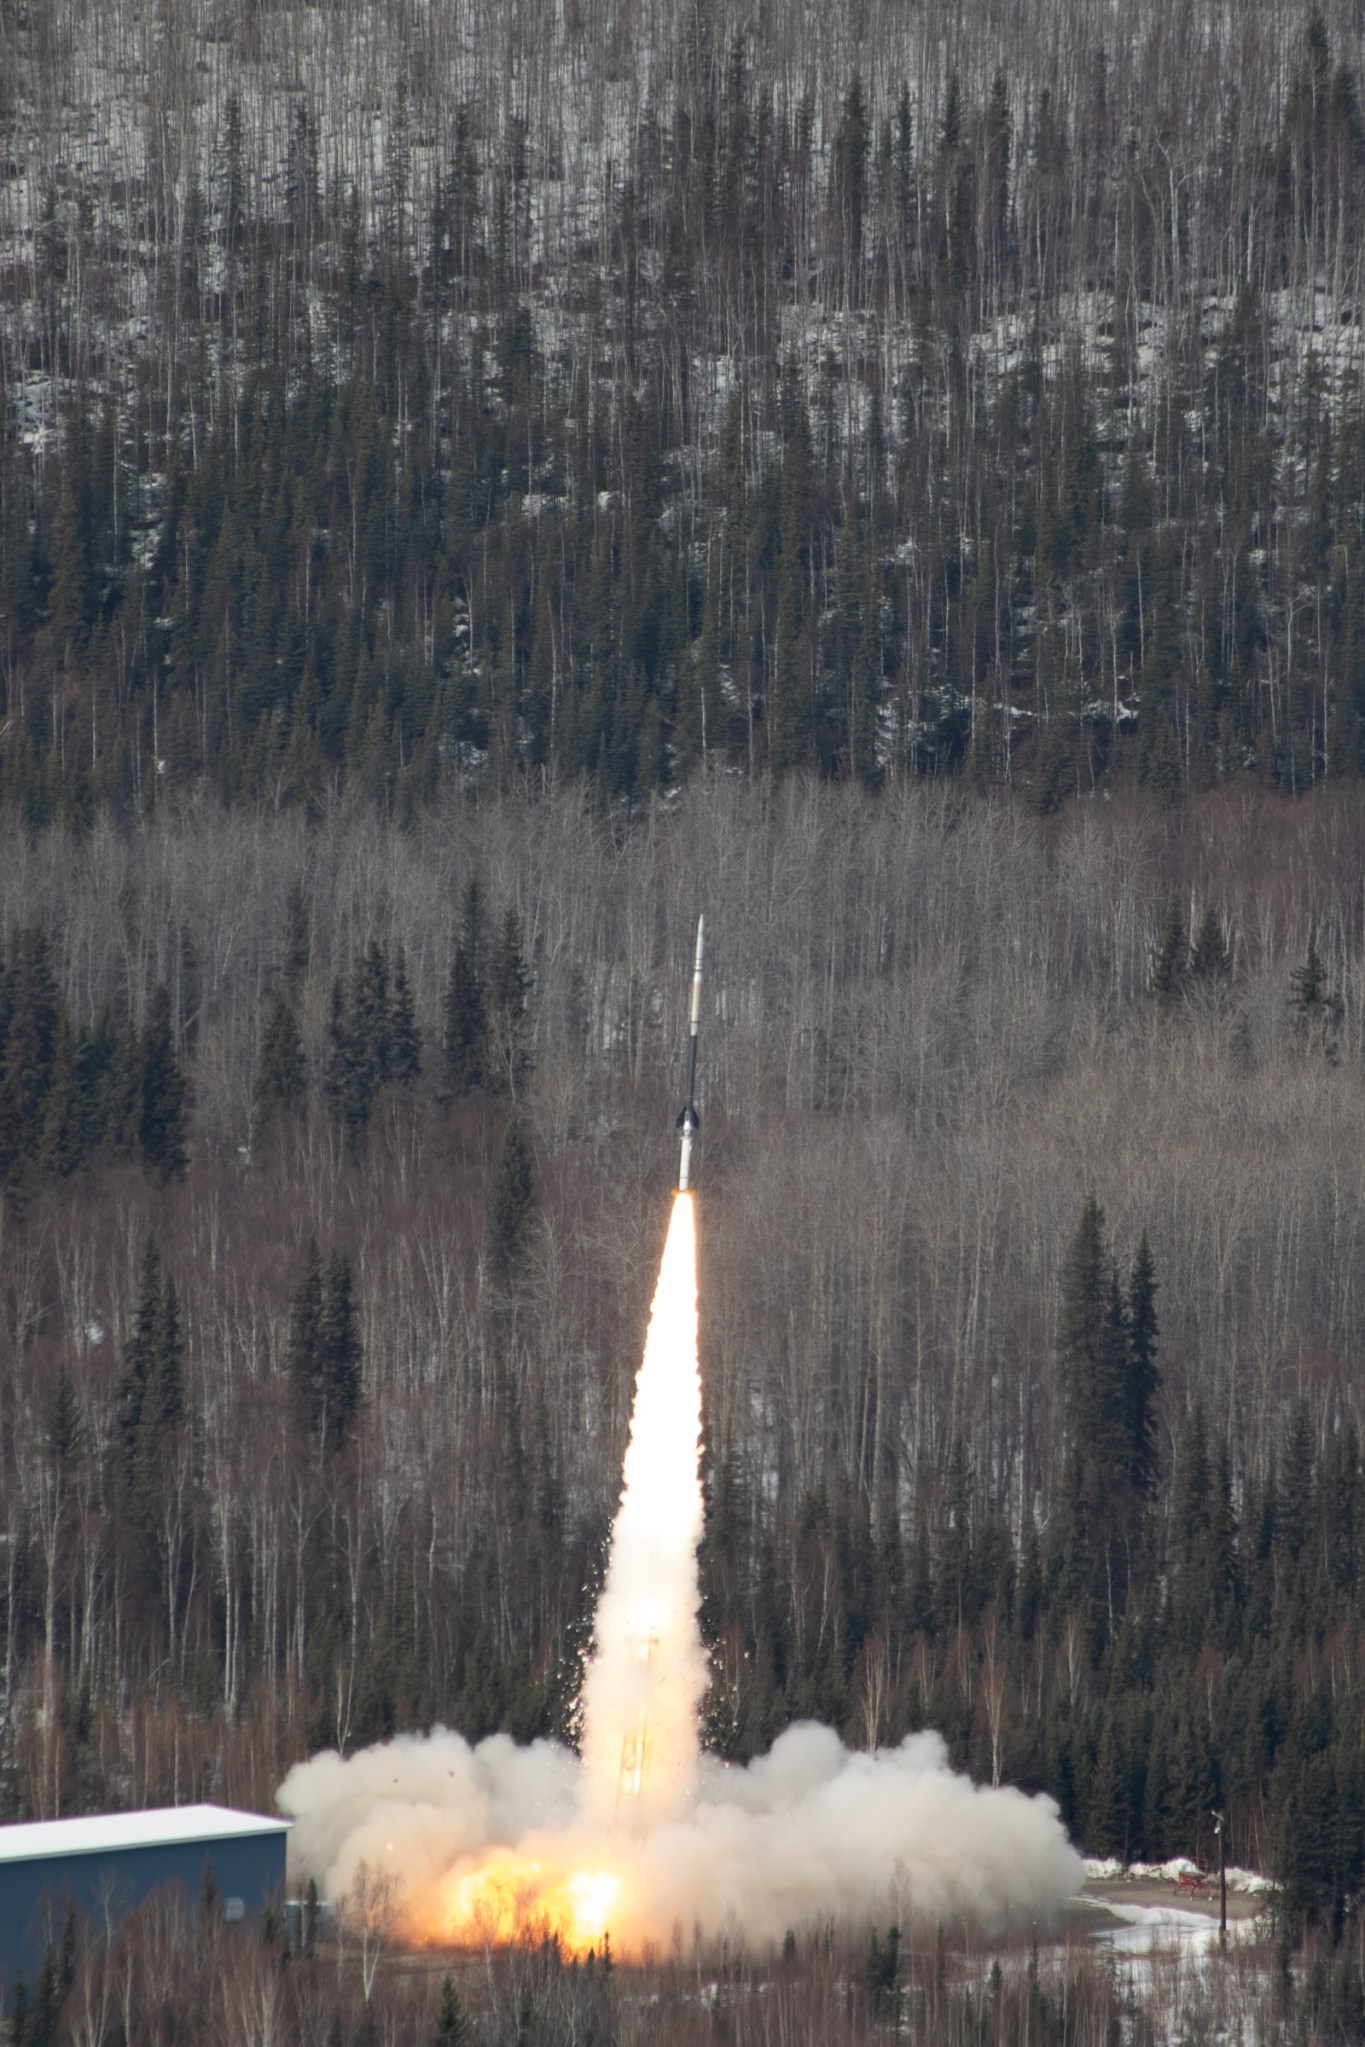
A sounding rocket just seconds after launch with a bright white plume of smoke trailing underneath against a muted snowy landscape.

Two Black Brant IX sounding rockets launched from Poker Flat Research Range in Fairbanks, Alaska, April 17, 2024, during an M-class solar flare for NASA’s sounding rocket solar flare campaign. The first rocket launched at 2:13 p.m. local Alaska time for the Focusing Optics X-ray Solar Imager (FOXSI) mission that used X-ray vision to observe the Sun during the solar flare event by focusing directly on high-energy X-rays. The second rocket launched at 2:14 p.m. for the High Resolution Coronal Imager, or Hi-C, mission designed to observe a large, active region in the Sun’s corona. The rockets reached altitudes up to 168 miles (271 km) and were able to successfully observe the solar flare.

Photo Credit: NASA/Lee Wingfield

Share

Details

Last Updated

Apr 18, 2024

Editor
Jamie Adkins
Contact

Powered by WPeMatico

Get The Details…
Jamie Adkins

Climate Change Research

Climate Change Research

6 Min Read

Climate Change Research

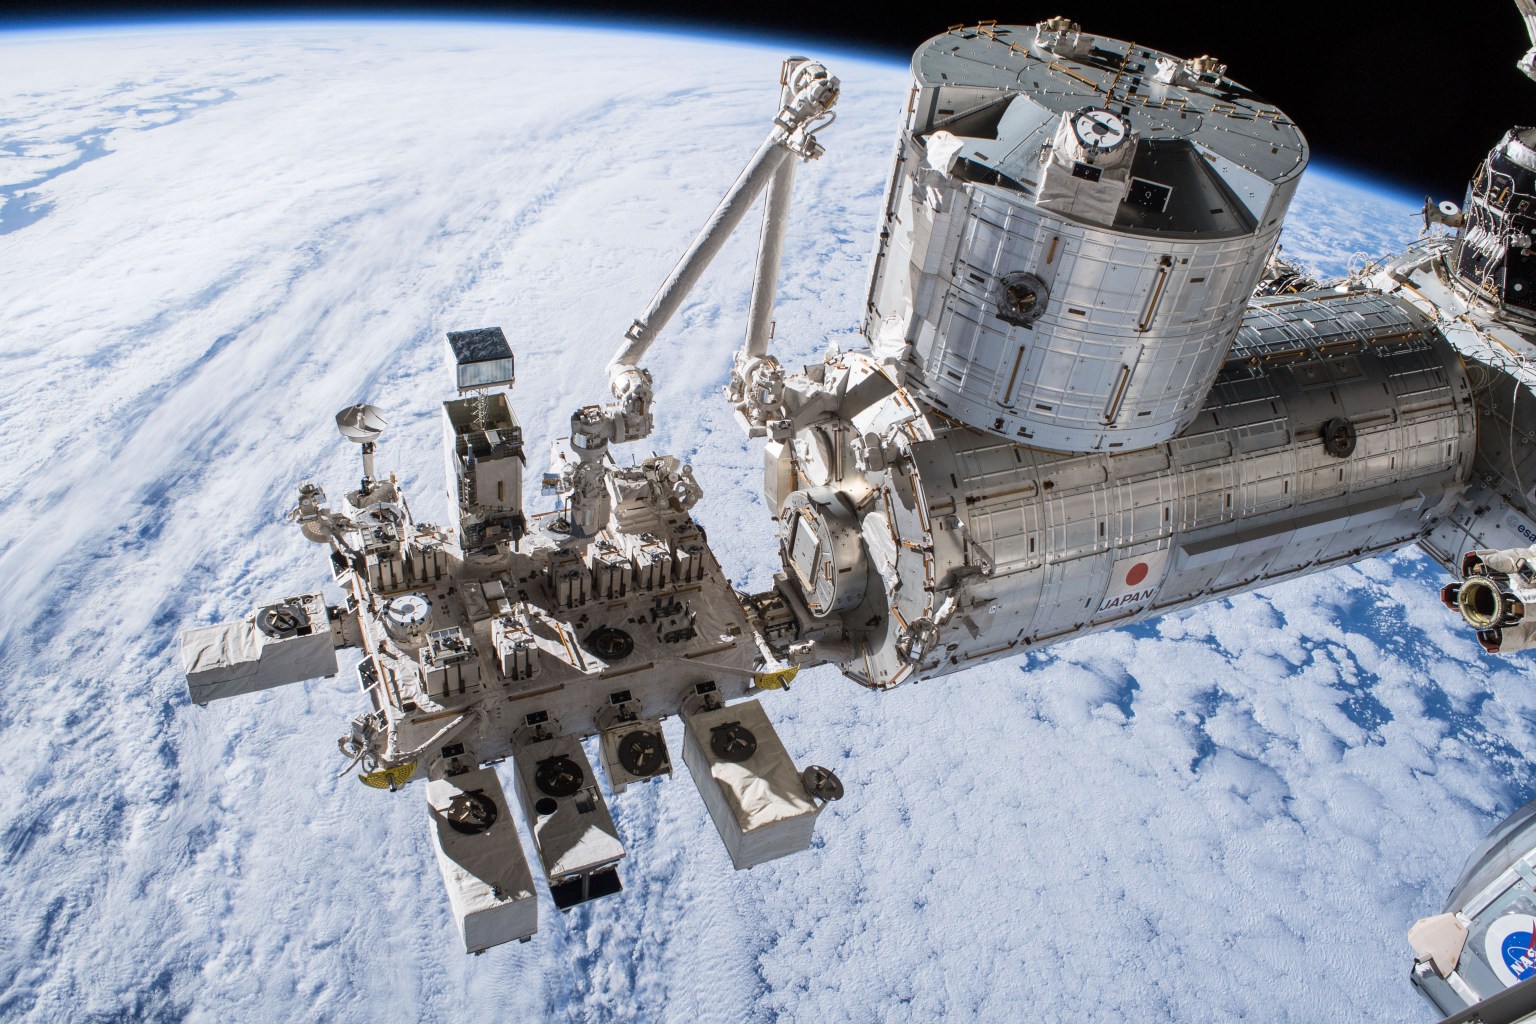
The Kibo laboratory module from the Japan Aerospace Exploration Agency (comprised of a pressurized module and exposed facility, a logistics module, a remote manipulator system and an inter-orbit communication system unit) was pictured as the International Space Station orbited over the southern Pacific Ocean east of New Zealand.

The Kibo laboratory module from the Japan Aerospace Exploration Agency (comprised of a pressurized module and exposed facility, a logistics module, a remote manipulator system and an inter-orbit communication system unit) pictured as the International Space Station orbits over the southern Pacific Ocean east of New Zealand.

Credits:
NASA

Science in Space: April 2024

Everyone on Earth is touched by the effects of climate change, such as hotter temperatures, shifts in rain patterns, and sea level rise. Collecting climate data helps communities better plan for these changes and build more resilience to them.

The International Space Station, one of dozens of NASA missions contributing to this effort, has multiple instruments collecting various types of climate-related data. Because the station’s orbit passes over 90 percent of Earth’s population and circles the planet 16 times each day, these instruments have views of multiple locations at different times of day and night. The data inform climate decisions and help scientists understand and solve the challenges created by climate change.

While crew members have little involvement in the ongoing operation of these instruments, they do play a critical role in unpacking hardware when it arrives at the space station and in assembling and installing the instruments via spacewalks or using the station’s robotic arm.

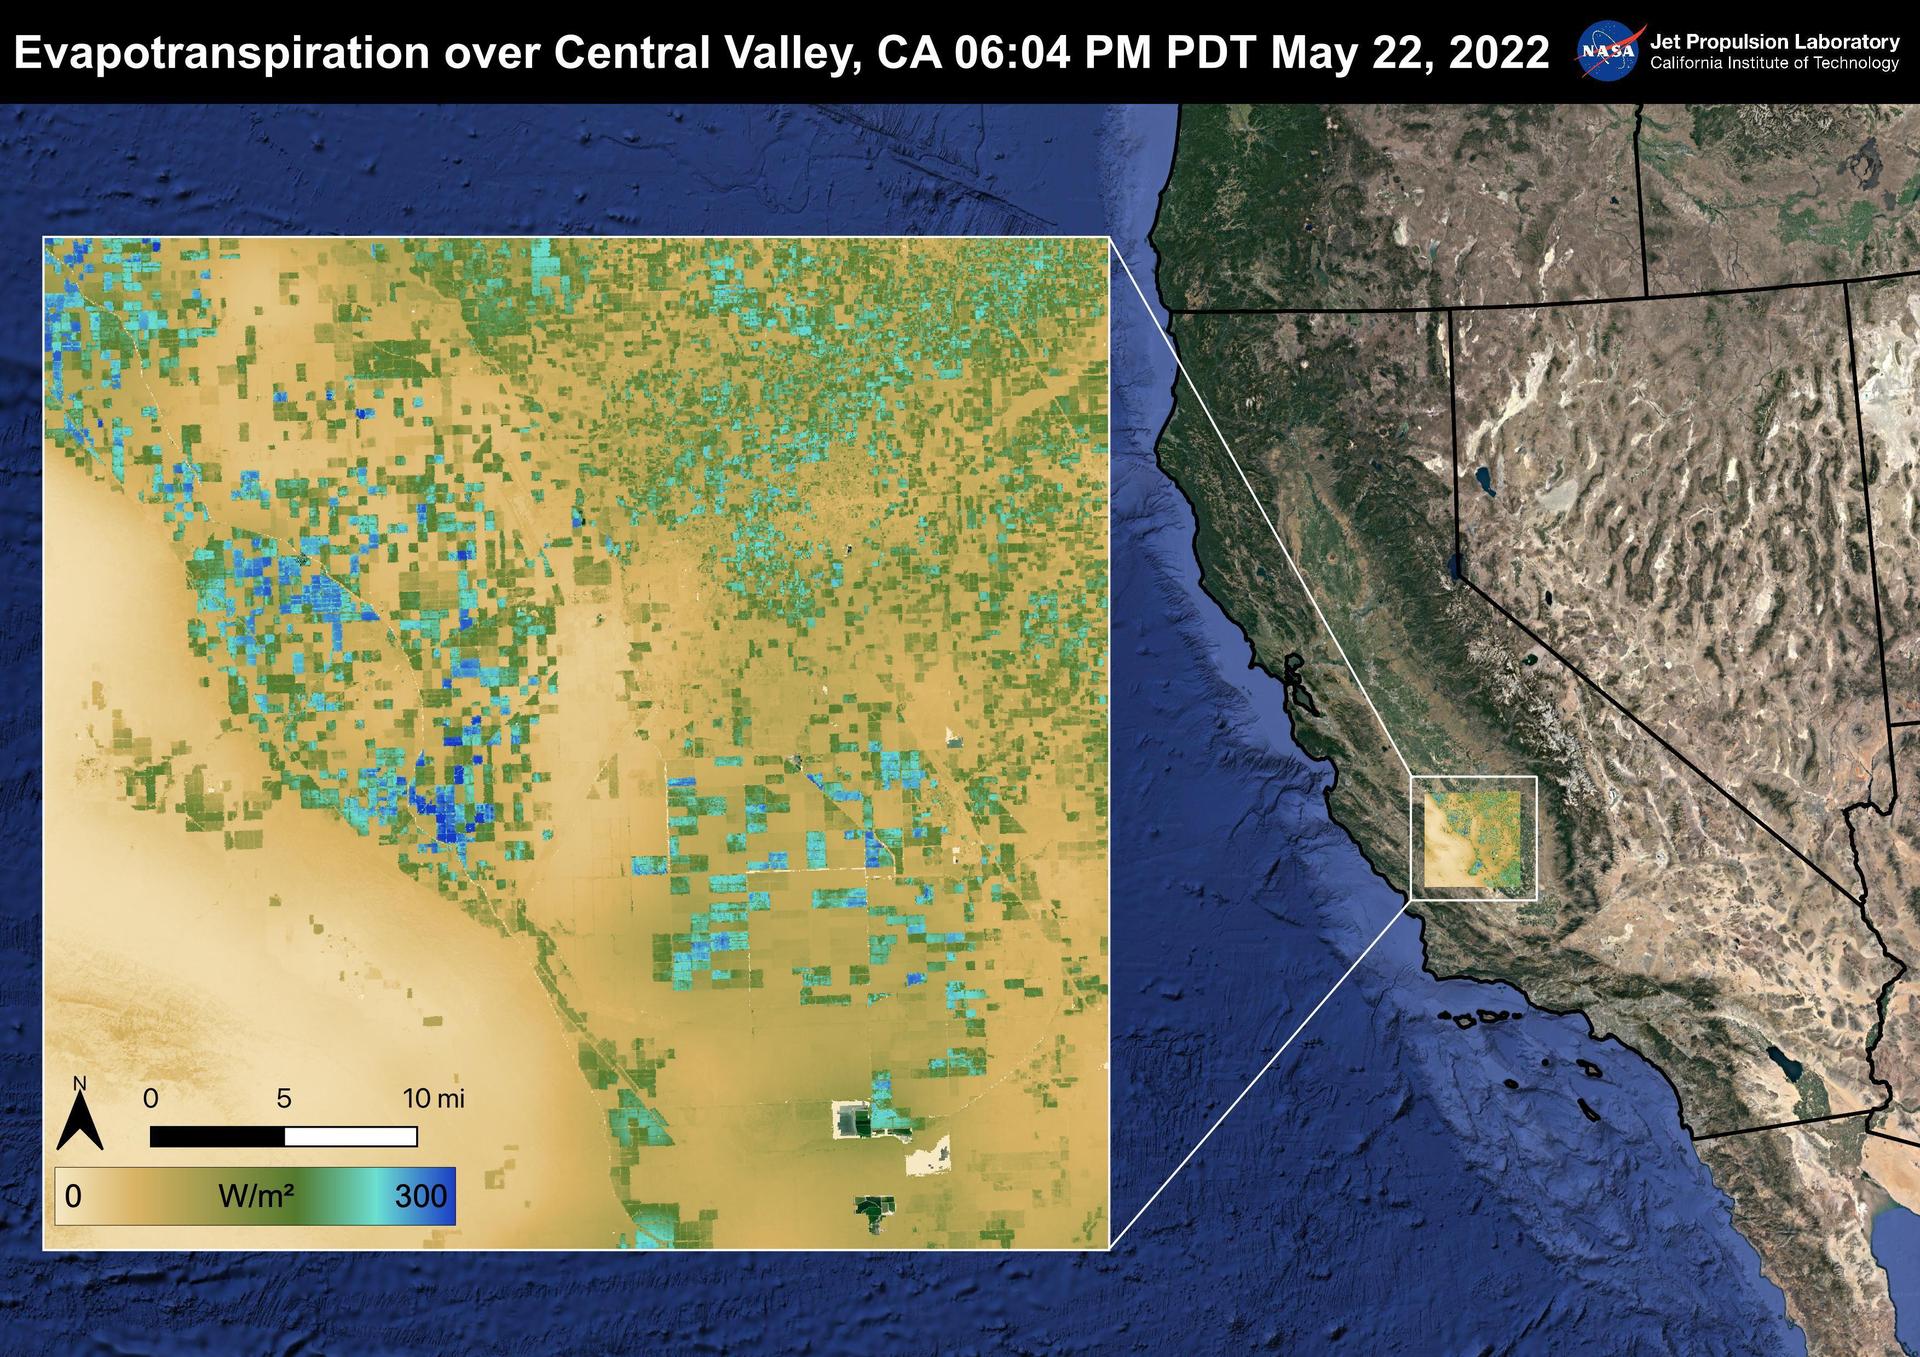
A topographic map of California is on the right side of this image. A pop-out box of the Central Valley has multiple tiny squares ranging from dark blue to light blue, green, and brown. The colors indicate the level of water use within the squares.
This ECOSTRESS evapotranspiration image of California’s Central Valley from May 22, 2022, shows high water use (blue) and dry conditions (brown).
NASA

One investigation on the orbiting lab that contributes to efforts to monitor and address climate change is ECOsystem Spaceborne Thermal Radiometer Experiment on Space Station (ECOSTRESS). It provides thermal infrared measurements of Earth’s surface that help answer questions about water stress in plants and how specific regions respond to climate change. Research confirmed the accuracy of ECOSTRESS surface estimates1 and found that the process of photosynthesis in plants begins to fail at 46.7 degrees C (114 degrees F).2 Average temperatures have increased 0.5 degrees C per decade in some tropical regions, and temperature extremes are becoming more pronounced. Rainforests are a primary producer of oxygen and, without sufficient mitigation of the effects of climate change, leaf temperatures in these tropical forests soon could approach this failure threshold.

The Total and Spectral Solar Irradiance Sensor (TSIS) measures total solar irradiance (TSI) and solar spectral irradiance (SSI). TSI is the total solar energy input to Earth and SSI measures the Sun’s energy in individual wavelengths. Energy from the Sun drives atmospheric and oceanic circulations on Earth, and knowing its magnitude and variability is essential to understanding Earth’s climate. Researchers verified the instrument’s performance and showed that it made more accurate measurements than previous instruments.3,4 TSIS maintains a continuity of nearly 40 years of data on solar irradiance from space-based observations.

This visualization blends US Forest Service plot locations (orange dots) with vegetation height data from GEDI (green) across the continental US. Credits: NASA

The Global Ecosystem Dynamics Investigation (GEDI) observes global forests and topography using light detection and ranging (lidar). These observations could provide insight into important carbon and water cycling processes, biodiversity, and habitat. One study used GEDI data to estimate pan-tropical and temperate biomass densities at the national level for every country observed and the sub-national level for the United States.5

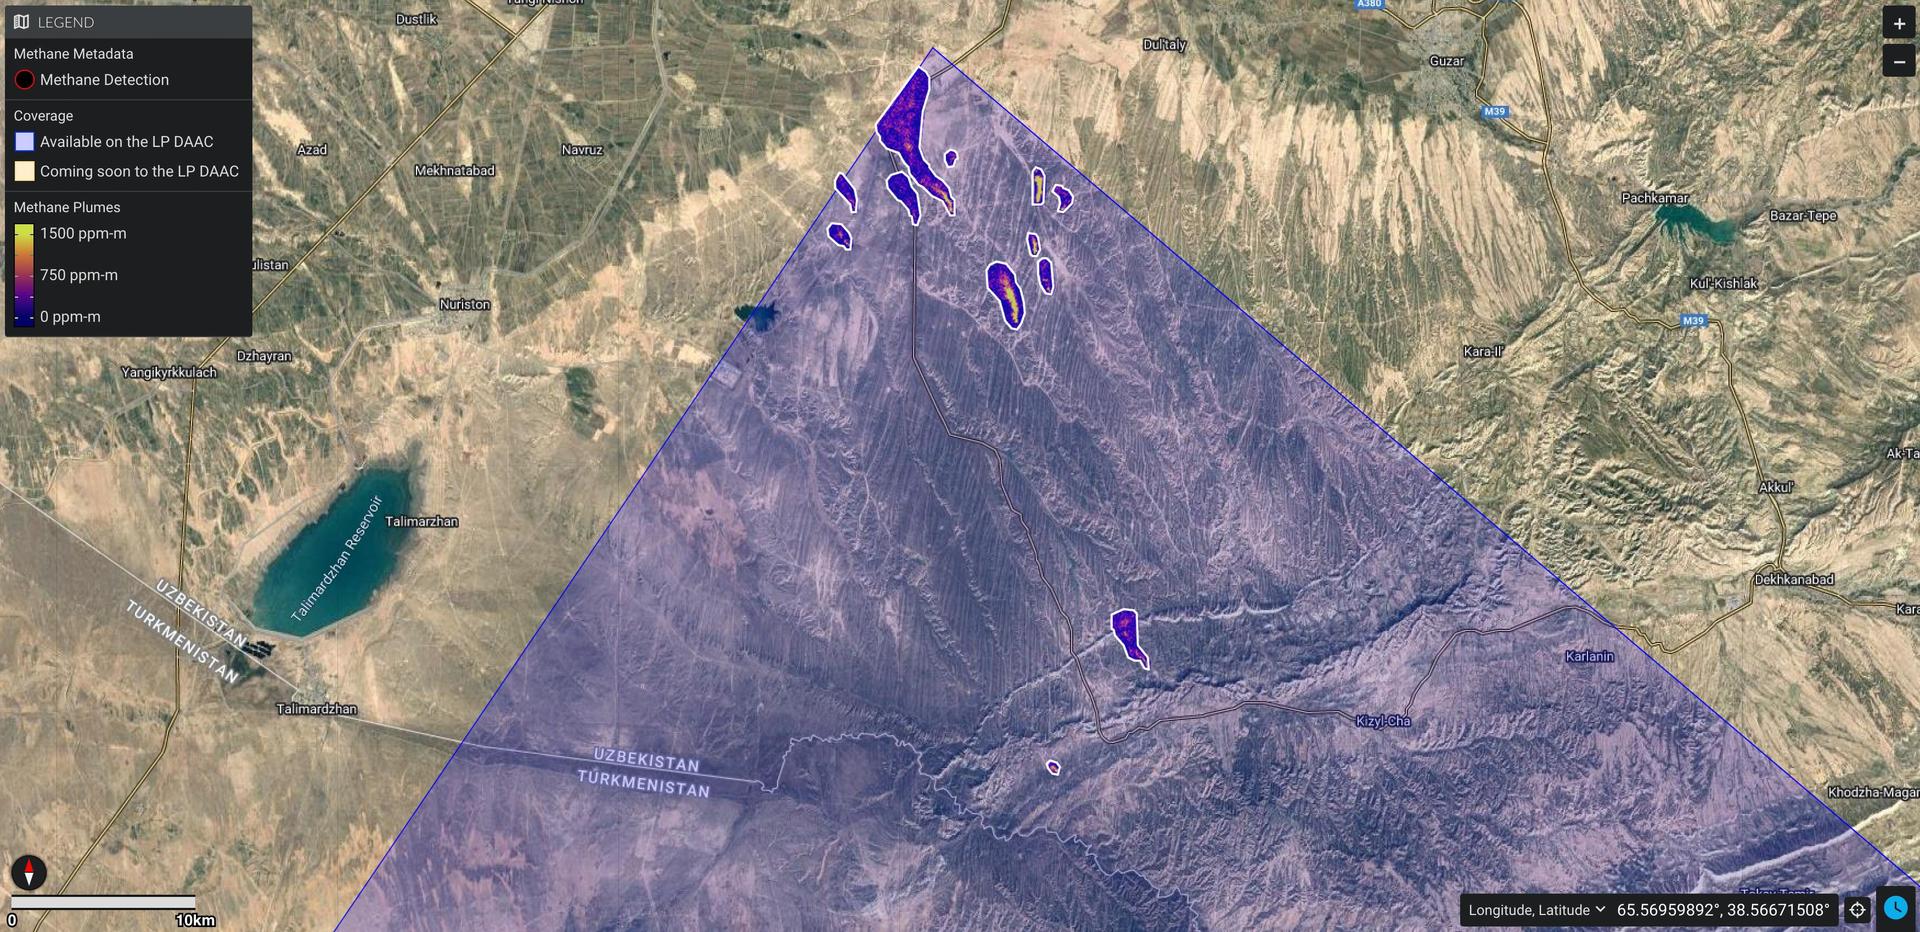
This image shows a large swath of land along the Uzbekistan/Turkmenistan border. A purple triangle covering the middle of the image is a 50-mile by 50-mile area captured by EMIT. There is one large purple plume near the bottom center and a cluster of plumes at the point of the triangle that are methane emissions.
A cluster of methane plumes detected by EMIT in 2022 in a region approximately 150 square miles in Uzbekistan. EMIT captured in an instant what might have taken 65 hours of flight time with an airborne instrument.
NASA

Earth Surface Mineral Dust Source Investigation (EMIT) determines the type and distribution of minerals in the dust of Earth’s arid regions using an imaging spectrometer. Mineral dust affects local warming and cooling, air quality, rate of snow melt, and ocean plankton growth. Researchers demonstrated that data from EMIT also can be used to identify and monitor specific sources of methane and carbon dioxide emissions. Carbon dioxide and methane are the primary human-caused drivers of climate change. Increasing emissions in areas with poor reporting requirements create significant uncertainty in the global carbon budget.6 The high spatial resolution of EMIT data could allow precise monitoring even of sources that are close together.

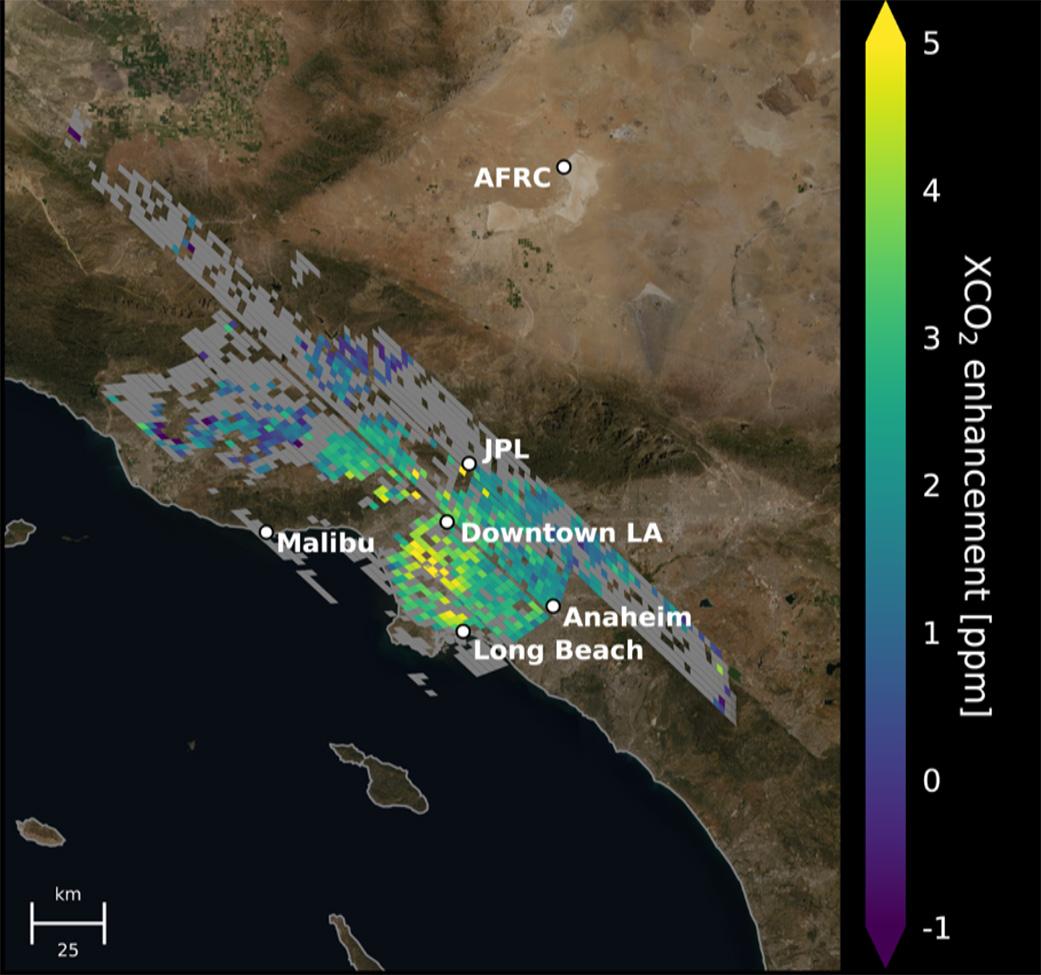
This image is a map with areas around Los Angeles labeled. It is covered in squares ranging in color from deep purple to yellow that indicate localized concentration of carbon dioxide.
This image accumulated data from OCO-3 to show carbon dioxide concentrations in Los Angeles.
NASA

The station’s Orbiting Carbon Observatory-3 (OCO-3) collects data on global carbon dioxide during sunlit hours, mapping emissions of targeted local hotspots. This type of satellite-based remote sensing helps assess and verify emission reductions included in national and global plans and agreements. Monitoring by OCO-3 and the Italian Space Agency’s PRecursore IperSpettrale della Missione Applicativa (PRISMA) satellite of 30 coal-fired power plants between 2021 and 2022 showed agreement with on-site observations.7 This result suggests that under the right conditions, satellites can provide reliable estimates of emissions from discreet sources. Combustion for power and other industrial uses account for an estimated 59% of global human-caused carbon dioxide emissions.

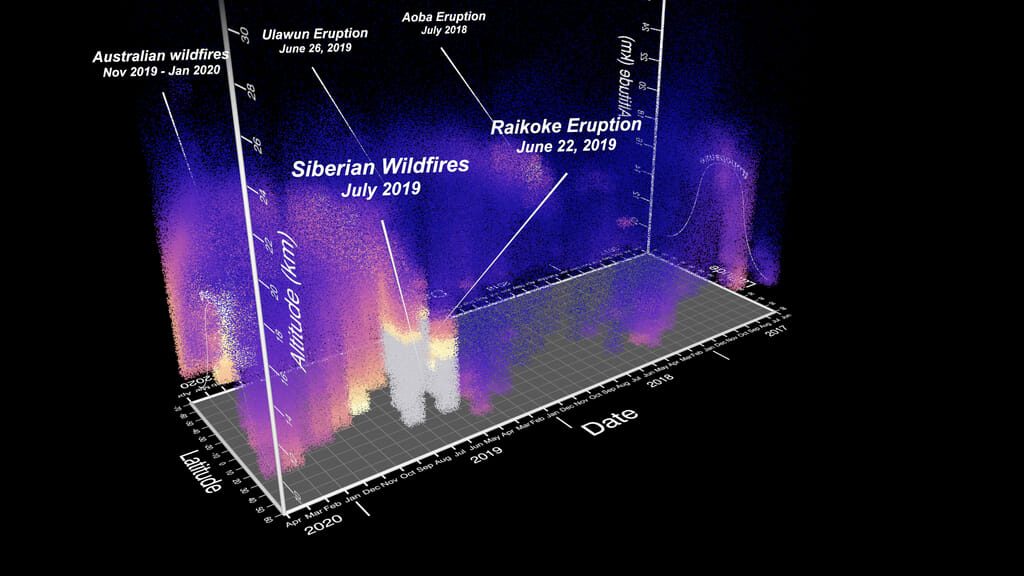
A three-dimensional graph includes latitude and date on the bottom axes and altitude from top to bottom. There are purple, blue, and gray spikes in the graph that indicate particles in the atmosphere from Australian wildfires in 2019-202, Siberian wildfires in 2019, two volcanic eruptions in 2019, and one eruption in 2018.
This image shows approximately three years of SAGE III aerosol data from across the globe, showing the effect of wildfires and volcanic eruptions on the atmosphere.
NASA

The Stratospheric Aerosol and Gas Experiment III-ISS (SAGE III-ISS) measures ozone and other gases and tiny particles in the atmosphere, called aerosols, that together act as Earth’s sunscreen. The instrument can distinguish between clouds and aerosols in the atmosphere. A study showed that aerosols dominate Earth’s tropical upper troposphere and lower stratosphere, a transition region between the two atmospheric levels. Continuous monitoring and identification of these layers of the atmosphere helps quantify their effect on Earth’s climate.8

An early remote sensing system, ISS SERVIR Environmental Research and Visualization System (ISERV), automatically took images of Earth to help scientists assess and monitor disasters and other significant events. Researchers reported that this type of Earth observation is critical for applications such as mapping land use and assessing carbon biomass and ocean health.9

John Love, ISS Research Planning Integration Scientist
Expedition 71

Search this database of scientific experiments to learn more about those mentioned above.

Citations:

1 Weidberg N, Lopez Chiquillo L, Roman S, Roman M, Vazquez E, et al. Assessing high resolution thermal monitoring of complex intertidal environments from space: The case of ECOSTRESS at Rias Baixas, NW Iberia. Remote Sensing Applications: Society and Environment. 2023 November; 32101055. DOI: 10.1016/j.rsase.2023.101055.

2 Doughty CE, Keany JM, Wiebe BC, Rey-Sanchez C, Carter KR, et al. Tropical forests are approaching critical temperature thresholds. Nature. 2023 August 23; 621105-111. DOI: 10.1038/s41586-023-06391-z.

3 Richard EC, Harber D, Coddington OM, Drake G, Rutkowski J, et al. SI-traceable spectral irradiance radiometric characterization and absolute calibration of the TSIS-1 Spectral Irradiance Monitor (SIM). Remote Sensing. 2020 January; 12(11): 1818. DOI: 10.3390/rs12111818.

4 Coddington OM, Richard EC, Harber D, Pilewskie P, Chance K, et al. The TSIS-1 hybrid solar reference spectrum. Geophysical Research Letters. 2021 April 26; 48(12): e2020GL091709. DOI: 10.1029/2020GL091709

5 Dubayah R, Armston J, Healey S, Bruening JM, Patterson PL, et al. GEDI launches a new era of biomass inference from space. Environmental Research Letters. 2022 August; 17(9): 095001. DOI: 10.1088/1748-9326/ac8694.

6 Thorpe A, Green RD, Thompson DR, Brodrick PG, Chapman DK, et al. Attribution of individual methane and carbon dioxide emission sources using EMIT observations from space. Science Advances. 2023 November 17; 9(46): eadh2391. DOI: 10.1126/sciadv.adh2391.

7 Cusworth DH, Thorpe A, Miller CE, Ayasse AK, Jiorle R, et al. Two years of satellite-based carbon dioxide emission quantification at the world’s largest coal-fired power plants. Atmospheric Chemistry and Physics. 2023 November 24; 23(22): 14577-14591. DOI: 10.5194/acp-23-14577-2023.

8 Bhatta S, Pandit AK, Loughman R, Vernier J. Three-wavelength approach for aerosol-cloud discrimination in the SAGE III/ISS aerosol extinction dataset. Applied Optics. 2023 May; 62(13): 3454-3466. DOI: 10.1364/AO.485466.

9 Kansakar P, Hossain F. A review of applications of satellite earth observation data for global societal benefit and stewardship of planet earth. Space Policy. 2016 May; 3646-54.

Powered by WPeMatico

Get The Details…
Ana Guzman

Hubble Goes Hunting for Small Main Belt Asteroids

Hubble Goes Hunting for Small Main Belt Asteroids

5 min read

Hubble Goes Hunting for Small Main Belt Asteroids

Like boulders, rocks, and pebbles scattered across a landscape, asteroids come in a wide range of sizes. Cataloging asteroids in space is tricky because they are faint and they don’t stop to be photographed as they zip along their orbits around the Sun.

Astronomers recently used a trove of archived images taken by NASA’s Hubble Space Telescope to visually snag a largely unseen population of smaller asteroids in their tracks. The treasure hunt required perusing 37,000 Hubble images spanning 19 years. The payoff was finding 1,701 asteroid trails, with 1,031 of the asteroids previously uncatalogued. About 400 of these uncatalogued asteroids are below 1 kilometer in size.

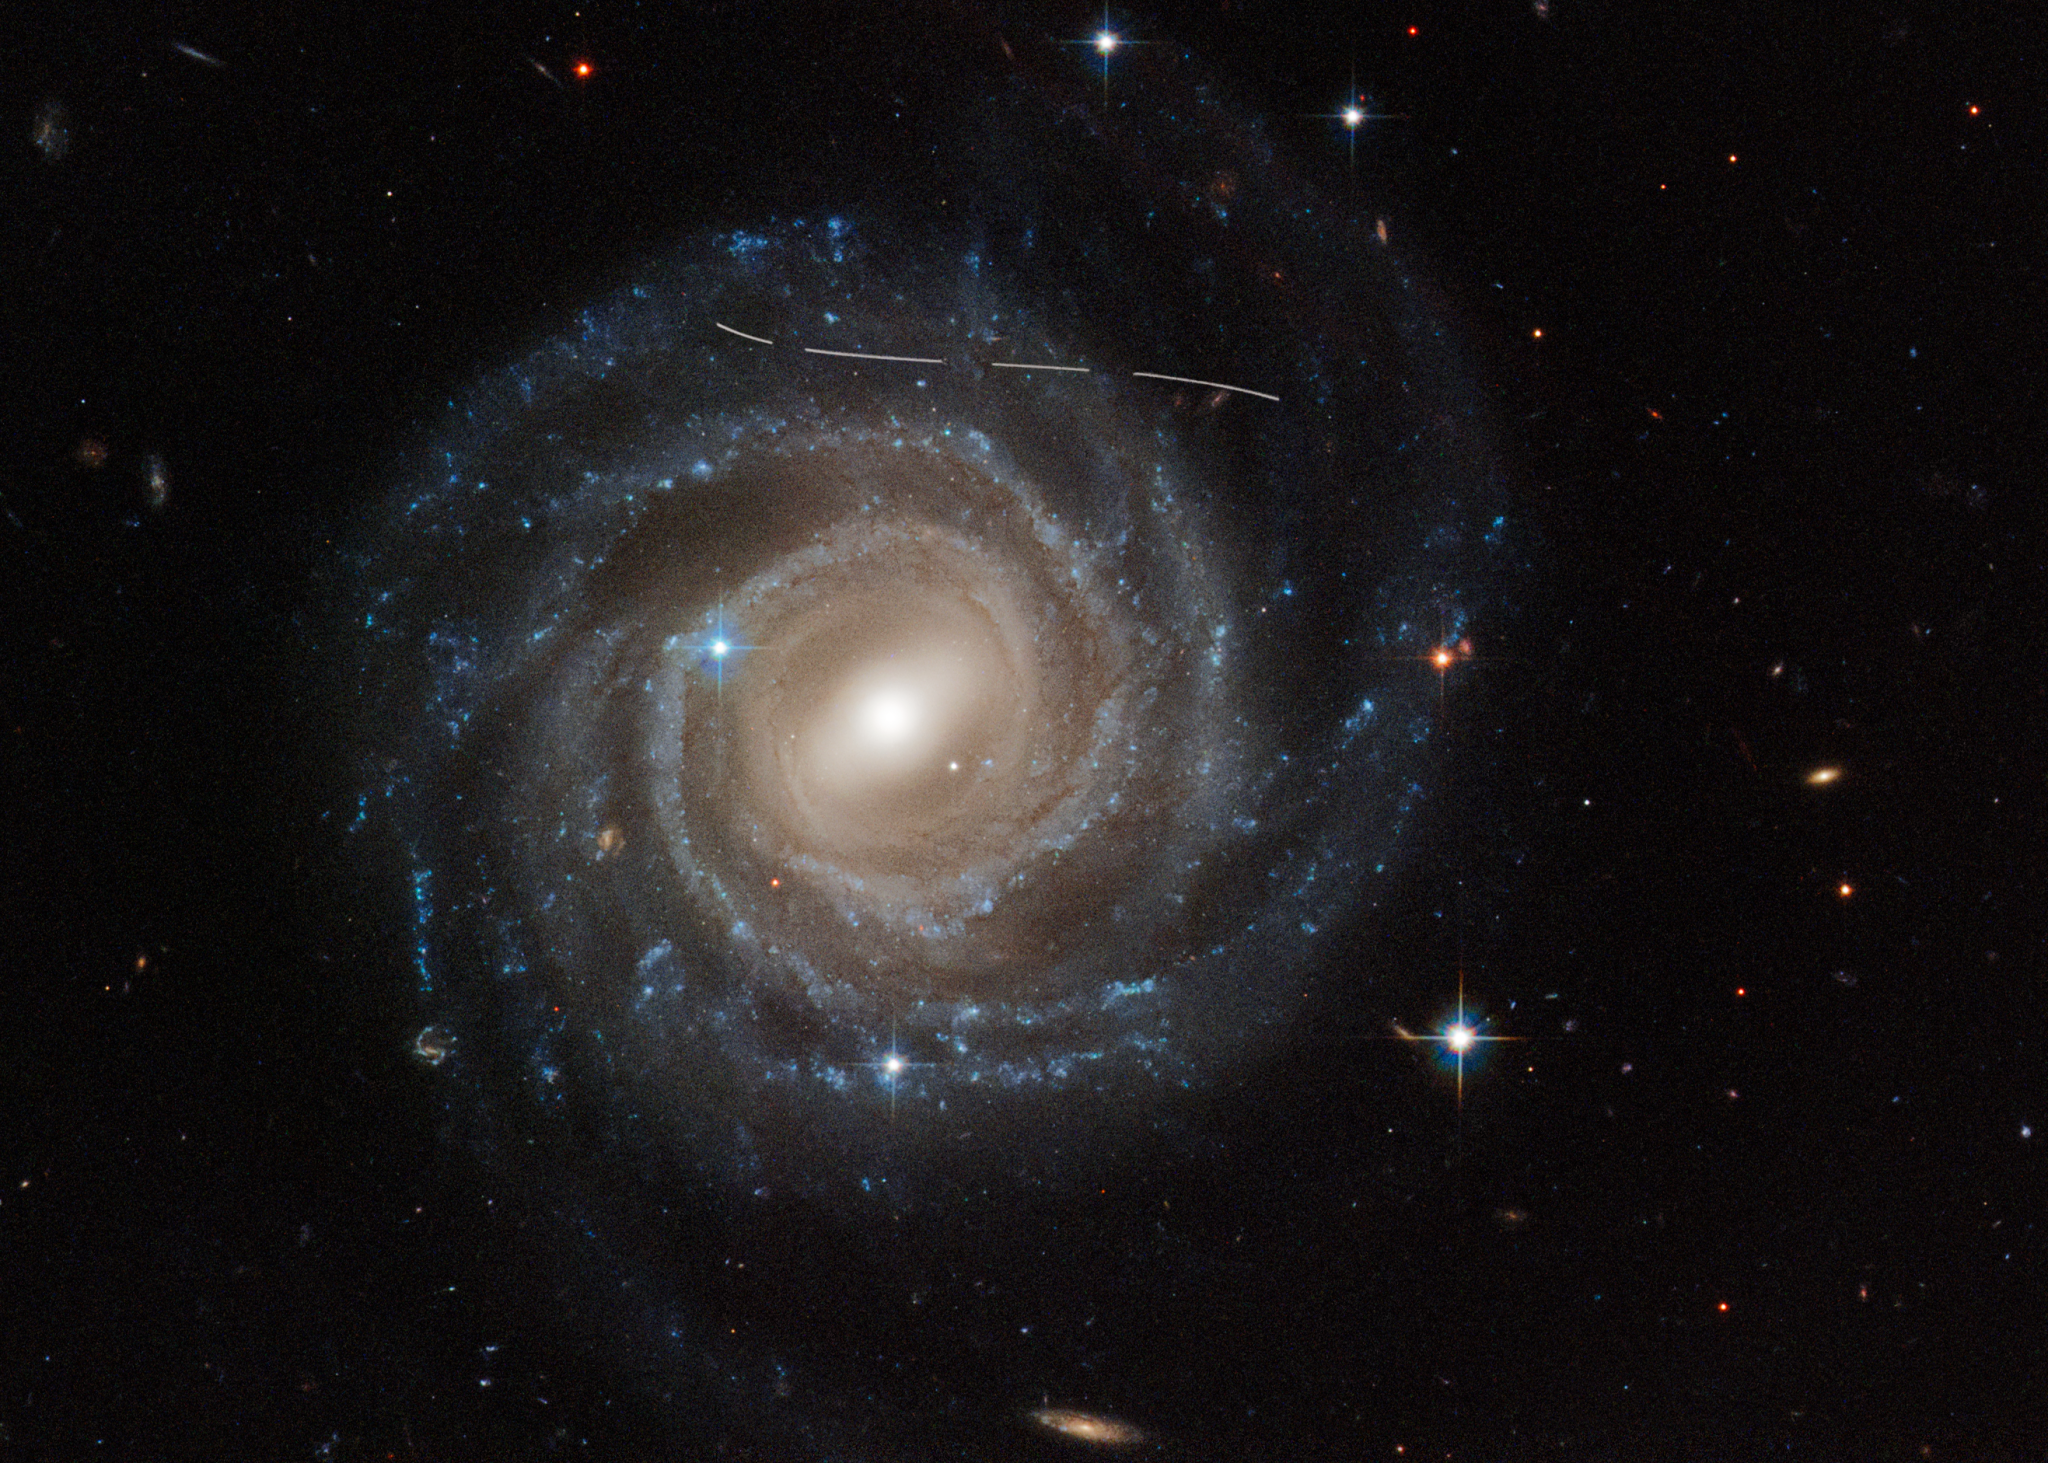
This is a Hubble Space Telescope image of the barred spiral galaxy UGC 12158. The majestic galaxy has a pinwheel shape made up of bright blue stars wound around a yellow-white hub of central stars. The hub has a slash of stars across it, called a bar. The galaxy is tilted face-on to our view from Earth. A slightly s-shaped white line across the top is a Hubble image is of an asteroid streaking across Hubble's view. It looks dashed because the image is a combination of several exposures of the asteroid flying by like a race car.
This Hubble Space Telescope image of the barred spiral galaxy UGC 12158 looks like someone took a white marking pen to it. In reality it is a combination of time exposures of a foreground asteroid moving through Hubble’s field-of-view, photobombing the observation of the galaxy. Several exposures of the galaxy were taken, what is evidence in the dashed pattern.

The asteroid appears as a curved trail due to parallax: because Hubble is not stationary, but orbiting Earth, and this gives the illusion that the faint asteroid is swimming along a curved trajectory. The uncharted asteroid is in inside the asteroid belt in our solar system, and hence is 10 trillion times closer to Hubble than the background galaxy.

Rather than a nuisance, this type of data are useful to astronomers for doing a census of the asteroid population in our solar system.

NASA, ESA, Pablo García Martín (UAM); Image Processing: Joseph DePasquale (STScI); Acknowledgment: Alex Filippenko (UC Berkeley)

Volunteers from around the world known as “citizen scientists” contributed to the identification of this asteroid bounty. Professional scientists combined the volunteers’ efforts with machine learning algorithm to identify the asteroids. It represents a new approach to finding asteroids in astronomical archives spanning decades, which may be effectively applied to other datasets, say the researchers.

“We are getting deeper into seeing the smaller population of main belt asteroids. We were surprised with seeing such a large number of candidate objects,” said lead author Pablo García Martín of the Autonomous University of Madrid, Spain. “There was some hint of this population existing, but now we are confirming it with a random asteroid population sample obtained using the whole Hubble archive. This is important for providing insights into the evolutionary models of our solar system.”

The large, random sample offers new insights into the formation and evolution of the asteroid belt. Finding a lot of small asteroids favors the idea that they are fragments of larger asteroids that have collided and broken apart, like smashed pottery. This is a grinding-down process spanning billions of years.

An alternative theory for the existence of smaller fragments is that they formed that way billions of years ago. But there is no conceivable mechanism that would keep them from snowballing up to larger sizes as they agglomerated dust from the planet-forming circumstellar disk around our Sun. “Collisions would have a certain signature that we can use to test the current main belt population,” said co-author Bruno Merín of the European Space Astronomy Centre, in Madrid, Spain .

Amateur Astronomers Teach AI to Find Asteroids

Because of Hubble’s fast orbit around the Earth, it can capture wandering asteroids through their telltale trails in the Hubble exposures. As viewed from an Earth-based telescope, an asteroid leaves a streak across the picture. Asteroids “photobomb” Hubble exposures by appearing as unmistakable, curved trails in Hubble photographs.

As Hubble moves around the Earth, it changes its point of view while observing an asteroid, which also moves along its own orbit. By knowing the position of Hubble during the observation and measuring the curvature of the streaks, scientists can determine the distances to the asteroids and estimate the shapes of their orbits.

The asteroids snagged mostly dwell in the main belt, which lies between the orbits of Mars and Jupiter. Their brightness is measured by Hubble’s sensitive cameras. And comparing their brightness to their distance allows for a size estimate. The faintest asteroids in the survey are roughly one forty-millionth the brightness of the faintest star that can be seen by the human eye.

“Asteroid positions change with time, and therefore you cannot find them just by entering coordinates, because at different times, they might not be there,” said Merín. “As astronomers we don’t have time to go looking through all the asteroid images. So we got the idea to collaborate with over 10,000 citizen-science volunteers to peruse the huge Hubble archives.”

In 2019 an international group of astronomers launched the Hubble Asteroid Hunter, a citizen-science project to identify asteroids in archival Hubble data. The initiative was developed by researchers and engineers at the European Science and Technology Centre (ESTEC) and the European Space Astronomy Centre’s science data center (ESDC), in collaboration with the Zooniverse platform, the world’s largest and most popular citizen-science platform, and Google.

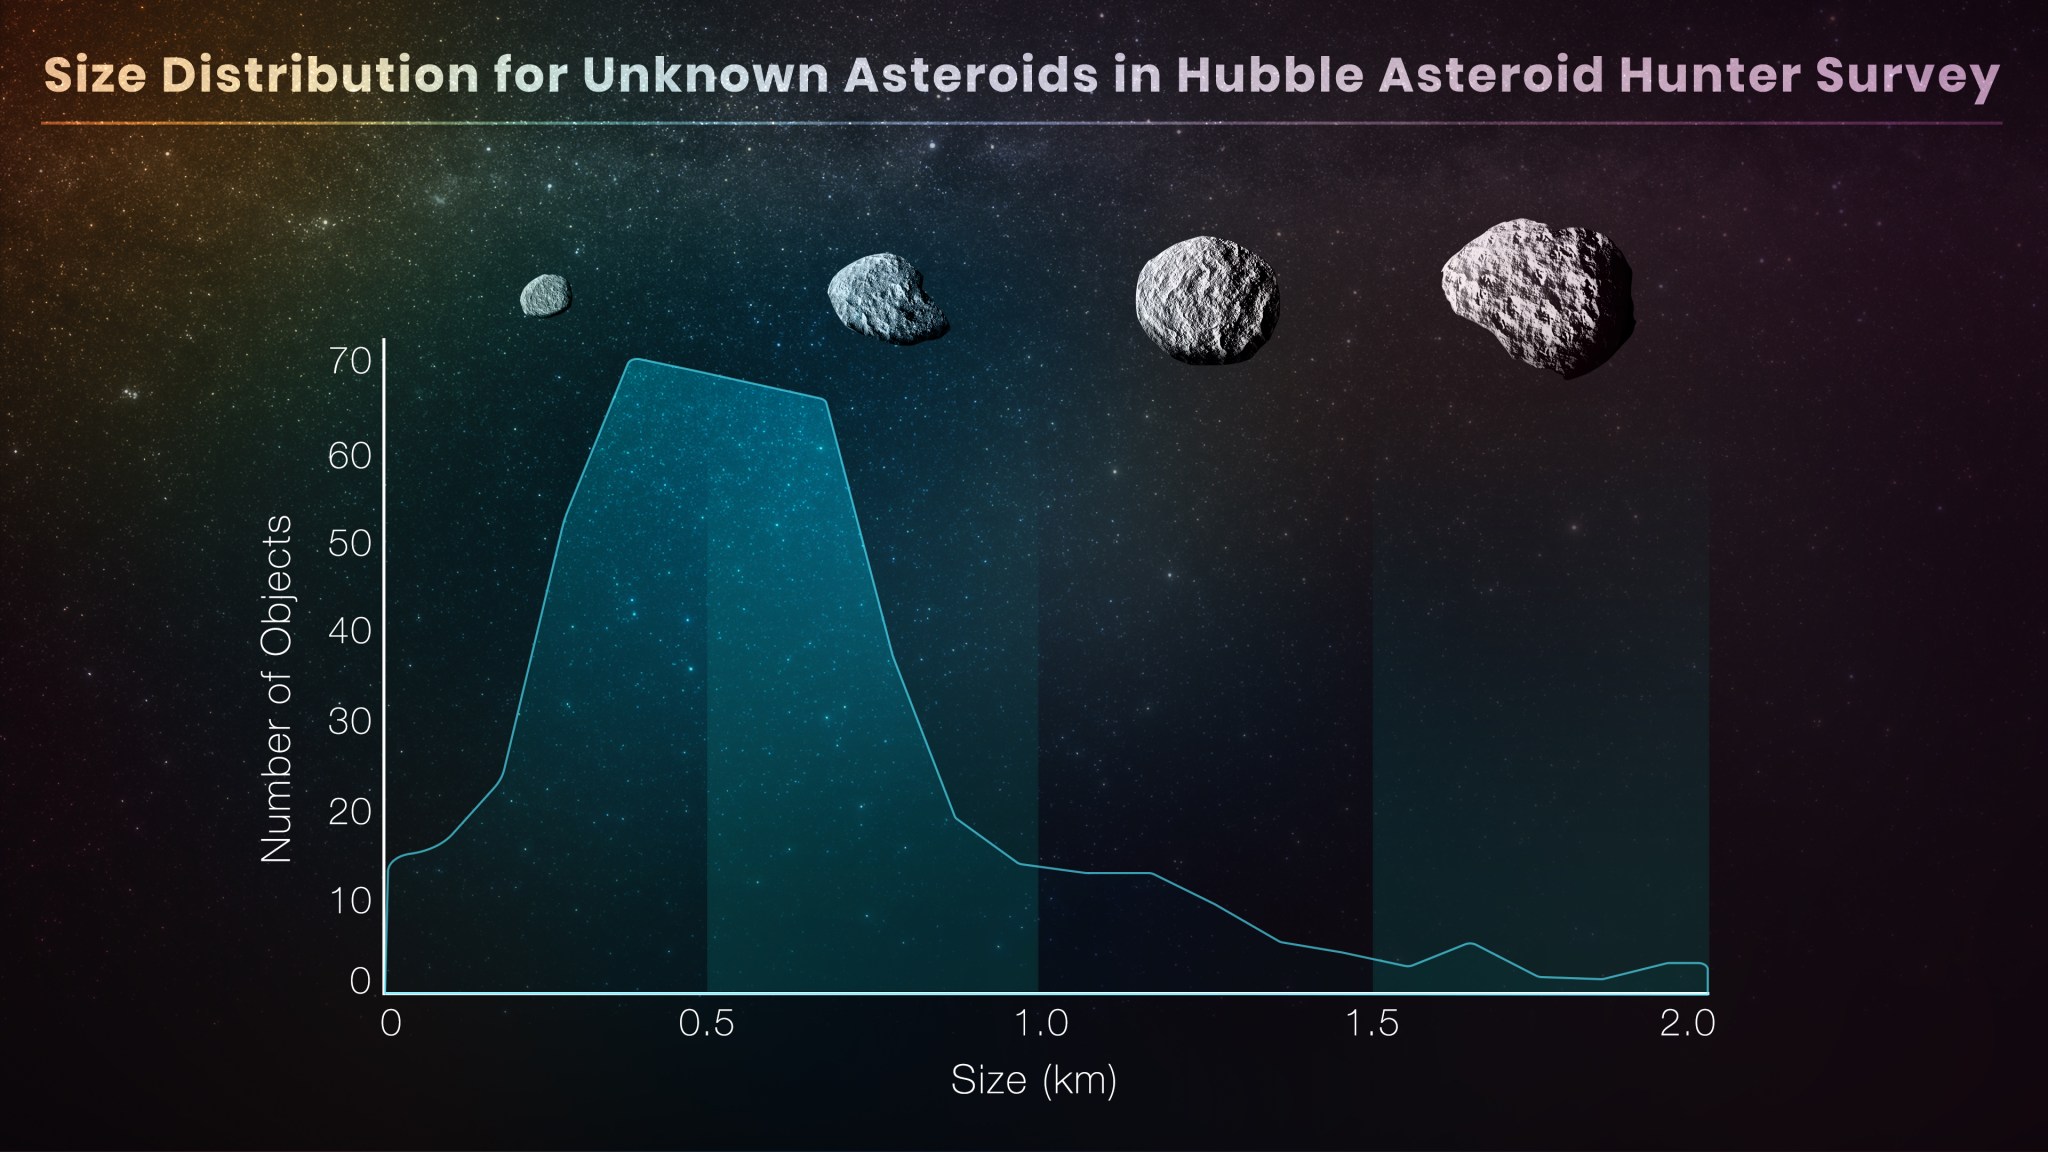
This graph plots the size of asteroids versus their abundance, based on a Hubble Space Telescope archival survey that found 1,701 mostly previously undetected asteroids lying between the orbits of Mars and Jupiter. The vertical axis lists number of objects from zero to 70. The horizontal axis lists size, from zero kilometers on the left, to 2 kilometers on the right. The graph slopes up such that the most abundant asteroids detected by Hubble in the survey are 0.5 kilometers across in size.
This graph is based on Hubble Space Telescope archival data that was used to identify a largely unseen population of very small asteroids in their tracks. The asteroids were not the intended targets, but instead photobombed background stars and galaxies in Hubble images. The comprehensive treasure hunt required perusing 37,000 Hubble images spanning 19 years. This was accomplished by using “citizen science” volunteers and artificial intelligence algorithms. The payoff was finding 1,701 asteroid trails of previously undetected asteroids.
Pablo García Martín (UAM), Elizabeth Wheatley (STScI)

A total of 11,482 citizen-science volunteers, who provided nearly 2 million identifications, were then given a training set for an automated algorithm to identify asteroids based on artificial intelligence. This pioneering approach may be effectively applied to other datasets.

The project will next explore the streaks of previously unknown asteroids to characterize their orbits and study their properties, such as rotation periods. Because most of these asteroid streaks were captured by Hubble many years ago, it is not possible to follow them up now to determine their orbits.

The findings are published in the journal Astronomy and Astrophysics.

To learn how you can participate in citizen science projects related to NASA, visit https://science.nasa.gov/citizen-science/. Participation is open to everyone around the world, not limited to U.S. citizens or residents.

The Hubble Space Telescope has been operating for over three decades and continues to make ground-breaking discoveries that shape our fundamental understanding of the universe. Hubble is a project of international cooperation between NASA and ESA (European Space Agency). NASA’s Goddard Space Flight Center in Greenbelt, Maryland, manages the telescope and mission operations. Lockheed Martin Space, based in Denver, Colorado, also supports mission operations at Goddard. The Space Telescope Science Institute (STScI) in Baltimore, Maryland, which is operated by the Association of Universities for Research in Astronomy, conducts Hubble science operations for NASA.

Learn More:

Media Contact:

Claire Andreoli
NASA’s Goddard Space Flight CenterGreenbelt, MD
claire.andreoli@nasa.gov

Ray Villard
Space Telescope Science Institute, Baltimore, MD

Science Contact:
Pablo García Martín
Autonomous University of Madrid, Madrid, Spain

Powered by WPeMatico

Get The Details…

OSDR hosts Blue Origin Erika Wagner

OSDR hosts Blue Origin Erika Wagner

Open Science Data Repository Team Hosts Blue Origin’s Dr Erika Wagner at the Meet the Expert Seminar Series Focused on Flight Integrators

Friday, March 29, 2024—The Open Science Data Repository hosted the sixth presentation showcasing flight integrators in the “Meet the Expert” series. This series is targeted for the Open Science Analysis Working Group (AWG) community to aide their space biology experiments. In this latest presentation, Dr Erika Wagner—a Senior Director of Emerging Market Development for Blue Origin—provided an introduction to Blue Origin, and how to participate in conducting microgravity research on their platforms. She also spoke a bit to her personal journey from biomedical engineering to aerospace. This meeting included a one-hour presentation that was attended by 26 AWG members followed by a networking social happy hour where AWG members continued to connect with the expert as well as each other.

Powered by WPeMatico

Get The Details…
Elizabeth E. Keller