NASA-Funded Study Shows Wildfire Smoke’s Hidden Ozone Toll

NASA-Funded Study Shows Wildfire Smoke’s Hidden Ozone Toll

5 Min Read

NASA-Funded Study Shows Wildfire Smoke’s Hidden Ozone Toll

Canadian wildfire smoke carried carbon monoxide — a building block of ground-level ozone — thousands of miles downwind in June 2023.
Credits:
NASA’s Goddard Space Flight Center

Wildfire smoke is stoking a new challenge for cleaner air. A NASA-supported study published Thursday found that, over the last decade, wildfires have worsened ground-level ozone pollution across much of the contiguous United States, creating unhealthy air far from active flames.

Wildfires have become an increasingly important contributor to ground-level ozone, or smog, across much of the United States, researchers report June 4 in the journal Science. Nationally, fires offset nearly four years’ worth of ozone-control gains, with larger setbacks in the West and Midwest.

Smoke often is associated with the soot, ash, and other fine particles that make the air look hazy. But wildfires also emit gases such as carbon monoxide, which can help form surface ozone in sunlight when other pollutants are present. Surface ozone is an invisible pollutant harmful to human health, plants, and crops. As smoke plumes travel and mix with other pollution, those reactions can drive ozone increases hundreds or even thousands of miles from active fires.

“NASA Earth observations, along with ground monitoring networks, help reveal air quality risks from wildfires that can cross state lines, giving air quality managers better decision-making information as wildfire smoke affects more communities,” said John Haynes, manager of NASA Earth Action’s Health and Air Quality program at the agency’s Headquarters in Washington. “This is a strong example of NASA science serving communities here in the U.S.”

Building a clearer ozone picture

High in the atmosphere, ozone shields Earth from harmful ultraviolet radiation. Near the ground, however, ozone can irritate lungs, worsen asthma and other respiratory diseases, and increase health risks for children, older adults, outdoor workers, and people with existing health conditions.

To track surface ozone changes, researchers turned to deep learning, a form of artificial intelligence that finds patterns across large datasets. They used it to build a first-of-its-kind dataset estimating daily surface ozone from 2003 to 2024 on a kilometer-by-kilometer grid — about 0.6 miles on each side — across the contiguous U.S. The work received support from NASA’s Health and Air Quality program and other NASA grants.

The scientists combined data from about 1,000 ground-based air quality stations with atmospheric model data, weather information, wildfire pollution data, and satellite-derived information, including products from the Visible Infrared Imaging Radiometer Suite (VIIRS) and the Moderate Resolution Imaging Spectroradiometer (MODIS) instruments.

Smoke from Canada’s 2023 wildfires spread across North America. Tan to deep red colors show smoke intensity, estimated from black carbon in NASA’s GEOS-FP model.
NASA’s Scientific Visualization Studio (SVS) and NASA’s Global Modeling Assimilation Office (GMAO)

Their analysis revealed two distinct periods. From 2003 to 2015, U.S. ground-level ozone generally declined as emissions of ozone-forming pollutants decreased. After 2015, however, those gains slowed or reversed in many places. By comparing estimated ozone levels with scenarios that removed wildfire influence, the researchers found that pollution from wildfires was a main factor in that shift.

Without the wildfire contribution, ground-level ozone in the Midwest, for example, would likely have continued to decline. Instead, wildfires erased about 5.3 years’ worth of ozone-control progress since 2015.

“People in the Midwest may think fires burning far away will not affect them,” said the study’s corresponding author Jun Wang, an atmospheric scientist at the University of Iowa in Iowa City. “But once wildfire pollution is in the air, it can move across regions. Pollution from one place can affect air quality in another.”

Measuring the health toll

The study also found that wildfire-driven ozone increased exposure to unhealthy air and likely contributed to premature deaths. Premature deaths associated with long-term wildfire-related ozone exposure in the U.S. increased by an estimated 318 deaths per year after 2013, with the post-2013 average 46% higher than in the previous decade. The researchers calculated premature deaths using average lifespan, ozone exposure estimates, and population density.

The 2023 Canadian wildfires showed how widely those risks can spread, with smoke-driven ozone increases stretching across the Midwest and into parts of the Northeast and South. Overall, from 2022 to 2024, wildfires exposed an additional 43 million people in the U.S. to conditions that did not meet current federal air quality standards for ozone, the researchers estimated.

Capturing that national picture is difficult from ground monitors alone. Ground monitors remain the backbone of U.S. air quality tracking, but they do not cover every community. NASA’s scientifically validated satellite observations and models help researchers and agencies see air quality patterns across states, regions, and fire seasons.

That broader air quality work includes newer missions such as TEMPO (Tropospheric Emissions: Monitoring of Pollution). Launched in 2023, TEMPO is NASA’s first mission to use a space-based spectrometer to provide hourly daytime measurements of air quality over North America. Its view is sharp enough to distinguish pollution patterns, including surface ozone, across areas only a few square miles wide, a major improvement over earlier satellites.

Together, these capabilities help researchers and agencies see smoke-related ozone patterns that might otherwise be harder to detect, especially in rural and remote areas.

The work also points toward a practical use of NASA science during fire season. Wang’s team has used NASA support to develop FireAQ, a decision-support system that brings satellite observations, model forecasts, and fire and aerosol products into weekly briefings with state and local air quality officials. The goal is to help officials see where smoke-related pollution may move next and give communities better information.

About the Author

Emily DeMarco

Emily DeMarco

Writer/Editor (IV), Earth Science Division

Share

Details

Last Updated
Jun 04, 2026
Contact
Emily DeMarco
Location
Goddard Space Flight Center

Powered by WPeMatico

Get The Details…

Colorful, Chaotic Jupiter

Colorful, Chaotic Jupiter

Three quarters of Jupiter can be seen in this photo; the darkness of space covers the bottom of the image. Green and blue swirls cover the planet's surface.
NASA/JPL-Caltech/SwRI/MSSS; Image processing by Gary Eason © CC BY

NASA’s Juno spacecraft captured this color-enhanced view of Jupiter’s northern hemisphere during its 61st close flyby of the giant planet on May 12, 2024.

Citizen scientist Gary Eason made this image using raw data from the JunoCam instrument, applying digital processing techniques to enhance color and clarity. It provides a detailed view of chaotic clouds and cyclonic storms in an area known to scientists as a folded filamentary region. In these regions, the zonal jets that create the familiar banded patterns in Jupiter’s clouds break down, leading to turbulent patterns and cloud structures that rapidly evolve over the course of only a few days.

Learn more about opportunities to do NASA science with citizen science projects.

Image credit: NASA/JPL-Caltech/SwRI/MSSS; Image processing by Gary Eason © CC BY

Powered by WPeMatico

Get The Details…
HQ Web Team

A Moonlit Earth as Seen From Artemis II

A Moonlit Earth as Seen From Artemis II

Earth’s full disk is seen through the window of a spacecraft. The glow of aurora, a sliver of the Sun, and fuzzy zodiacal light surround the planet, and city lights are visible on the continents.
April 2, 2026

One of the first images transmitted back to Earth from the Artemis II mission was a stunner. In a single image, Earth’s full disk appears amid celestial phenomena that illustrate its place in the solar system. And although the visible hemisphere appears to be awash in sunlight, it is actually lit by moonlight. The astronauts’ vantage point provided a rare opportunity to capture nighttime features—most notably lights from human habitation—from a new perspective.

An Artemis crew member captured the photo from the Orion spacecraft after it completed the translunar injection burn, which sent the spacecraft out of Earth orbit and on a trajectory toward the Moon. In the photo, Earth eclipses the Sun from Orion’s perspective, leaving only a small sliver of its bright light visible around the bottom right edge. Green auroras, caused by charged particles from the Sun interacting with Earth’s upper atmosphere, glow around the north and south poles (lower left and upper right, respectively).

The Sun’s light also produces the fuzzy glow, known as zodiacal light, that appears to the lower right of Earth. This phenomenon comes from sunlight reflecting off interplanetary dust. Skywatchers on Earth may see it at certain times of year around dawn or dusk as a faint column of light extending up from the horizon. Data collected by NASA’s Juno spacecraft on its journey to Jupiter suggest that Mars may be a significant source of the dust particles that produce zodiacal light. Earth’s other planetary neighbor, Venus, appears as the bright object in the bottom right of the image.

Earth’s full disk is seen through the window of a spacecraft. Various features are labeled. The glow of aurora, a sliver of the Sun, and fuzzy zodiacal light surround the planet, and city lights are visible on the continents.
April 2, 2026

On Earth itself, city lights are evidence of human activity. Bright areas appear in Spain, Portugal, and northern Africa (lower left), sub-Saharan Africa (center left), and Brazil (center right). Digital camera technology—with help from the illumination of a full Moon—made it possible to see these and other details of Earth’s surface and atmosphere in low light. The crew set the camera’s ISO to 51,200 to make it highly sensitive to light. For comparison, an ISO setting of 100 or 200 is common for daytime photography.

Previous nighttime views of Earth taken from spacecraft may look very different from this photo but have also inspired and enlightened. For instance, the Apollo 12 crew photographed Earth eclipsing the Sun in 1969; astronaut Alan Bean would go on to depict his impressions of the event in paintings.

More recently, astronauts aboard the International Space Station have photographed the planet at night from low Earth orbit, while NASA’s Black Marble nighttime lights product suite uses satellite observations to produce science-quality records of nighttime lights at daily, monthly, and yearly time scales. Those programs provide sustained data records, while the Artemis II photo is distinctive as a single human-captured full-disk view showing many low-light features at once.

Cindy Evans, senior exploration scientist in the Astromaterials Research and Exploration Science Division at NASA’s Johnson Space Center, was working in the Science Evaluation Room during the Artemis II mission and was one of the first people on Earth to see the image. Evans was struck both by its beauty and the perspective revealed by all the visible solar system features. “I love the image so much because it was taken with Earth in moonshine, and shows Earth as a solar system body, a dynamic planet interacting with the solar wind, and a place harboring life,” she said.

The image is scientifically valuable, as well, said Miguel Román, Deputy Director for Atmospheres and Data Systems at NASA’s Goddard Space Flight Center. “It speaks powerfully to the breadth of what NASA does across science and human exploration,” he said. Román studies artificial light at night, as viewed from space, as a measurable signal of human activity.

“[This photo] reminds us that Earth at night is visually compelling, physically complex, and scientifically underexplored,” Román said. “I see this image as a glimpse of what Earth science can become in the future.”

NASA images prepared for Earth Observatory by Lauren Dauphin. Story by Lindsey Doermann.

References & Resources

You may also be interested in:

Stay up-to-date with the latest content from NASA as we explore the universe and discover more about our home planet.

Great Balls of Fire

4 min read

An astronaut on the International Space Station was surprised to photograph a shower of light streaking through the darkness while…

Article

Earthset From the Lunar Far Side

2 min read

The crew of NASA’s Artemis II mission captured extraordinary images of our home planet during their journey around the far…

Article

Shades of a Lunar Eclipse

3 min read

A series of nighttime satellite images revealed how moonlight reaching Earth varied throughout a total lunar eclipse.

Article

Powered by WPeMatico

Get The Details…

Curiosity Blog, Sols 4908-4912: Goodbye Campo Marte, It’s Been Fun!

Curiosity Blog, Sols 4908-4912: Goodbye Campo Marte, It’s Been Fun!

5 min read

Curiosity Blog, Sols 4908-4912: Goodbye Campo Marte, It’s Been Fun!

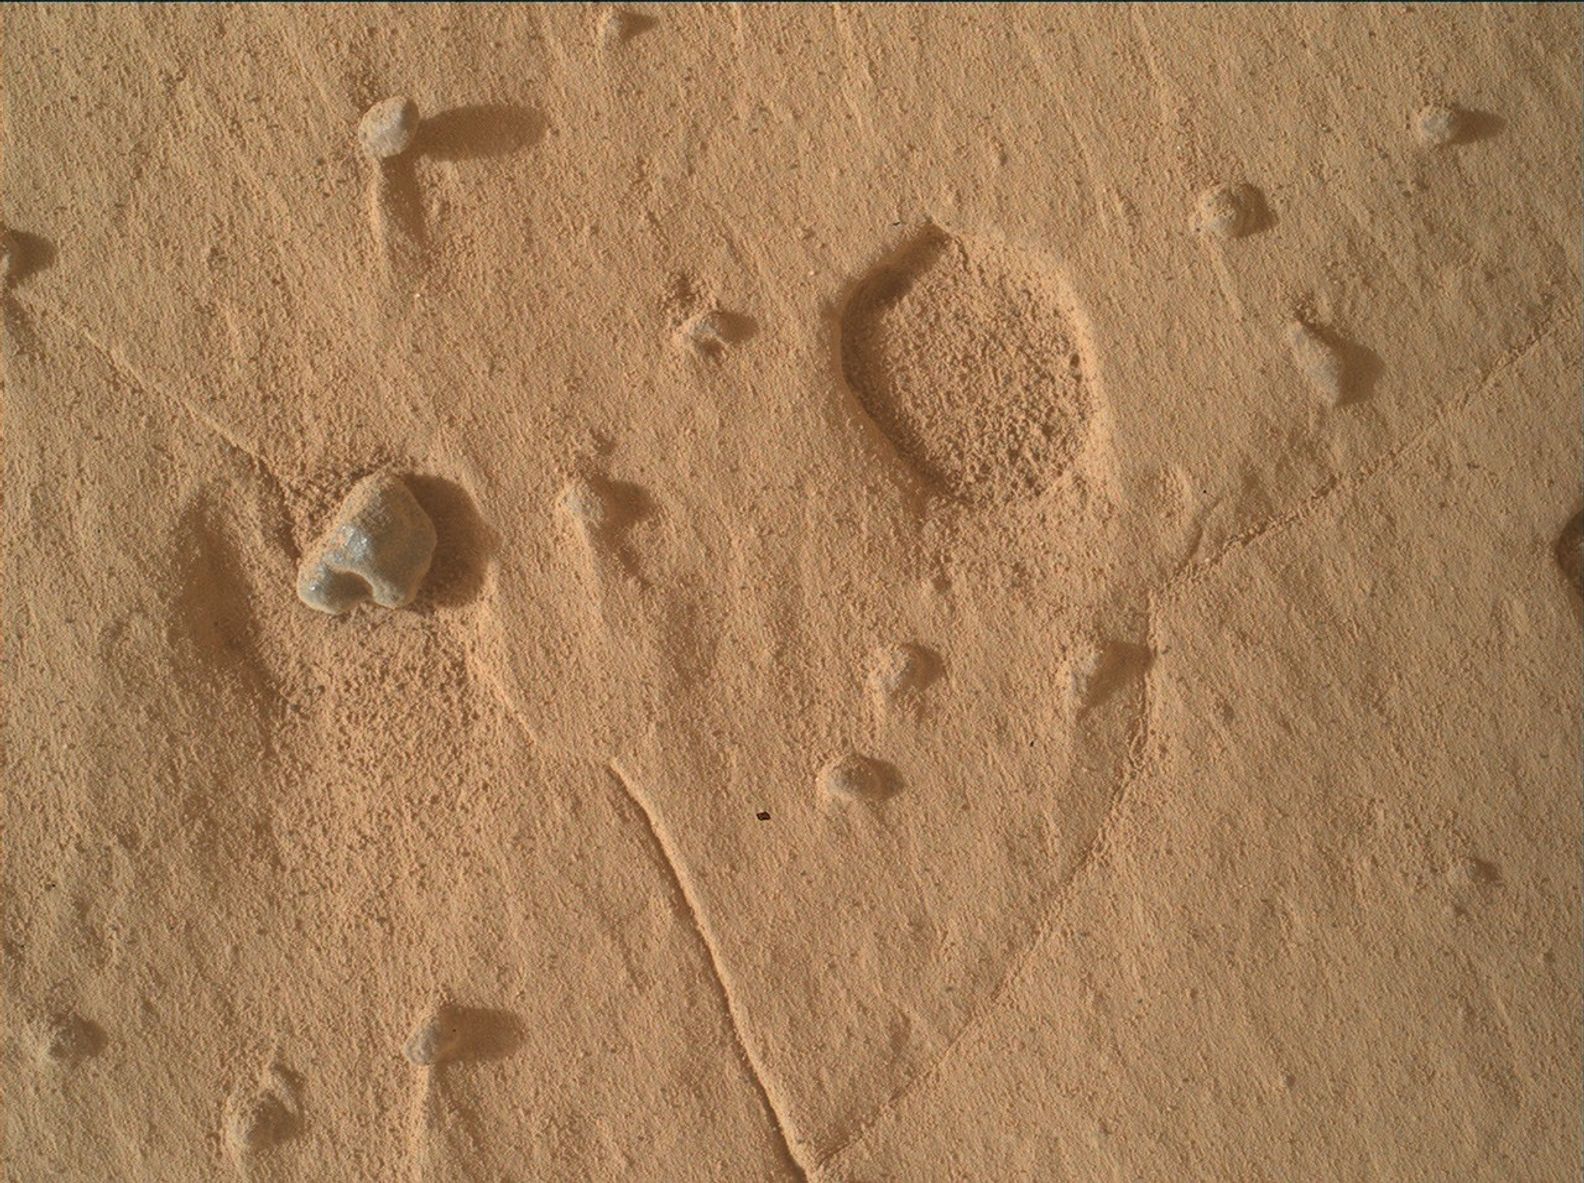
A tight close-up view looking down into a circular instrument opening on the Curiosity Mars rover. The interior features a gold-toned, smooth metallic funnel that slopes inward, ending in a fine, woven silver-colored wire mesh screen with a regular square grid pattern. Bright, radial light reflections streak down the inner walls of the funnel toward the center. Resting on the surface of the mesh screen are a few tiny dark specks and one small, light-colored, irregularly shaped grain of material.
NASA’s Mars rover Curiosity acquired this image of the inlet on its Chemistry & Mineralogy X-Ray Diffraction instrument (CheMin), which is about the size of a laptop computer and sits inside rover’s body, where it analyzes the chemical composition of rocks and soil. Curiosity captured the image using its Mars Hand Lens Imager (MAHLI), a close-up camera located on the turret at the end of the rover’s robotic arm, on May 28, 2026 — Sol 4908, or Martian day 4,908 of the Mars Science Laboratory Mission — at 11:14:14 UTC.
NASA/JPL-Caltech/MSSS

By Susanne P. Schwenzer, Professor of Planetary Mineralogy at The Open University, UK

Earth planning date: Friday, May 29, 2026

Drilling always keeps the rover in place for a little while, and our 47th successful drill, “Campo Marte,” was no exception. The team used the time wisely and on top of the drilling, we also have many observations. Thinking for a long time about a workspace always gets me attached to the area — some more than others; at the shorter stops, especially — when I am on shift several times during this time. I was Science Operations Working Group chair three times while we were here, so it’s a real “Goodbye” for me today as we are driving onward to reach the next area up the hill on Mount Sharp.

The Campo Marte drill was successful, as my colleague Abigail Fraeman reported last week. This week was spent investigating the aftermath of the drilling, which means running the CheMin instrument to get mineralogical data and the SAM instrument to inspect the volatile releases. ChemCam, APXS, MAHLI and Mastcam were also busy documenting the drill hole and the drill fines, as well as how much sample there was available overall.

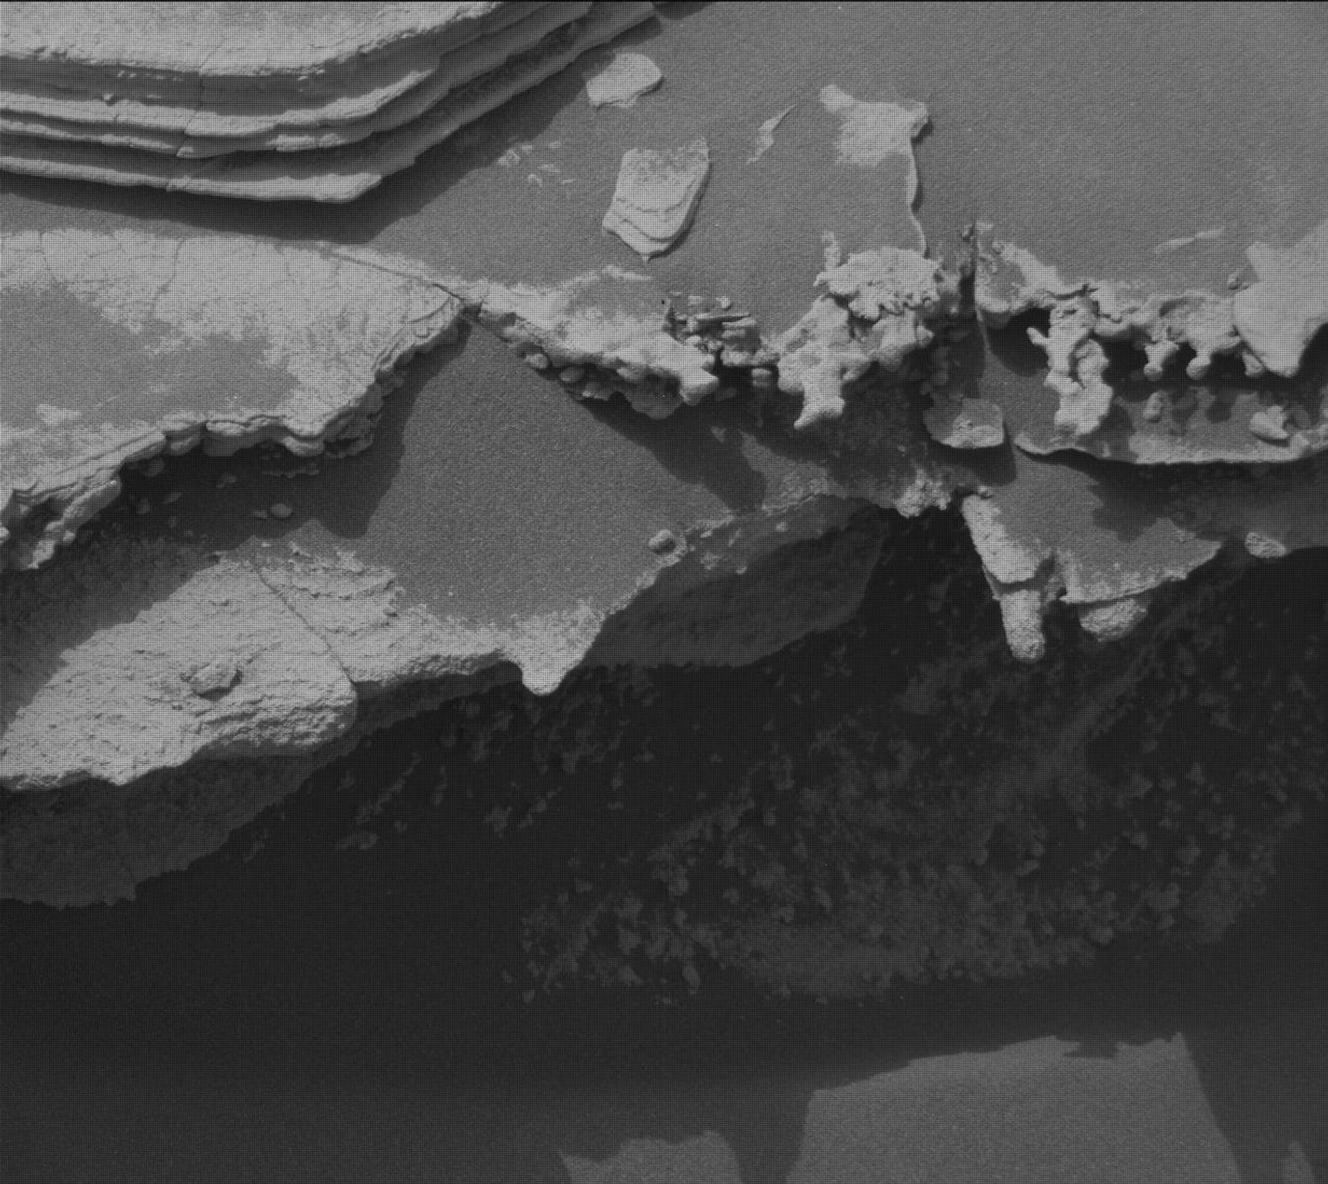
Of course, Curiosity also had a very good look at the other interesting targets in the area! Besides all the work on the drill hole, ChemCam carried out an expert’s targeting exercise by setting two targets up to aim at two different layers on adjacent spots on the finely laminated sediments. That involves aiming at millimeter-sized targets, named “Corcovado” and “Junakas,” respectively, about 3 meters away (about 10 feet)! We are curious if the layers are chemically different, which would tell us about different formation conditions, or if they are similar and the conditions when those layers formed were more similar. ChemCam is also looking at the target “Palcaya” to get more data on the chemistry of the layered bedrock, and will investigate the target “Alcamachi,” which is a float rock that looks intriguingly dark. Maybe that tells us it’s got a different chemistry? We will find out when we get the data!

In addition to the chemistry measurements, ChemCam will also carry out a spectral investigation on the target “Magallanas,” which was a little too far away to also point the laser at it, but is intriguingly dark. This last week, ChemCam also planned three long-distance RMIs to document the sedimentary structures — younger and older ones — in the surrounding area. One of them drew the suspicion that it might break a record: it might be the longest strip of RMI images we have taken in one mosaic! The jury is out, it’s 24 frames and this way links up with an earlier, shorter set of images. The reason the mosaic is so long is because it images a small ridge with sedimentary textures that could tell us about the depositional conditions when the rock layers formed. But how cool is that — at 13+ years to still break our own records?

Since our arrival, Mastcam has been very busy getting the entire region around us imaged. In addition, some higher-resolution mosaics have been taken, most notably one of the locations where the remaining sample was dropped, and then of the workspace to see again how much sample might — or might not — have been left in the drill stem and fallen out when Curiosity did the motions that are designed to shake any remaining sample out of the drill, to leave it prepared for the next time. Another imaging task, but for MAHLI, is to always image the sample inlets, also, to see if they are clean and prepared for the next sample. I included the MAHLI image of the CheMin inlet — don’t worry about the little rock, it’s with us for a while, and the CheMin team now calls it “our pet rock.”

APXS joined the drill-hole investigations and has been focused on it even more than usual. The team decided that this is a very good opportunity to increase counting statistics beyond the usual and well-tested levels by significantly increasing the measurement time. To achieve that, it measured the Campo Marte drill fines in all plans of this week. And on the last night of that, MAHLI gets out its LED lights to finish the experiment with a sparkling nighttime MAHLI experiment to document it all.

Our environmental team has kept the rover busy by looking at atmospheric opacity, dust activity, dust-devil activity and, of course, also monitoring the environment in general. With all this finished, the rover will continue its way up the hill to the next interesting area. I heard something like “cross-bedding” during the discussions, but as a mineralogist, I just note that that decision was taken by people who know more about sediments than I do, while I am itching to see the CheMin mineralogy results!

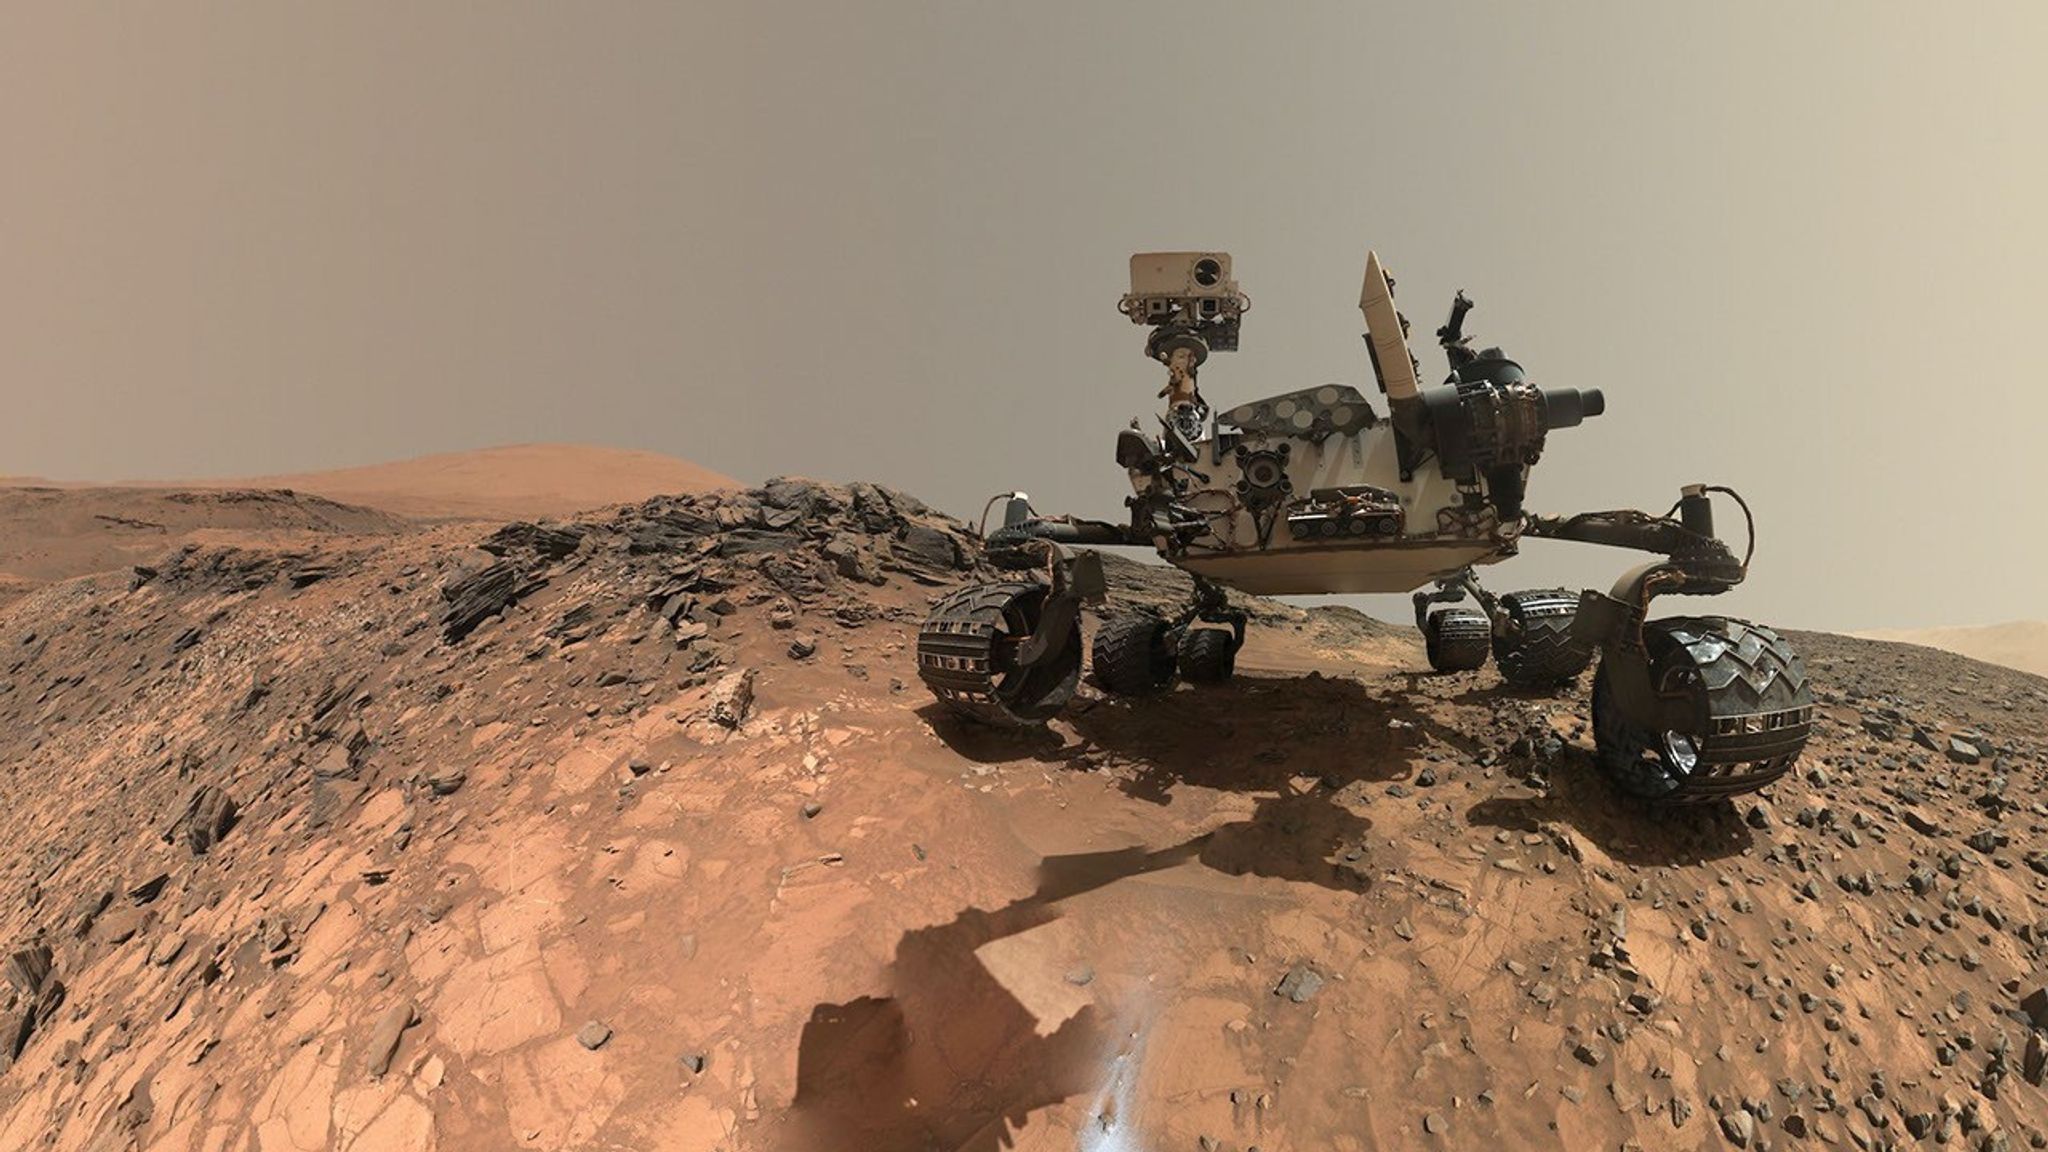
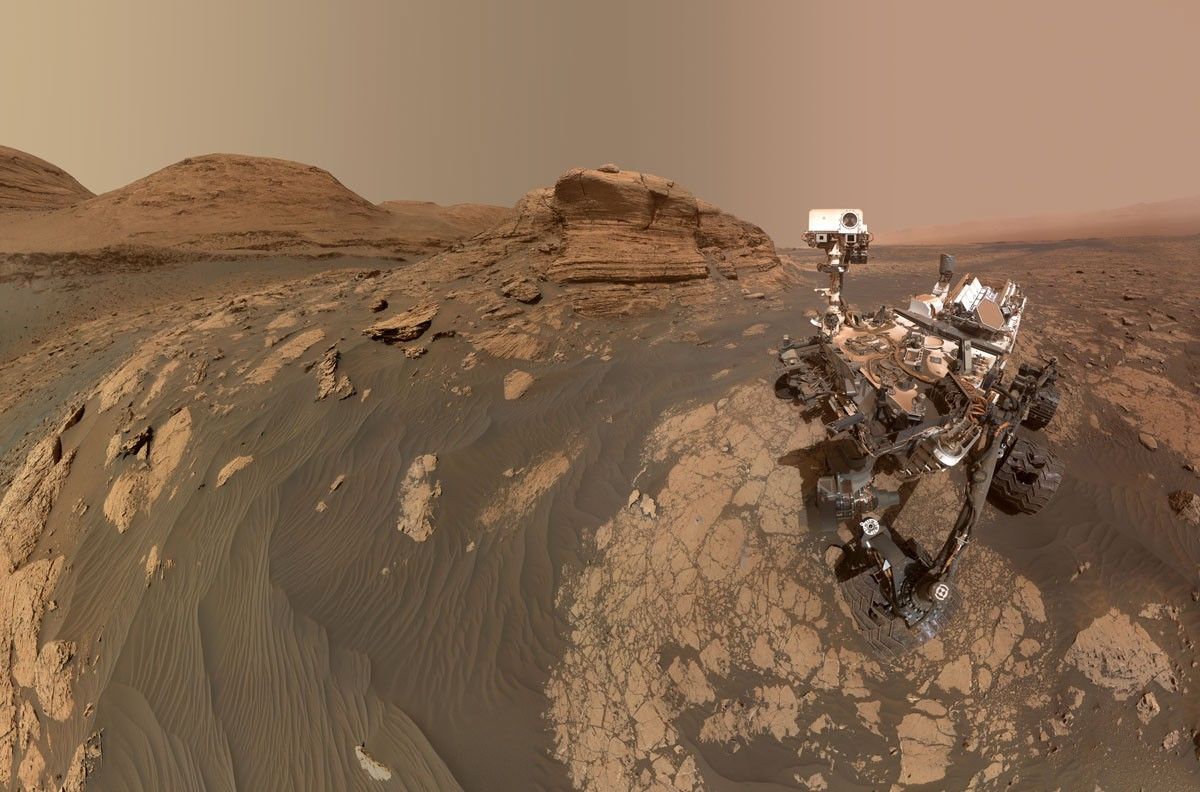
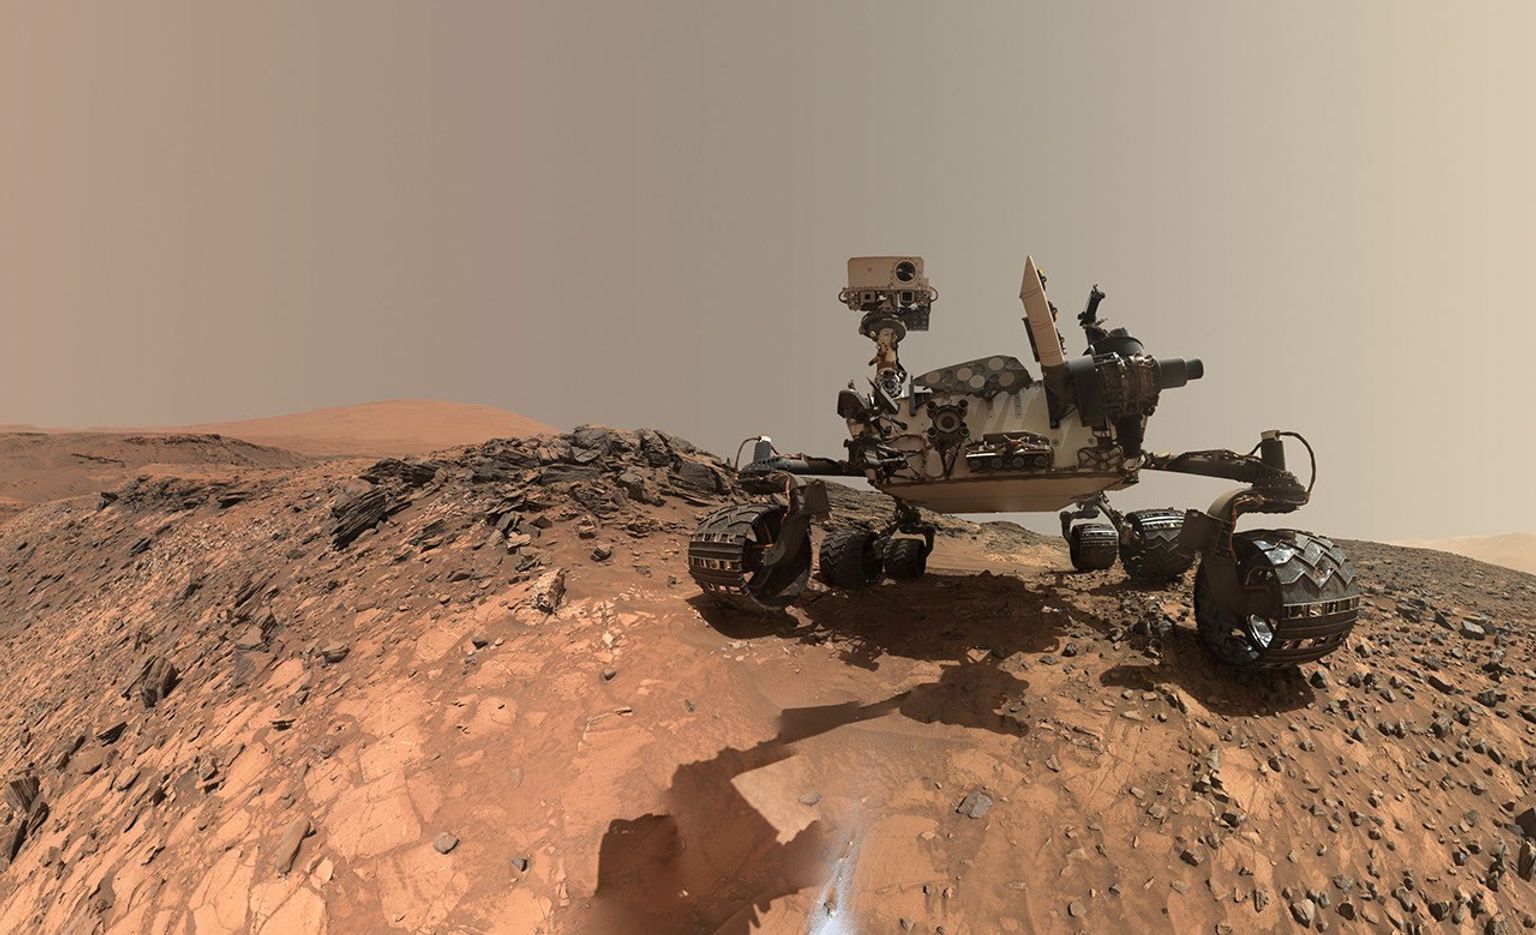
A rover sits on the hilly, orange Martian surface beneath a flat grey sky, surrounded by chunks of rock.
NASA’s Curiosity rover at the base of Mount Sharp
NASA/JPL-Caltech/MSSS

Share

Details

Last Updated
Jun 03, 2026

Related Terms

Powered by WPeMatico

Get The Details…

NASA Finds New Way Earth May Have Received Elements Needed for Life

NASA Finds New Way Earth May Have Received Elements Needed for Life

4 Min Read

NASA Finds New Way Earth May Have Received Elements Needed for Life

The image is dominated by a dusty disk extending from upper left to lower right and tilted toward the viewer.  It resembles patchy clouds with small rocky bits scattered throughout. At 4 o’clock and 11 o’clock are two small, embedded planets. The outer edges of the disk are reddish, the middle orange, and the inner region yellow-white. At the center is a gap within which is a bright white star.
This is an artist’s impression of a young star surrounded by a protoplanetary disk. Darker rings in the disk are where objects like planetesimals are forming, clearing a path through the debris.
Credits:
Illustration: ESO

NASA-supported scientists have provided new information about how the early Earth may have acquired some elements necessary for the planet to become habitable. They also suggest a new role for Jupiter in the distribution of these elements throughout the young solar system. The study, published today in Science Advances, examines this history by looking at the ratio of phosphorus to nitrogen in iron meteorites and in younger objects known as chondrites.

The study suggests that Earth acquired its inventory of the life-essential elements phosphorous and nitrogen primarily from the inner solar system, without requiring a significant contribution from outer solar system chondrites

Debjeet Pathak

Rice University

Planetary system formation

Our solar system formed from gas and dust that swirled around the proto-Sun more than 4.5 billion years ago. This gas contained the raw materials needed to form planets, moons, and ultimately life as we know it. Two elements of particular importance for life are nitrogen and phosphorus.

The image shows a standard Periodic Table of Elements with the boxes containing H, C, N, O, P, and S highlighted in blue. A faded comic book style image is the background shows meteorites raining down from space and crashing into the surface of a rocky body.
All life on Earth needs the same elements: carbon, hydrogen, nitrogen, oxygen, phosphorus, and sulfur (CHNOPS). These elements came from space, born inside stars and spread in clouds of gas and dust. Gravity then caused this material to gather together, forming new stars and smaller objects like planets.
NASA

In the earliest stages of the solar system, gas and dust coalesced into bodies known as planetesimals. As these objects orbited the young Sun in this chaotic environment, planetesimals collided, leaving shattered remnants throughout the system. Eventually, many of these pieces were incorporated into planets and moons. Other pieces survive today as asteroids, still orbiting the Sun, and – if they have impacted the Earth and been recovered – as meteorites. These meteorites provide a window into the early solar system at a time before the Earth existed. Chondrites and iron meteorites are two different classes of these meteorites.

As their name suggests, iron meteorites are dense, metallic objects and are primarily made of iron-nickel alloy. Chondrites, on the other hand, are stony objects and they are responsible for most of the meteorites that have been found on Earth.

Each type of meteorite originates from planetesimals that formed at different times in our system. The oldest generation of planetesimals are the source of iron meteorites. Chondrites came from a second generation of planetesimals that formed 2-3 million years later.

Habitable planet building

Understanding how the Earth was made and the timing of its formation is important for astrobiologists who study how and when our planet became habitable for life as we know it. The young Earth needed to have a supply of life’s ingredients, including nitrogen and phosphorus, for the first living cells to form.

There is debate between scientists over where Earth’s stock of life-essential elements came from. Some evidence points to chondrites in the outer solar system traveling inward to arrive at Earth late in our planet’s formation process. However, the new study tells a different story.

Using laboratory experiments and geochemical models, the team reconstructed a map of phosphorus-nitrogen (P/N) ratios across the early solar system and found differences between the first (iron meteorites) and second (chondrites) generations of planetesimals.

An illustration of a slice of a bright orange sun, with planets, a comet and asteroids against a blue-black backround.
An illustration of our solar system. The asteroid belt is located between Mars and Jupiter, separating our system into what we refer to as the inner and outer regions.
NASA/JPL-Caltech

The experiments and subsequent geochemical modeling showed that the first generation had a higher ratio of P/N in the outer solar system, with that ratio decreasing toward the inner solar system. This trend was reversed in the second generation of planetesimals, with higher P/N ratios in the inner solar system.

The thought is that during the formation of the first generation of planetesimals, there was an outward flow of material that raised the P/N ratio in the outer solar system. Then came Jupiter.

For our own solar system, Jupiter’s presence and growth history, indeed, seem to have played a critical role in determining the distribution of the basic chemical ingredients necessary for habitable worlds.

Rajdeep Dasgupta

Rice University

As Jupiter formed and grew to a tremendous size (and gravitational influence), the planet restricted the movement of phosphorus and nitrogen from the inner to outer solar system. This meant that when the second generation of planetesimals appeared, those in the inner solar system were left with a higher P/N ratio than their cousins further out.

“For our own solar system, Jupiter’s presence and growth history, indeed, seem to have played a critical role in determining the distribution of the basic chemical ingredients necessary for habitable worlds,” said Rajdeep Dasgupta of Rice University in Houston and senior author on the study. “It remains an open question whether a life-essential element budget similar to Earth’s can be established without a Jupiter-like planet in the population.”

Geochemical accretion modeling further shows that Earth’s present-day P/N signature is best reproduced by the inner solar system planetesimals, either those related to iron meteorites or those related to chondrites.

“The study suggests that Earth acquired its inventory of the life-essential elements phosphorous and nitrogen primarily from the inner solar system, without requiring a significant contribution from outer solar system chondrites,” said study lead author Debjeet Pathak, graduate student at Rice University.

For more information on astrobiology at NASA, visit:

https://science.nasa.gov/astrobiology

Karen Fox / Molly Wasser
Headquarters, Washington
202-358-1600
karen.c.fox@nasa.gov  / molly.l.wasser@nasa.gov

About the Author

Aaron Gronstal

Aaron Gronstal

Share

Details

Last Updated
Jun 03, 2026

Related Terms

Powered by WPeMatico

Get The Details…