Summary of the 2023 GRACE Follow-On Science Team Meeting
28 min read
Summary of the 2023 GRACE Follow-On Science Team Meeting
Felix Landerer, NASA/Jet Propulsion Laboratory, felix.w.landerer@jpl.nasa.gov
Introduction
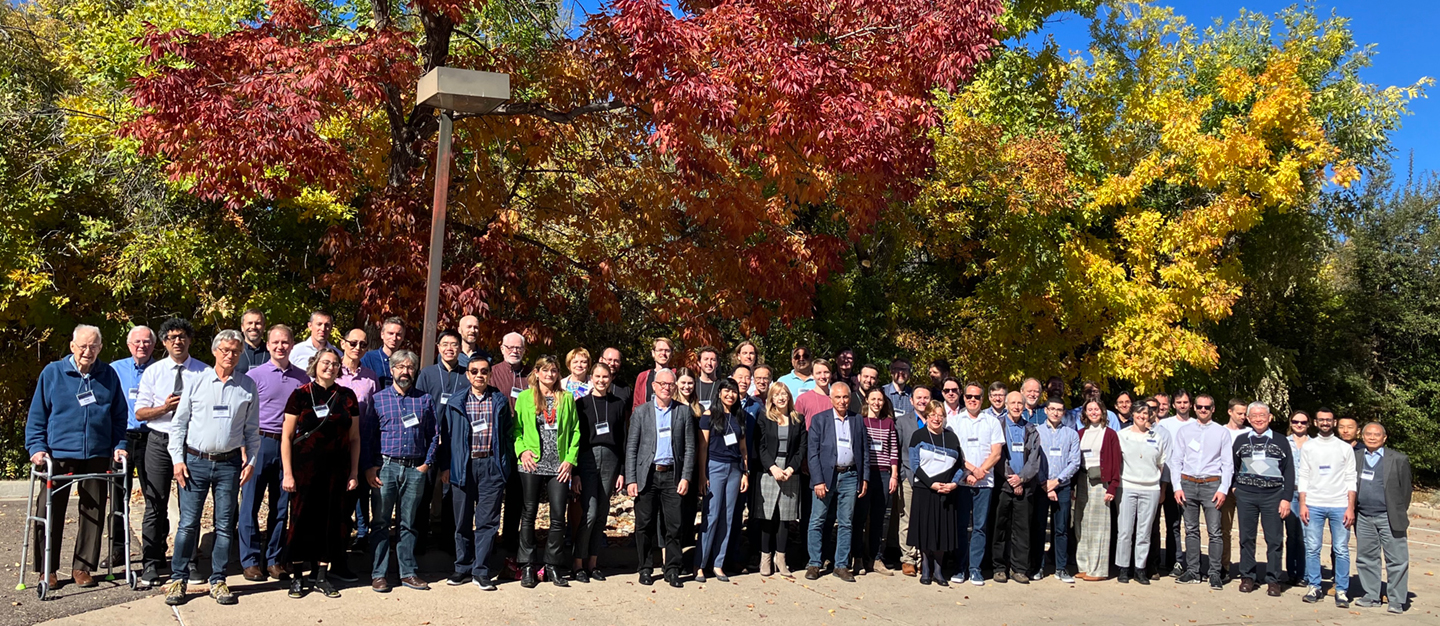
In October 2023, the annual gathering of the Gravity Recovery and Climate Experiment (GRACE) and GRACE Follow-On [G-FO] Science Team took place in Boulder, CO, hosted at University Corporation for Atmospheric Research’s (UCAR) Center Green campus. The event had 70 in-person participant and an additional 52 online participants – see Photo. G-FO is a U.S.–German collaboration between NASA and the Helmholtz Centre Potsdam GeoForschungsZentrum (GFZ) [German Research Centre for Geosciences].
The meeting agenda featured 15-minute presentations over three days, describing new findings from G-FO observations and the combined GRACE and GRACE-FO [G/G-FO] climate data record that now spans over 21 years (2002–2023).
The meeting began with the customary G-FO project status session, covering programmatic mission and flight segment technical updates, future mission plans, and descriptions of the latest data released from the GRACE Science Data System (SDS) centers. Subsequent sessions featured more than 53 contributed presentations covering analyses, algorithms, and science results by Science Team members and attendees, totaling 57 oral and 5 poster presentations. Many of the presentations are posted on the GRACE website. While this summary will cover all the content on the agenda of the meeting – it does do so in an exact linear fashion. It begins with a G-FO mission status update, followed by key highlights from the contributed analysis and science presentations.
Status of GRACE Follow-On
Since their launch on May 22, 2018, the twin G-FO satellites have been tracking Earth’s water movements and global surface mass changes that arise from climatic, anthropogenic, and tectonic changes. G-FO also enables new insights into variations of ice sheet and glacier mass, land water storage, as well as changes in sea level and ocean currents. These measurements have important applications and implications for everyday life. The impact of these data is underscored by the publication of over 6000 scientific papers – an average of 5 new publications per week – that have established G/G-FO as a leading Earth Science mission.
In May 2023, G-FO successfully completed its Prime Mission phase that lasted five years after launch. G-FO was among the missions that went through the 2023 NASA Earth Science Senior Review. The NASA project team submitted its response in spring of 2023 to extend mission operations through 2026. The proposal received overall Excellent score, highlighting the unique utility the data provide for Earth Science research and societal applications. However, the G-FO project’s NASA budget will be reduced (compared to the previous baseline) by 15% in fiscal year (FY) 2024 and 24% in FY 2025 and 2026 due to the overall budget constraints that NASA is facing. The G-FO team remains confident in its ability to continue delivering high-value and high-impact science data products – prioritizing science operations management and data latency over data reprocessing campaigns. Both NASA and GFZ had already formally committed to extending their collaboration on G-FO mission operations and data processing through the end of 2026 via a Memorandum of Understanding.
As of December 2023, the G-FO project team has processed and released 62 monthly gravity fields – the most recent being for October 2023 (at the time of this writing). The primary mission objective for G-FO is to provide continuity for the monthly GRACE mass-change observations (2002–2017) via its Microwave Interferometer (MWI) intersatellite range-change observations. G-FO also demonstrated a novel technology demonstration Laser-Ranging Interferometer (LRI) for more accurate satellite-to-satellite ranging observations for future GRACE-like missions. The LRI has been successfully operated in parallel with the MWI for most of the mission, delivering excellent quality data. LRI-based monthly gravity and mass change fields covering the period from mid-2018 to mid-2023 have been made available by the SDS teams for further analysis and study by the science community.
Programmatic, Mission, and Operations Updates
The meeting began with Frank Flechtner [GFZ–German G-FO Project Manager] and Felix Landerer [NASA/Jet Propulsion Laboratory (JPL)—U.S. G-FO Project Scientist] giving welcoming remarks, followed by detailed assessments of the G-FO mission and operations status from the core SDS centers and flight operations teams.
GRACE Follow-On Project Status
Felix Landerer gave an overview of the G-FO satellites and the science data system performance. He reported that G-FO continues to meet its goal of extending the GRACE mass-change and gravity data record at equivalent precision and spatiotemporal sampling.
Since the previous STM in October 2022, the overall G-FO science instrument performance has been stable, and the SDS team continued to deliver a gapless monthly data record to users ahead of schedule (on average, within 43 days instead of the 60-day requirement). Improving the data calibrations of the accelerometer measurements – which are noise contaminated on one of the two G-FO spacecraft – remains a core focus of the project SDS team. To this end, an improved calibration approach that reduced data errors by 10–20% has been developed and will be operationalized by the team in the coming months.
Landerer reported that, as forecasted, the current Solar Cycle 25 has gained in strength through 2023 and will continue to do so through 2024 before subsiding again. The resulting higher non-gravitational forces acting on the satellites need to be properly accounted for in the accelerometer data processing.
He also noted that small thruster leaks in the satellites cold gas propulsion system have been closely monitored since 2021. To ensure stable data collection and sufficient lifetime margin to achieve continuity with the proposed successor mission GRACE-Continuity, or GRACE-C (which is the new name for the Earth System Observatory Mass Change mission scheduled for launch no earlier than 2028), the G-FO project team, in conjunction with guidance from the satellite manufacturer Airbus and the German Space Operations Center, decided to adjust the operational data collection mode of G-FO to a wide pointing mode – which means that the two spacecraft are allowed to deviate from their relative line-of-sight pointing by up to 2°, whereas the previous pointing angles were 100 times smaller. This operational change necessitates fewer thruster firings, which in turn reduces leaks and improves accelerometer calibrations – and thus leads to better overall science data quality. Due to the wide pointing, the LRI intersatellite ranging data collection has been suspended in this operational mode. However, the LRI instruments are still activated and fully functional. Landerer emphasized that reducing the leak ensures that the GRACE-FO mission will have sufficient fuel to remain operational up until GRACE-C launches.
Despite these operational challenges, Landerer said that the science data delivered by G-FO continues to provide excellent utility and insights into a rapidly changing Earth system. He briefly highlighted a few scientific and decision-support contributions and achievements of G-FO over the last year. These included:
- Monitoring California Groundwater. G-FO recorded the largest seasonal total water storage gains over California after the multiple atmospheric rivers made landfall during the 2022/2023 winter. Yet, peak water storage in May was below values observed 15–20 years ago – due to long-term, sustained groundwater declines. Going forward, the data will be invaluable to assess groundwater recharge rates and processes.
- Tracking Polar Ice Mass Loss. G/G-FO measured net ice mass gains over Antarctica that began around 2021 due to snow accumulation mainly in East Antarctica, which offset the unabated mass loss of the West Antarctic ice sheet.
Subsequent science presentations presented in-depth analyses of these and other findings in the dedicated science sessions, some of which are summarized below.
Landerer also highlighted the expanding portfolio of open science contributions that the project team is supporting: Jupyter notebooks are part of an expanding GRACE Open Science toolbox with the goal to expand this toolbox with input from the Science Team and user community in the coming years. In addition, easy-to-use browser data portals at JPL and GFZ have been key to expand the science and applications user community that increasingly use the Level-3 and higher data products in decision support contexts (e.g., for drought monitoring and water resources management).
A series of status reports on programmatic G-FO mission operations, science operations, and SDS processing followed the opening presentations. Krzysztof Snopek [GFZ] reported on the ground and mission operations at the German Space Operations Center (GSOC), which is responsible for G-FO spacecraft operations. All essential flight operations, software updates, and planned calibrations were successfully scheduled and carried out by GSOC. Himanshu Save [University of Texas, Center for Space Research (CSR)] provided the science operations assessment. He described the evolving Solar Cycle 25 and its influence on the G-FO spacecraft, the mission’s fuel budget, and adjusted operational procedures and modes (such as the already-mentioned ‘wide’ pointing mode). Christopher McCullough [JPL] reviewed the status of G/G-FO Level 1 processing at JPL, detailing additional improvements made in the accelerometer calibrations. The team is using the noisy accelerometer data on one satellite and retrieving improved science information from it.
A representative from each of the G-FO mission SDS centers – which includes JPL, GFZ, CSR, and GSFC – summarized the status of the latest gravity-field and mass change data products [RL06.X L2], including an overview of background dealiasing models and the GFZ GravIS portal, the updated JPL mascon data product, new data-processing strategies, e.g., via range acceleration [CSR], and the status of ancillary Satellite-Laser-Ranging (SLR) data processing and dedicated G/G-FO products [GSFC].
Following the project team’s status presentations, there was a 30-minute session to answer questions from the science community and discuss in more detail the mission performance, near-term operations and data processing plans, as well as to gather suggestions and feedback from the community.
Science Presentations
The remainder of the sessions in the meeting were open-submission science sessions, each of which centered around different thematic topics, including: G/G-FO analysis techniques and next generation gravity mission (NGGM) concept studies, and science analysis of mass-transport data in the fields of glaciology, oceanography, hydrology, and solid-Earth physics. As has been the case in previous years, the presenters underscored the value of interdisciplinary and multi-instrument analyses that utilize the unique complementary value of G/G-FO mass-change observations in combination with other remote sensing data (e.g., satellite altimetry or precipitation observations) and in situ data (e.g., surface deformation or ocean temperature profiles). Such hydrogeodetic combinations yield improved spatial and temporal resolutions that enable advances in Earth system process understanding, which increasingly advance societal applications of science results in support of NASA’s programmatic focus on Earth Science to Action, which seeks to “advance and integrate Earth science knowledge to empower humanity to create a more resilient world.”
Section A: GRACE and GRACE-FO Geodesy
The project status reports presented under the previous heading were part of the first section of the agenda (Session A1) as were two additional sessions: Analysis Techniques and Intercomparisons (Session A2) and NGGM and Bridging the Gap (Session A3), which focused on plans, concepts, and technologies being developed for future gravity missions. Highlights from each of these two sessions follow in the next two subsections.
Analysis Techniques and Inter-comparisons
This session featured 15 presentations by the SDS centers and ST members on progress in instrument data calibrations and novel data processing algorithms and methods, including data-fusion with other observations.
Representatives from G/G-FO processing centers presented updated gravity-field time-series data, which capitalize on improved parameterizations, better instrument error characterizations (e.g., from star cameras, accelerometers, or ranging instruments) and background models (e.g., for tides) for improved monthly mass change data and uncertainty quantification. The highly accurate LRI data provides further opportunities to identify and characterize measurement system errors, which can be exploited for G-FO data processing but is also informative in the development of the future GRACE-C mission. However, it was also shown that several metrics used in identifying gravitational errors are sensitive to the estimated satellite trajectory, and consequently a sufficient understanding of the orbital trajectory is necessary to make accurate adjustments to the gravity field based on satellite observations.
The G/G-FO data products make use of ground-based geodetic observations, such as satellite laser-ranging (SLR) to a network of dedicated SLR satellites, which can be used to extend the G/G-FO interannual data record back to ~1994 – albeit at a much-reduced spatial resolution. Additionally, SLR data provide an important validation and performance assessment opportunity for G/G-FO observations. In that regard one presenter showed results indicating the recent G-FO accelerometer updates have indeed resulted in better gravity and mass change fields. Other speakers discussed the value and potential for improvement that could be achieved by combining G-FO and SLR observations more formally to exploit the data strengths of the different observation types in an optimal way. Such approaches could reduce uncertainties in global ocean and land ice mass changes. Furthermore, deployment of stable, long-term ocean bottom pressure (OBP) recorders in the Arctic Ocean in 2022 has enabled progress on G/G-FO OBP data validation. The data from these OBP recorders are entirely independent of G/G-FO observations and are thus very valuable to assess the satellite data record. An initial comparison between 1.5 years of OBP data and various G-FO OBP products suggest excellent agreement.
The data collected from G/G-FO has a native resolution of about 300 km (~186 mi). By jointly analyzing these G/G-FO data with higher-resolution surface elevation changes from a multimission synthesis of radar and laser satellite altimeters, net mass changes can be effectively downscaled (within a Bayesian framework) to less than 20 km (~12 mi) resolution, which is sufficiently high resolution to resolve individual ice streams in Antarctica that cannot be separated using G/G-FO data alone.
NGGM and Bridging the Gap
The presenters in this session provided status-update on the GRACE-C mission, a joint project between NASA and the Deutsches Zentrum für Luft- und Raumfahrt (DLR) [German Aerospace Center], as well as on future instrument developments and mission concepts.
The 2017 NASA Earth Science Decadal Survey Report highlighted mass-transport monitoring through gravity change as one of five designated observables (i.e., top priorities for study) in Earth observations for the next decade in collaboration with international partners. The GRACE-C project successfully passed the NASA/JPL Mission Concept Review in June 2022, and the NASA Key Decision Point B review in September 2023 and is currently in its Phase B project definition phase. GRACE-C will be a single satellite pair based on a fully redundant LRI (as demonstrated on GRACE-FO) in a polar orbit at 500 km (~311 mi) altitude. To avoid a data gap after GFO, a launch date of no later than 2028 is targeted for GRACE-C.
Similarly, GFZ has been conducting model simulation studies to determine the value of adding a second satellite pair, dubbed Next-Generation Gravity Mission (NGGM) in Europe. The experiments reveal that advanced parameterization techniques for improved de-aliasing of short-term mass variations can significantly reduce data errors and open the possibility for higher spatial and temporal resolution data products and science applications.
The technology demonstration LRI on G-FO has surpassed its performance requirements. With a LRI expected to be the primary instrument for the GRACE-C mission as well as other future GRACE-like missions, development of a new technique is required to provide long-term laser frequency knowledge to provide a scale correction factor to the geodesy measurement. The LRI-team presented updated results of a so-called scale factor measurement technique that allows the accurate determination of the laser frequency on-orbit that can meet the stringent GRACE-C mission requirements. This was achieved with a dual frequency modulation scheme, and a prototype electronics unit has been developed and tested, demonstrating performance better than the expected mission requirements.
There were also reports on progress in technology development of low-frequency optomechanical accelerometers for geodetic applications. These highly-sensitive, compact, portable – and cost-effective – optomechanical inertial sensors build upon recent advances in optomechanics to measure accelerations with small form factors. The development of a sensor with lower cost, size, weight, and power – yet with GRACE-like performance – is a major achievement as these could be integrated into cost-effective mission designs, spacecraft miniaturization, simplified architectures, as well as for the deployment of constellations of satellite pairs flying at lower altitudes.
Section B: Geophysics and Climate Science
There were five sessions included in this section of the agenda, which are summarized in the subsections below as follows: Hydrology (Session B4), Cryosphere (Session B2), Solid Earth Sciences (Session B1), Oceanography (Session B3), and Multidisciplinary Science (Session B5).
Hydrology
This session, with 12 presentations, highlighted advances in hydrology research and applications using G/G-FO data enabled by the unique value of long, uninterrupted mass change climate data record.
The topic of terrestrial water storage variations in California came up in several presentations, focusing on the see-saw swings between very wet and very dry years and the early impacts on groundwater recharge after the record-breaking snow accumulation during the 2022/2023 winter. The process of groundwater recharge – an important objective in the 2017 Earth Science Decadal Survey – is not well understood because of the challenges in observing infiltration of new water supply into the ground and the effects of rate of input, amount of input, and various aquifer characteristics. By combining observations of precipitation, snow water equivalent, surface water storage, ground surface deformation, and groundwater storage from G/G-FO, recharge behavior can be characterized in a natural experiment where source inputs are effectively not limited, but recharge capacity is limited. Results of studies shown during the meeting reveal that only a fraction of total available potential recharge can enter the aquifer, and that G/G-FO observations allow us to measure the effective aggregated recharge capacity and how it varies with several predictors. Another paper reported that subsurface water increases in California’s Sierra Nevada by 0.6 m (~2 ft) from October 2022 to June 2023, which represents 43% of the cumulative precipitation.
Several presenters reported on efforts to advance concepts to downscale G/G-FO data to bring the information closer to decision-making scales and expand water-related applications, as well as to fill gaps and expand the data record with multisensor observations. One presenter described a new spectral approach that employs wavelet multiresolution analysis to combine seasonal terrestrial water storage change data from G/G-FO with those from global navigation satellite system (GNSS) ground station networks to downscale the observations to smaller hydrological basins and to better separate processes over complex topographical terrain. This method can also be used by fusing G/G-FO and hydrological model data [e.g., from NASA’s Global Land Data Assimilation System (GLDAS) models at continental scales]. Importantly, the method yields trends and long-term signals that match G/G-FO observations – a strength of the observing system. Another approach used a statistical Bayesian framework to incorporate G/G-FO observations and Soil Moisture Change data from different available sources [e.g., NASA’s Soil Moisture Active Passive (SMAP) mission] to obtain nonparametric likelihood functions that allow for downscaling. A statistical technique called cyclostationary empirical orthogonal function (CSEOF) analysis – which is used to interpret space-time variability in a large dataset – allowed researchers to fill short data gaps (~1 year) in G/G-FO record (e.g., between 2017 and 2018 – the gap between GRACE and GRACE–FO) without having any additional data. With the support of physically-related data (e.g., precipitation and temperature), CSEOFs can be used to reconstruct water changes into the past or fill larger data gaps. Such datasets improve understanding of trends and natural variability and anticipate future trends in response to climatic changes.
Another presenter described a science study that found an apparent abrupt decline in temperate (non-ice) Terrestrial Water Storage (TWS) in 2015 to a new, lower regime that appears to be unique in the past 33 years. The triggering event for this new lower TWS regime appears to be the massive drought in Brazil in 2015. Subsequent droughts around the world (e.g., Europe, the western U.S., Canada, central Africa, and southern Brazil) have helped to keep TWS values depressed. Warm global sea surface temperatures, prevalent since 2015, have decreased rain accumulation over the continents, reducing TWS.
In the European Alps region, a G/G-FO data analysis found that glacier and ice changes are the major contributors to the observed signals. Overall, glaciers here have lost ice mass at rates between 1.4 to 2.2 Gt/year since 2002. Advances in spatial downscaling and data combinations are expected to allow for improved estimates and applications, including geological hazard monitoring.
In Northern Italy, accelerated groundwater loss has been detected using G/G-FO, well measurements, and vertical land motion observations. Since 2015, the groundwater loss has accelerated. Assuming a best-case scenario (conditions similar to 2007–2014), it could take 13–28 years for ground water storage to recover from recent long-term period of decline, thus setting the stage for prolonged drought conditions.
Since a pioneering study in 2014, it is well-established that G/G-FO observations of TWS are an effective means to estimate flood potential and flood risks due to water-saturated soil. Novel G/G-FO data processing schemes that exploit sub-monthly variations of total water storage enabled researchers to delineate basin-specific storage-discharge dynamics more accurately. They found that at submonthly timescales in many global basins, water storage (i.e., saturated soil) has more impact on whether a flood will occur than the amount of precipitation that falls.
Along the Nile River, G/G-FO data were used to monitor water changes in crucial artificial reservoirs. These data indicate that water losses through underground-seepage over the geologically highly fractured region via a complex network of shear systems, faults, and fractures, are significant and could impact the delicate water balance in the region. A separate study focusing on nearby Southern Arabia found that intense tropical cyclones (wind speeds > 64 kph or ~40 mph) have doubled in the past decade compared to the preceding two, which resulted in significant recharge of the aquifers in the study area. The findings demonstrate the ability of G/G-FO to capture recharge signals and monitor aquifer systems in poorly gauged basins and highlight the significant role of tropical cyclones in recharging aquifers in arid Arabia.
Cryosphere
The five contributions in this session reported on new ice mass balance results of the Earth’s land-ice, as well as on novel data-combinations approaches that can improve the spatial resolution over G/G-FO-only data.
The Antarctica Ice Sheet contributes to the largest sea level rise potential and remains as the largest uncertainty source in the prediction of future sea levels. Data from G-FO and the Ice, Clouds and land Elevation Satellite–2 (ICESat-2) mission have been used to track ice sheet mass and height changes in Greenland and Antarctica, respectively. By combining the strengths of G-FO (gravity or mass change) and ICESat-2, (laser altimetry) data, a more accurate and less uncertain estimate of ice sheet mass changes can be achieved. This combination has led to a proposal for an enhanced iterative algorithm for deriving Antarctic mass balance, incorporating key technologies such as altimetry, gravity measurements, Global Positioning System (GPS) satellite data, and surface mass balance models. The study utilizes an effective density map derived from ICESat-2 and tests the algorithm’s sensitivity and uncertainty with synthetic data, considering realistic physical processes and variability. This approach aims to address discrepancies in estimating ice mass loss in East Antarctica and provides important guidance for optimizing future ground measurements (i.e., GPS station positions). Another presentation focused on understanding the differences in mass change recovered by the G/G-FO and IceSat-2 missions – both in terms of spatial distributions and total magnitudes – to ultimately determine a best combined estimate of ice sheet mass change leveraging the strengths of each mission.
Temporal gravity field estimates from G/G-FO data reveal that the Antarctic ice sheet contributed approximately 6.1 mm (~0.2 in) to global sea level rise from 2002–2022, with a net loss of ~2150 GT of mass. While mass change accelerated during the GRACE era, it has decelerated during the GRACE-FO era – due to increased mass gain in East Antarctica. The deceleration is attributed to surface mass balance processes: annual precipitation and increased incidences of extreme weather events in East Antarctica, challenging predictions based on correlations with climate indices like Southern Annular Mode and El Niño Southern Oscillation.
A related study confirmed a pause in Antarctica’s mass loss, a non-accelerating mass loss in Greenland, and a steady loss from glaciers and ice caps away from the poles. The use of the LRI observations enabled novel submonthly analysis in key regions (including the Amundsen Sea Embayment of West Antarctica and the Pine Island/Thwaites basins) to gain more understanding of fast ice dynamics and their spatial extent.
While G/G-FO data span two decades, estimates of Earth’s oblateness from other satellite observations that date back to 1976 and provide a much longer data record – albeit at much coarser spatial resolution. This half-century long timeseries provides important constraints on ice mass change prior to the launch of GRACE in 2002. The data suggest that ice mass loss had already begun to accelerate by the 1990s. Recent progress in Earth system models, in conjunction with the long satellite data record, are being used to isolate trends in glacial isostatic adjustment (GIA) – which is the vertical movement of the Earth’s surface after the weight of glaciers is removed from them – and to improved estimates of ice mass loss prior to GRACE.
Solid Earth Sciences
Two presenters in this session described their efforts to evaluate signals in the G/G-FO data record associated with earthquakes. The G/G-FO data provide a unique opportunity to observe the Earth’s response to great earthquakes across diverse tectonic settings at time scales from days to decades. Using 13 earthquakes of magnitude (Mw)>8.0 over the last 20 years, it was found that elastic bulk modulus and viscosity govern large-scale coseismic and postseismic gravimetric changes, respectively. By constraining the solid Earth’s viscosity structure, improved physics-based models of long-term postseismic changes can be developed that incorporate observations from G/G-FO. The portion of the long-term gravity change signal that can be attributed to these earthquakes can then be removed from the G/G-FO data to better quantify processes related to ocean mass and hydrology changes. When physics-based models are not available, alternative statistic-based approaches can be used to remove the co- and post-seismic signature of large earthquakes (e.g., 2004 Andaman-Sumatra and 2011 Tohoku, Japan quakes) from the G/G-FO data.
As the G/G-FO data record extends into its third decade, the long time series of Earth gravity changes requires careful consideration of the solid-Earth response to contemporary surface mass changes. To isolate the gravity signature of any surface mass signal, it is becoming evident that simple elastic loading corrections are no longer sufficient. Recent advances in mantle rheology – describing and understanding the nature of Earth’s mantle – derived in mineral laboratory experiments, tidal modeling, and seismic imaging provide unequivocal evidence of anelastic contributions to solid-Earth deformation on time-scales ranging from hours to decades. New developments in the solid-Earth capabilities of JPL’s Ice-sheet and Sea-level System Model (ISSM) in the form of viscoelastic solvers for Love numbers and sea-level change was used to implement and explore the so-called Extended Burgers Material (EBM) and so resulting viscoelastic deformations between the seismic and GIA time scales. Preliminary testing with EBM rheology shows potential for a ~15–20% increase in mass change trends for some regions.
A subdecadal variation of large-scale (i.e., spanning over continental scales) gravity signals with a period of approximately six years has attracted intense interest in the geodesy and geodynamic communities. Earth’s fluid core motions, magnetic field, Earth rotation, and crustal deformations have been invoked as causes for this signal. An analysis of G/G-FO data showed that a significant part of the approximately six-year signals is in fact due to climate-related oscillation of ocean-atmosphere coupling in the Pacific and Atlantic and variations in the land water storage over Africa.
Oceanography
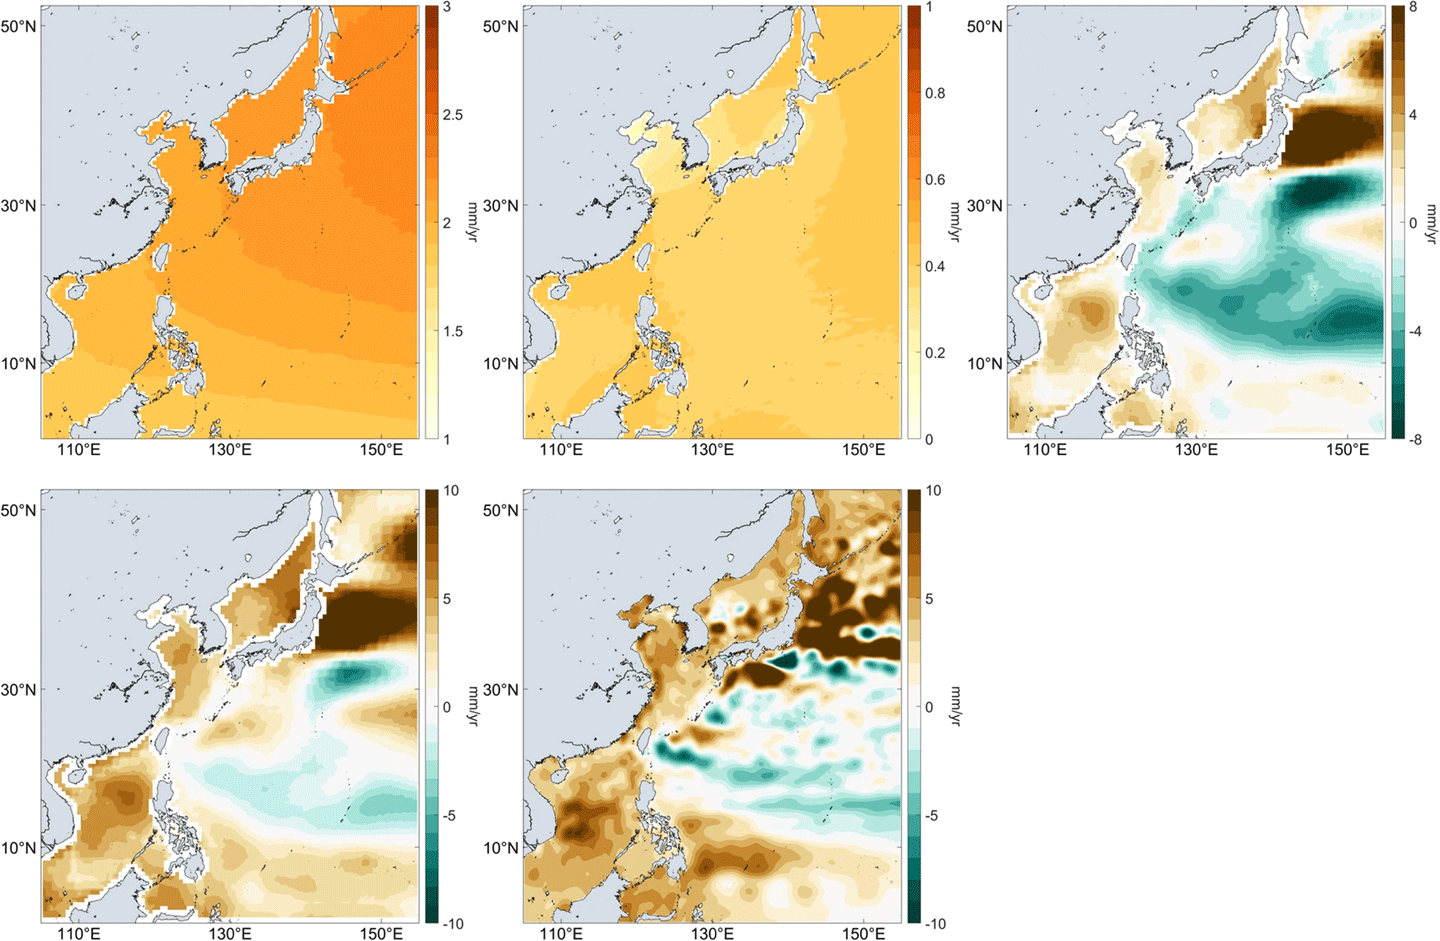
In the oceanography session, five presenters reported on the combination of G/G-FO, satellite altimeters (e.g., from the joint NASA–European Sentinel-6 Michael Freilich mission), and in situ ocean floats (e.g., Argo) to investigate variations in sea level and ocean circulations – e.g., see Figure 1. Other presenters discussed improvements in data processing by reducing errors in atmospheric tides that could lead to spurious trends or double-counting a subset of ocean tides and by incorporating new dedicated ocean data grids that remove geodetic signals not related to ocean dynamics (e.g., global ocean mass; large earthquake signals).
Another presenter described how ocean mass redistribution and regional sea-level rise in the North-West Pacific marginal seas (i.e., around Japan and north of the Philippines) is impacted by seafloor deformation from earthquakes, which alter the ocean bathymetry. G/G-FO data are key to isolating these deformation effects, which in turn allows better sea level projections that can be used for planning purposes.
While long-term sea level trends are of major concern, the seasonal cycle is the dominating climate signal in ocean bottom pressure variability. Accurate representation of seasonal cycle is thus key to efforts to improve observations and models of ocean bottom pressure. Examining differences between models and observations elucidates remaining uncertainty in observations and missing physics in the models (e.g., lack of intrinsic variability due to coarse resolution, no accounting of gravitational and loading effects). This allows researchers to advance the quality of ocean mass change observations and unravel underlying dynamics.
Lastly, ocean bottom pressure observations from G/G-FO have been used to monitor transport variability of deep currents associated overturning circulation in the Northern Hemisphere (the Labrador Current) and Southern Hemisphere (Weddell Sea Bottom Water). This deepwater transport provides an important pathway for the sequestration of excess atmospheric heat and carbon from locations of water mass formation. Continuous observations of deep ocean currents provide valuable insight into Earth’s climate system. However, harsh conditions and complex recirculation transport pathways make in-situ observations of these deep flowing currents challenging.
Interdisciplinary Science
Six presenters contributed to this session. The first study revisited geodetic assumptions about measuring so-called Earth Center-of-Mass (CM) motions that can be traced to planetary-scale seasonal and long-term variations of water cycling between the land the oceans. Differences in SLR and G/G-FO estimates of CM estimates can be helpful to refining global circulation models. In a related study, G/G-FO and SLR data have been used to pin down the causes and origin of polar motion, particularly the mass component related to gravity changes. A novel hybrid SLR/GRACE time-variable gravity approach closely aligned well with the hydrological excitation in independently polar motion.
Errors in GIA corrections impact altimeter estimates of sea level and ocean mass estimates and the so-called sea level budget. Choices in modeling GIA, particularly based on paleoshoreline sites, affect Earth’s viscosity structure and GIA response, influencing global mean sea level (GMSL) budget closure. Even minor Earth model changes can have notable effects on the alignment of GMSL (altimetry), ocean mass (GRACE), and steric sea level change (Argo). Thus, future research needs to focus on accounting for the complex three-dimensional structure of the solid Earth to improve GIA corrections and more accurately isolate contemporary mass change in the G/G-FO data record.
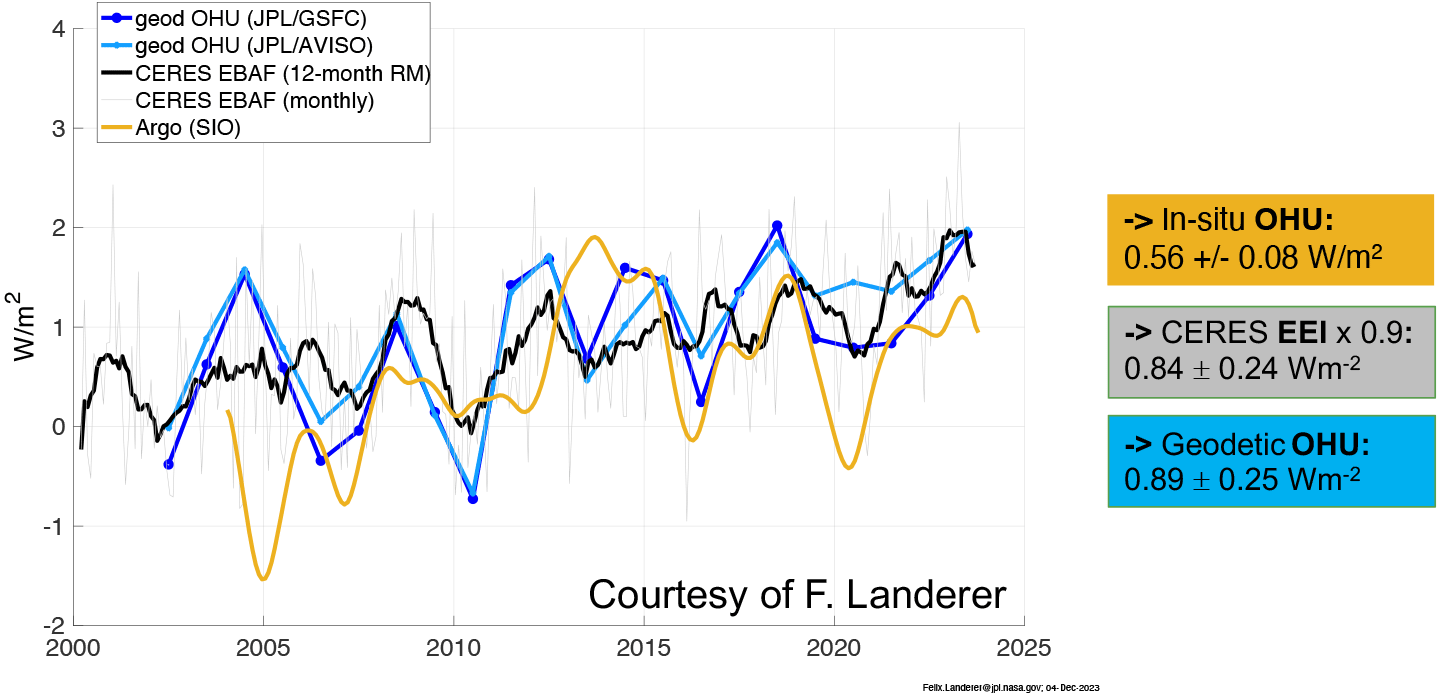
Despite GIA uncertainties, G/G-FO, in combination with sea level measurements from altimetry, provide a unique capability to measure changes in ocean heat content. The ocean takes up nearly 90% of Earth’s current energy imbalance, signifying their important role in overall planetary heating. Two presenters reported consistent findings of ocean heat uptake rates of 0.9 W/m2 based on the indirect geodetic satellite measurements of sea level and ocean mass – a value that is entirely independent of other techniques and thus provides crucial validation – see Figure 2. In addition, the results indicated the overall heating rate over the last decade has increased, which means heat accumulation is accelerating.
Summary
The hybrid 2023 G-FO STM brought together over 120 international participants and showcased a broad range of science results and applications that are supported and uniquely enabled by the satellite gravimetry-based mass change observations. The G-FO data now span nearly six years and continue to provide crucial insights into how Earth’s hydrosphere, including sea level, ocean currents, and water distribution over land, is changing. The G/G-FO data are extending important climate data records (e.g., the Greenland and Antarctic ice mass time-series, ocean mass sea level data, and TWS over land) into their third decade. The upcoming GRACE-C mission will build on and expand this mature data record, which is increasingly enabling important applications in support of water-related decision making and planning.
The G-FO project team remains focused on providing the mass-change data record at a level of performance consistent with that of GRACE. As the current Solar Cycle 25 increases towards its anticipated maximum in 2024, the team continues to improve the mission’s accelerometer data products in support of that goal. Corresponding data improvements in the monthly gravity and mass change products will be released early 2024.
The next G-FO STM will be held from October 8–10, 2024 in Potsdam, Germany, organized by GFZ. Check the GRACE website for specific details as the date gets closer.
Powered by WPeMatico
Get The Details…