Summary of the Third Annual AEOIP Workshop

27 min read
Summary of the Third Annual AEOIP Workshop
Introduction
The Applied Earth Observations Innovation Partnership (AEOIP) was established in 2018 to facilitate knowledge coproduction and optimization of NASA Earth observations that can be used by natural resource managers for decision making. Through continued iteration and reflection, coproduction brings together stakeholders to share responsibilities and the completion of activities towards a common goal. AEOIP enables strong collaborations between NASA and the U.S. Forest Service (USFS), along with growing participation from U.S. Geological Survey (USGS), Bureau of Land Management (BLM), and other federal land management agencies.
AEOIP has held several previous meetings: the first was a Joint Applications Workshop on Satellite Data for Natural Resource Management held April 29–May 2, 2019, reported in an Earth Observer article, “Summary of the USFS–NASA Joint Applications Workshop on Satellite Data for Natural Resource Management.” The group met again virtually in 2020 during PitchFest. In 2022, a virtual workshop on Integrating Remote Sensing Data for Land Management Decision-Making took place March 23–24, 2022. In 2023, the AEOIP workshop took place April 25–27, 2023, with a hybrid format – the in-person participants met at the USFS Geospatial Technology and Applications Center (GTAC) in Salt Lake City, UT. The 2023 workshop focused on Addressing Land & Water Monitoring Needs Using Remote Sensing Data.
These workshops have been designed to build connections between participants across the research-to-applications spectrum with subject matter experts from a variety of federal agencies and other affiliations to continue to promote interagency collaboration within the Earth Observations (EO) applications field. This goal is accomplished using interactive panels and guided discussion sessions that highlight new tools and techniques, promote NASA EO data product uptake, and foster connections between data providers and data users.
2024 Workshop Overview
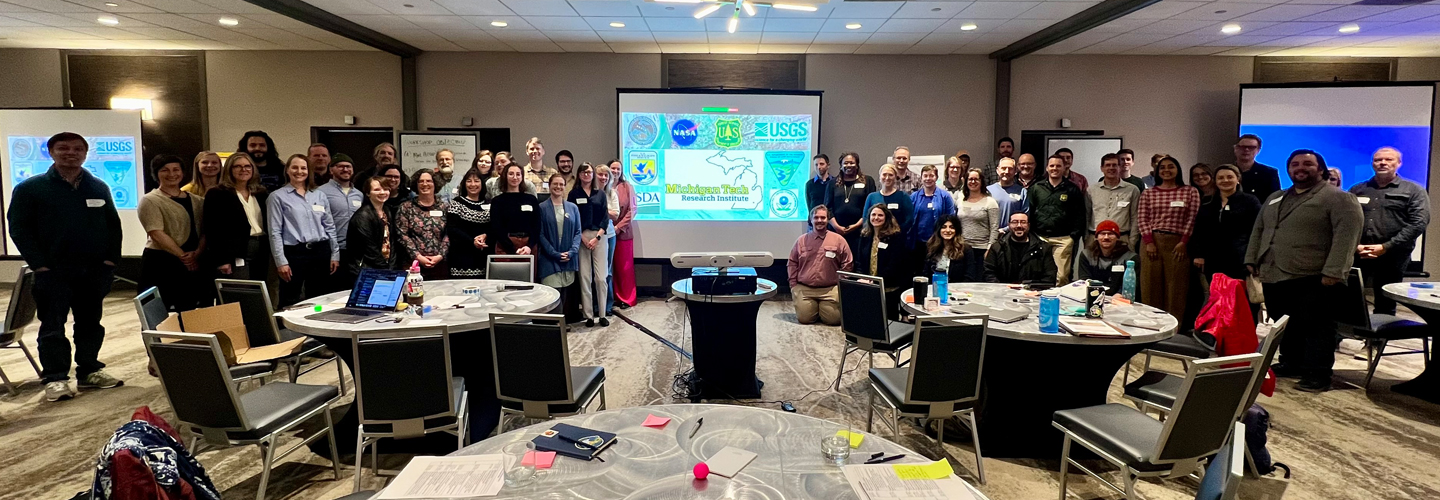
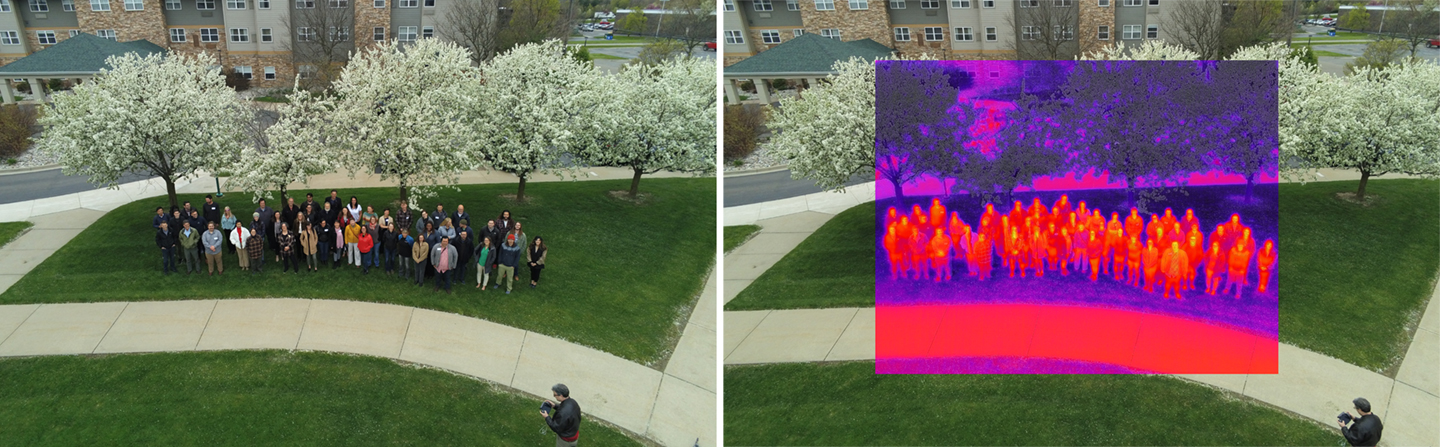
The most recent AEOIP workshop took place April 23–25, 2024, with a hybrid format. The in-person participants met in Ann Arbor, MI. The three-day event had a similar structure to its predecessors but with a wildland fire management theme. Altogether, 135 people participated in the workshop, with 77 attending in person and 58 virtually – see Photo 1.
Meeting Objectives
The workshop objectives were to:
- meet AEOIP’s mission by providing a forum for building new relationships among Earth observations data providers, users, and stakeholders;
- gather and/or codevelop “shovel-ready” ideas to better leverage Earth observations to meet science and management priorities of U.S. land and natural resource management agencies;
- gather needs for and/or develop educational materials to support the use of existing EO training resources for fire management; and
- gather ideas for the 2025 workshop and other AEOIP activities.
Breakout Sessions
A large segment of this workshop was dedicated to four concurrent topical breakout sessions – referred to in this report as Breakout Sessions A–D. The topics covered in each breakout session are listed below, along with the name(s) of those who facilitated discussion.
- Breakout Session A: Fuels, Wildland Fire Emissions, Carbon & Climate – Andy Hudak [USFS] and Edil Sepulveda Carlo [NASA’s Goddard Space Flight Center (GSFC)/Science Systems and Applications Inc. (SSAI)];
- Breakout Session B: Prescribed Fire Planning & Management – Nancy French [Michigan Tech Research Institute (MTRI)], Birgit Peterson [USGS], and Jessica Meisel [University of Idaho];
- Breakout Session C: Fractional Vegetation Cover Products & Decision Making – Tim Assal and Jake Slyder [both U.S. Department of Interior, BLM], and Liz Hoy and Amanda Armstrong [both at GSFC]; and Alexis O’Callahan [University of Arkansas].
- Breakout Session D: Post-fire Effects & Recovery: Assess, Predict, Remediate, and Monitor – Mary Ellen Miller [MTRI].
All of the breakout groups met on each day of the meeting. On the morning of the first day, the facilitators of each group gave brief “elevator pitches” about each breakout topic, and participants selected a topic for focus. After that, a block of time each day was dedicated to breakout activities and discussions. Participants were asked to focus on different aspects of the topic each day. In the afternoon of the first day, each group focused on identifying needs and challenges in the area being discussed – with a brief report-out at the end of the day. On the afternoon of the second day, the focus was on data availability and solutions – i.e., finding ways to overcome obstacles to making data more readily available to users – again with a brief report- out at the end of the day. On the morning of the third day, there were topical presentations. Each group worked to synthesize their three days of discussions and chose a representative to give a summary report during the closing plenary later that morning.
Workshop Summary
The remainder of this article presents highlights from each day of the workshop. This includes the most important presentations given during the meeting and those given during the breakout sessions. The report also includes highlights from training breakouts given on the second day of the workshop and a summary of a prescribed fire field trip, which took place the day before the workshop and visited two locations – see Optional “Field Trip” for AEOIP Workshop Participants to learn more.

Optional “Field Trip” for AEOIP Workshop Participants
On April 22, 2024, an optional field trip was offered that featured two sites demonstrating prescribed fire in Michigan. For the first stop on the trip, Kevin Butler [Washtenaw County—Natural Areas Preservation Program Stewardship Supervisor] gave a tour of a prescribed fire site in Park Lyndon, a county park in the northwest part of Washtenaw County, MI. The park is being restored to maintain native species using prescribed fire as invasive species control. The intent of these efforts is to restore oak meadows and preserve over 500 species of plants across fens, marshes, ponds, forest, and prairie lands.
On the second leg of the trip, Tina Stephens [City of Ann Arbor—Volunteer and Outreach Coordinator] led a tour of Furstenberg Nature Area, in the city of Ann Arbor, MI. She highlighted the importance of prescribed burning to achieve ecological benefits. The 0.15-km2 (38-acre) park contains wetlands, woodlands, prairie, and oak savanna. Since the mid-1990’s, Natural Area Preservation staff and volunteers have maintained those ecosystems through controlled burns and invasive shrub removal. The second tour stop included a small prescribed fire demonstration – see Photo 2.

DAY ONE
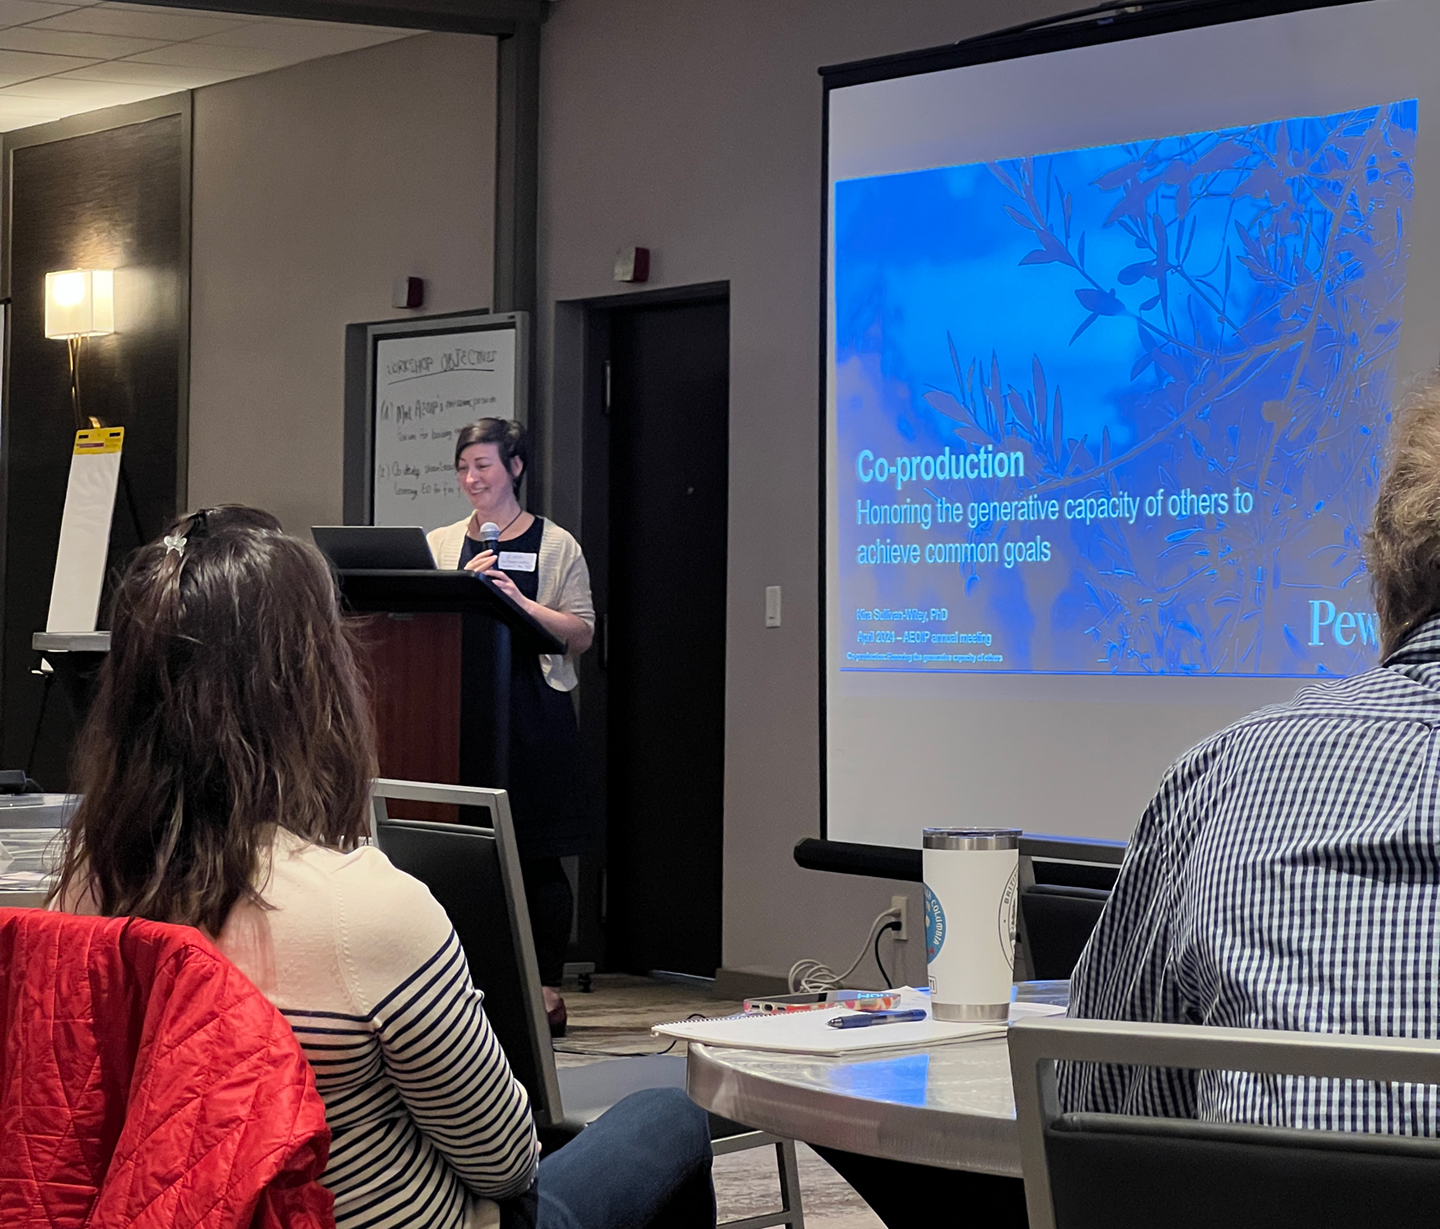
On the first day, Kira Sullivan-Wiley [Pew Institute] gave a plenary presentation, in which she discussed the value of coproduction, which in the context of AEOIP can be described as honoring the generative capacity of others as a means of optimizing the use of Earth by natural resource managers for decision making – see Photo 3. The benefits of this approach include cost reduction, tracking new ideas, and empowering marginalized voices.
The first block of breakout sessions also occurred during the afternoon of the first day, along with a short report-out. In light of the keynote discussion on coproduction, deliverables from this meeting’s breakout sessions can be seen as coproduced, new or improved conduits between NASA and land-managing entities.
After the keynote, representatives of government agencies (NASA, USFS, and BLM) presented their respective agency’s perspectives. The manager of a nearby state park in Michigan followed with a local perspective. A series of short presentations in the late afternoon featured various program highlights from NASA’s Earth Science Division, which are not detailed in this report – see workshop agenda for list of programs and speakers.
Notable Presentations
In addition to Kira Sullivan–Wiley’s keynote (described above), Christina Moats-Xavier [NASA Headquarters, Earth Action Program—Program Manager for Mission Engagement] shared NASA’s perspective, focusing on NASA’s Earth Science-to-Action strategy, which aims to increase the impact of scientific data. NASA’s Applied Science Program is now included under the broader umbrella of the new Earth Action program element of NASA’s Earth Science Division. This strategy has three pillars: 1) scaling existing efforts; 2) building bridges; and 3) focusing on the user. By collaborating with NASA, AEOIP can address real-world challenges to develop solutions that benefit society. Overall, the presentations on the first day highlighted the importance of collaborative, user-centered approaches and community engagement in addressing environmental challenges.
Everett Hinkley and Frenchy Morisette [both USFS] provided a practitioner’s perspective. They discussed USFS efforts to address climate adaptation, wildfire management, and incorporation of Indigenous traditional ecological knowledge. They also emphasized the application of artificial intelligence/machine learning (AI/ML) for mapping and remote sensing tools.
Both Jake Slyder and Tim Assal described their respective government agency’s management of vast (mostly western) land areas and use of remote sensing for post-fire emergency stabilization and integration with the Assessment, Inventory, and Monitoring (AIM) program.
Kevin Butler offered more of a local perspective as he discussed land stewardship in Michigan. He emphasized the importance of community involvement and respecting natural ecosystems, especially fire-dependent ones, at the local level.
DAY TWO
The presentations on the second day of the workshop highlighted the opportunities that Earth observing satellite data presents for natural resource management applications. Five presenters contributed to the panel discussion, titled “Communicating and Soliciting End User Needs: Past, Present and Future.” The second – longer – block of breakout sessions also occurred with a short report-out at the end of the day. A poster session ran concurrently with the report-outs. While this session is not described in this report, it afforded participants an opportunity to showcase their Earth observation related projects and/or interact with their peers. Highlights from the day follow below.
Notable Presentations
Pontus Olafsson [NASA’s Marshall Space Flight Center] and Natasha Sadoff [NASA HQ—Satellite Needs Program Manager] presented on the Satellite Needs Working Group (SNWG), which provides a coordinated approach to identify and communicate federal satellite Earth observation needs and develop solutions based on Earth observation data. The speakers explained that as part of this effort, SNWG facilitates a biannual survey to all civilian federal agencies. SNWG provides federal agencies a path to coordinate Earth observing needs and a mechanism to develop actionable solutions for decision makers. Solutions cover thematic areas, including air quality, land use/land cover, and water resources. They noted that NASA is also making a greater effort to engage with agency partners in the co-development of new solutions that are useful, accessible, and actionable.
Alison York [University of Alaska Fairbanks] spoke about the Joint Fire Science Program (JFSP) and Fire Science Exchange Network (FSEN). JFSP’s main function is to maintain and grow a data repository and community based on fuels, fire behavior, fire ecology, and human dimensions. The goal is to help enable informed, actionable change by policy makers and land managers with the best available scientific support. York then discussed the FSEN, which acts as a mechanism to collate research needs from a collection of regional fire exchanges. The syntheses of data and data needs provides more effective understanding and management of fire.
Training Breakout Session Takeaways
On the second day, the four breakout sessions met, beginning with four short (25-minute) trainings. The speakers each gave half-hour presentations, which they repeated twice during the hour dedicated to the training breakouts, allowing participants to engage in two of the training breakouts if desired.
Pete Robichaud [USFS] discussed training opportunities for modeling post-fire hydrological response using the Water Erosion Prediction Project (WEPP). Soil burn severity is first assessed with remote sensing and then field verified. A subsequent soil burn severity map can be created to give details on physical features, e.g., ash color, ash depth, fine roots, soil structure, water repellency, and ground cover. This resource can be used to create a risk assessment table of probability and consequence parameters. Following the risk assessment, the Forest Service Water WEPP suite of tools can be used to model the landscape. The WEPP suite includes both hillslope and watershed modeling tools. The final step in the Burned Area for Emergency Response (BAER) program is to implement and monitor solutions.
Rupesh Shretha [Oak Ridge National Laboratory (ORNL), Distributed Active Archive Center (DAAC)] discussed the Earth Observing System Data and Information System (EOSDIS) DAACs, which are collocated with centers of science discipline expertise and archive and distribute NASA Earth Science data products. The ORNL DAAC archives and distributes terrestrial ecology data, particularly data from field and airborne campaigns. The Terrestrial Ecology Subsetting & Visualization Services (TESViS) – formerly MODIS–VIIRS subsets tool – provide subsets of satellite data in easy-to-use formats that are particularly valuable for site-based field research. The Ecological Spectral Information System (ECOSIS) integrates spectral data with measurements of vegetation functional traits (i.e., species, foliar chemistry). ECOSIS allows users to submit spectral data and return a citable DOIs. ECOSIS also provides users application programming interface (API)-based methods to retrieve thousands of field spectra.
Jake Slyder discussed the use of remote sensing for efficient resource management over vast tracts of land with limited human and financial resources. He explained that while the vast collection of remotely sensed data makes it challenging to effectively exploit, Google Earth Engine (GEE) has become an important tool in leveraging remotely sensed information to address BLM management questions. The Change and Disturbance Event Detection Tool (CDEDT), a GEE-based application, allows users to detect and develop vector geospatial products to identify changes and disturbances to surface cover between two dates of observations [10 m (~33 ft) resolution] from the European Space Agency’s (ESA) Copernicus Sentinel-2 mission. Slyder said that the Version 2 (V2) beta product includes the National Agriculture Imagery Program (NAIP) and ESA Copernicus Sentinel-1 SAR Imagery. CDEDT supports a range of BLM monitoring applications, including disaster events, energy development, forest disturbances, and seasonal patterns and processes (e.g., vegetation, water cover). The CDEDT tool is publicly available and does not require any license or special software.
DAY THREE
The third day was dedicated to the final block of the breakout sessions and a final plenary, where a representative from each breakout group gave five to seven minute summaries of their discussions throughout the meeting. The overview was followed by a meeting wrap-up and adjournment. The sections below summarize the topical presentations given on day three and encapsulate the three days of discussions.
Breakout Session A: Focus on Carbon
The carbon breakout aimed to inform participants about carbon-related EO initiatives and spark discussion about user needs.
Aaron Piña [USFS] spoke about the Forest Service’s broad base of applied research that spans wildfire weather and behavior to dynamics of the smoke produced – see Photo 2. Recent assessments have been made for wildland fire, controlled burn smoke, and remote air monitors. Piña spoke about Bluesky Playground, a community-driven tool aimed at providing the public with information on fuels and smoke modeling. These data have been used to identify important indicators for fires and fuels (e.g., vertical plume structure).
Piña then discussed a fusion Fire Radiative Power (FRP) data product [MOD19A2] that combines data from four sources – the Visible and Infrared Scanner (VIRS) on the former Tropical Rainfall Measuring Mission (TRMM), the Visible Infrared Imaging Radiometer Suite (VIIRS) on the Suomi National Polar-orbiting Partnership (Suomi NPP), the Moderate Resolution Imaging Spectroradiometer (MODIS) on the Terra and Aqua platforms, and the Multi-Angle Implementation of Atmospheric Correction (MAIAC) aerosol product.
A group discussion followed Piña’s presentation, during which several participants expressed concerns about the continuity of VIIRS and the other observations that are used in the fusion FRP product. Another topic of discussion was the potential of remotely sensed data to improve the characterization of duff (decaying vegetation) in satellite data products. NASA’s Tropospheric Emissions: Monitoring of Pollution (TEMPO) mission data have also been used to characterize the vertical structure of smoke plumes; however, these efforts have thus far been limited by personnel knowledge gaps as well as raw data formats.
Chris Woodall [USFS] discussed the growing emphasis on carbon metrics for a variety of sectors and applications. The USFS wants to work in tandem with other entities, especially federal organizations, to maximize efforts and workstream. USFS is seen as the in-situ carbon observer, while NASA is the remote sensor, and USGS is the lateral flux assessor. The coproduction of knowledge and data regarding carbon among these agencies is an iterative process. The USFS investment in improved Measurement, Monitoring, Reporting, and Verification (MMRV) of greenhouse gas (GHG), for example, can expand soil and land-use inventories to improve alignment with remote-sensing platforms. Challenges to implementing this cooperative approach to collecting carbon metrics include creating a workflow that incorporates a wealth of existing resources and accruing data from multiple federal agencies concerned with ecosystem carbon management to create scalable GHG knowledge. The coproduction, iteration, and dissemination of knowledge should be a major focus with all interested parties – not just the aforementioned federal agencies.
Sydney Neugebauer [NASA’s Langley Research Center] and Melanie Follette-Cook [GSFC] discussed NASA’s capacity building initiatives, which are aimed at developing and strengthening an organization or community’s skills, abilities, processes, and resources to enable them to survive, adapt, and thrive in a fast changing world. The DEVELOP, Indigenous Peoples Initiative, and SERVIR programs (all under the Earth Action program element) work towards capacity building through co-development projects, collaborative training, and data availability. The NASA Applied Remote Sensing Training (ARSET) program has offered over 100,000 training sessions since it was created in 2009 – primarily to international participants. The trainings are free and virtual for individuals interested in using remotely sensed data in a diverse suite of environmental applications. All content is archived. NASA’s Carnegie-Ames-Stanford Approach (CASA), which has contributed to global carbon dioxide (CO2) sequestration datasets for the past 30-years, will be upgraded to incorporate CO2 fluxes. The NASA cooperative interagency U.S. Greenhouse Gas Center is also looking for feedback on its beta portal.
The group discussions that followed identified and addressed AEOIP needs and questions (e.g., obtaining carbon and smoke emission estimates from prescribed wildfires and ensuring global satellite fire record continuity). Participants also identified the need for near real-time active fire and burned area mapping at medium scale and for continuity of these measurements. The group is interested in engaging federal agency end users to obtain feedback on their capacity to facilitate and elucidate capacity needs. Prominent challenges going forward include preparing for the end of the Terra and Aqua missions, which will include the decommissioning of MODIS, and ensuring the continuity of VIIRS, which is being used to allow for continuity of MODIS data products. One of the greatest unknowns identified was being able to determine wildfire fuel conditions in near-real time, and the ability to constrain estimates of fuel attributes to a focused fire event.
Andy Hudak discussed the diverse coalition of practitioners who manage more than just carbon (e.g., forest health, harvest, fires). Of the diverse group of stakeholders, Indigenous Tribes are at the cutting edge using lidar for carbon assessment. While Forest Inventory and Analysis plots are used for bias correction, they do not provide synoptic coverage for accurate carbon assessments. Lidar and other passive remote sensing satellite data provide a way to address this need. Tree lists are also highly valuable to carbon and forest managers for diverse applications. Application-specific metrics (e.g., timber volume, basal area, and density) can be weighted based on stakeholder priorities, as quantified from stakeholder surveys, to optimize data products.
Sarah Lewis [USFS] explained the needs and applications of Earth observations in a post-fire environment. The information needs to be available quickly, integrated into effective decision-making tools, and delivered in a functional product. Information is needed on water, soils, vegetation recovery, and habitat – all major metrics of interest in a data product. Areas of concern during post-fire management for water quality and erosion control include ash and soil–water transport. In addition, major concerns exist for timely data acquisition and processing, along with the fate and transport mapping of post-fire ash. Data products would benefit from end-user input to optimize relevance and accessibility of decision ready maps, models, and trusted recommendations.
The group identified the need for heavy carbon fuels and duff estimates for ecological modeling, which is critical to achieving a better understanding of smoke and carbon emissions. The heavy carbon fuel and duff estimates may be achieved through multiple means but may be most accessible currently through a new layer in the LANDFIRE database. They also identified the need for more post-fire data for model training and integration of active remote sensing data. Finally, the group identified the need for more regulation and research on prescribed fire emissions and disturbance.
Breakout Session B: Prescribed Fire
This breakout session focused on prescribed fires. Some of the major objectives and needs that emerged from this session were improved access to data, cultivating deeper public trust in the practice, creating networks of future coproduction, and assessing end-user needs, burn maps, and securing funding. The discussions emphasized knowledge and awareness gaps as a major impediment to prescribed fire implementation. Uniform capacity building is an ideal approach to engage stakeholders at a reference level appropriate to their background to optimize equity and efficacy.
Another issue that came up during discussion is that land management professionals do not have the time or resources to stay current with data sources and analysis techniques. The participants suggested the creation of a “Fire Science Library” as an iterative data tool to organize and present fire knowledge in an actionable and streamlined manner for public land managers. The interface would allow practitioners to filter unique categories (e.g., role, scope, region, ecosystem type, weather, agency affiliation) to provide the ability to search, modify, and maintain fire science knowledge as it evolves. This interface would also provide provenance through references to papers, justification for methods, and case studies. The library would guide and streamline data collection, analyses, and interpretation workflows that are needed for holistic prescribed fire planning and monitoring based on tangible needs from fire professionals.
The virtual library tool would provide a user with a fire-science knowledge graph, which is an organized representation of real-world entities and their relationships that could quickly connect fire-related management with current research questions concerning data products, processing methods, and data sources along with references and case studies. Information provided in the knowledge graph would need to be context specific but not overly prescriptive to avoid constraining users to a rigid workflow that is more common in basic data portals. Knowledge graphs are associated with semantic web technology that forms a modern version of a database. The tool establishes relationships between entities that promote new relationship discovery, search, and modification. It also provides a foundation on which other applications can be built, such as prescribed fires in the southeast and incorporating drone data. Focusing on prescribed fire may help to bound the initial product development but leave the door open for eventual expansion for wildfire.
The group identified objectives moving forward, including the need to finalize the main set of prescribed fire management questions (e.g., planning, implementation, pre/post monitoring), establish user personas based on known representatives and gaps, engage the Earth Science Information Partners (ESIP), identify cluster members (e.g., subject matter experts from local and federal agencies, private industry, and academia/research), and investigate additional funding sources. (Clusters are agile working groups within ESIP formed to focus on specific topics.)
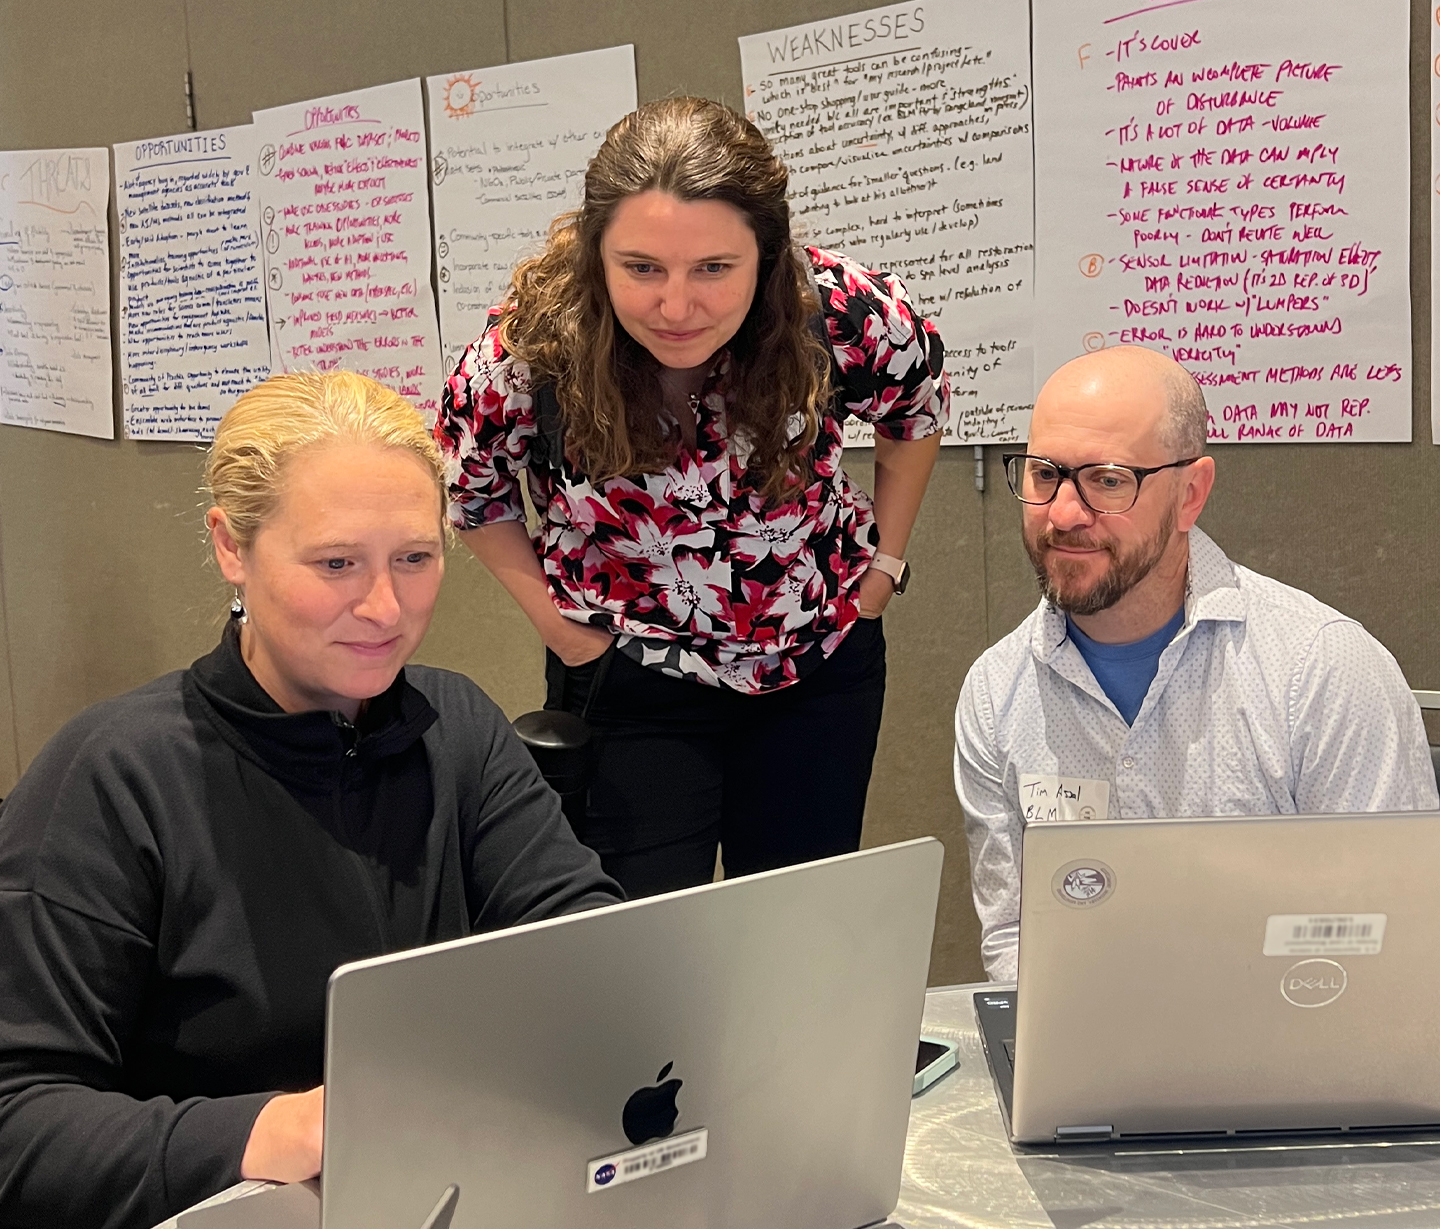
Breakout Session C: Fractional Vegetation Cover
This breakout session focused on fractional vegetation cover (FVC) – see Photo 4. The presenters introduced three large FVC assessment efforts, and the participants contributed to a Strengths, Weakness, Opportunities, and Threats (SWOT) analysis of FVC products intended to improve the use of this data by decision makers – see Table.
Tim Assal discussed the BLM’s Assessment Inventory and Monitoring (AIM) strategy. He explained that AIM has nearly 60,000 monitoring locations across the terrestrial uplands, aquatic systems, and riparian and wetland habitat of the U.S., and the data collected are being used for monitoring and restoration activities. Assai added that integration of remote sensing data with field plot data enables the generation of continuous datasets (e.g., FVC that can relate field plot-level indicators to those based on remote-sensing). He also reported that FVC data are currently being used to address numerous management decisions.
Sarah McCord [USDA] discussed V3 of the Rangeland Analysis Platform (RAP). McCord explained that V3 uses vegetation cover and rangeland production data to monitor these parameters. The model also uses species composition data. She explained that there are approximately 85,000 training/validation locations across the U.S. that have been incorporated into the modeling process. She said that enhancements to future versions of RAP are expected as data from new satellite instruments, field plots, and deep learning (i.e., application of AI/ML techniques) are all incorporated into the model. McCord chairs a working group that is actively investigating sources of error and uncertainty within individual and across different FVC products.
Matt Rigge [USGS Earth Resources Observation and Science (EROS) Center] discussed V3 of the Rangeland Condition Monitoring Assessment and Projection (RCMAP), which will provide current and future condition using Landsat time series. Data available includes cover maps and potential cover. The platform uses various training data in addition to AIM plot data. In the future RCMAP plans to incorporate data from synthetic NASA-Indian Space Research Organization Synthetic Aperture Radar (NISAR), from NASA’s Earth Surface Mineral Dust Source (EMIT) mission, and from convolution neural network-based (CNN) algorithms.
Bo Zhou [University of California, Los Angeles (UCLA)] discussed V2 of the Landscape Cover Analysis and Reporting Tool (LandCART). V3 will be different and coming in the future. He explained that the BLM uses V3 to make legally defensible decisions. He then discussed the training data, which come mostly from AIM. The training dataset includes 71 Level-4 (L4) Ecoregions, as defined by the U.S. Environmental Protection Agency, with at least 100 observations. Zhou noted that these training data are used to define spatial extent, the temporal extent is defined by available satellite imagery, and uncertainty estimates are based on CNN and random forest (RF) machine-learning algorithms.
Eric Jensen [Desert Research Institute] discussed how ClimateEngine.org uses cloud-based tools, such as GEE, to access, visualize, and share Earth observation datasets to overcome computational limitations of big data in a real-time environment. It encompasses over 85 datasets, including RAP and RCMAP, and the group is working to add LandCART. Two core functionalities of the ClimateEngine app are producing maps and making graphs. Jensen provided a brief demonstration of the app using a juniper removal project in sage grouse habitat in southern Idaho.
| Strengths • Tools available for accessing and processing data are user-friendly and widely accessible, making it easy to compile, use, and display data for users of all expertise levels across a range of management activities. • Tools provide a comprehensive view of an area, offering both current and retrospective insights that are highly regarded by the restoration community. • Tool format supports integration of new datasets, ensuring inclusivity and consistency over time and space. |
Weaknesses • Training data exhibits spatial and temporal biases. • Training data is biased towards federal data, lacking global representation. • Sensors have limitations for both temporal and spatial accuracy. |
| Opportunities • Managers can use these tools to make informed decisions and evaluate the effectiveness of their treatments. • Additional training (e.g., training in how to process new data types, such as hyperspectral data) could institutionalize remote sensing and reach more end users. • Future expansion of AI/ML techniques and cloud-based services could reduce error, enhance data quality, and increase user reach. |
Threats • Stability of funding could threaten continuity of measurements. • Falling into a “one size fits all” mentality could stifle innovation. • Variation in land management organizations’ willingness to update data and lack of cohesion could prevent obtaining full potential of FVC. • Transition from research to operations could hinder collaboration and tool development and weaken the community of practice. • Poor performance, misuse of information, and data sovereignty could diminish the community’s trust in the tools. • Rapid technological advancements could displace smaller businesses. |
Breakout Session D: Post-fire Effects and Recovery
This session focused on assessing, predicting, remediating, and monitoring areas in the aftermath of fires. The focus was on “shovel-ready” ideas, such as improving operational soil burn severity maps to connect post-fire ground conditions and soil properties. The participants highlighted the need to leverage information (e.g., active fire thermal data) to better detect changes in post-fire cover and soil properties. Such information would be beneficial to USFS’s Burned Area for Emergency Response (BAER) program as well as to researchers, data providers, decision makers, and community leaders. The group discussed steps that would aid in this collaboration (e.g., incorporating thermal imagery into mapping soil burn severity, developing and validating products, getting first-look data to field teams, monitoring threats by conducting rapid burn severity assessment before official soil burn severity maps are made available, and sharing outputs quickly with decision makers).
The breakout participants also noted the challenge of ash load mapping, which they suggested might be constrained by using information on pre-fire fuels (e.g., biomass, understory, and canopy vegetation) to constrain potential ash production. Derived information products [e.g., Normalized Difference Vegetation Index (NDVI), Leaf Area Index (LAI), LANDFIRE fuels layers, and RAP] may improve this process. The group noted the limitations of the VIIRS instrument for mapping fire duration and soil heating. The group proposed adding supplemental data through the use of National Infrared Operations (NIROPS) raw infrared imagery – see Figure 1.
Fire tools currently available – and under consideration for improving maps – include VIIRS active fire data through NASA’s Fire Information for Resource Management System (FIRMS), fire event tracking through NASA’s Earth Information System Fire Event Data Suite (FEDS), the burn severity prediction model at MTRI, and Rapid Differenced Normalized Burn Ratio Mapping at the University of Wisconsin, Madison. The group identified VIIRS L1 image capture to detect smoldering fires as a potential improvement in wildfire characterization. The group also suggested more frequent observations of moderate resolution satellites, GOES Integration [0.5–2 km (0.3–1.2 mi) spatial resolution], and comprehensive field data. They identified possible ways to improve post-fire soil burn severity maps (e.g., information on pre-fire fuels, soil characteristics, and thermal properties, such as fire heating, residence time, spread rate), optical characteristic (e.g., vegetation mortality, ash production), and lidar canopy metrics.
Presently, burn severity is assessed using a simple spectral index derived from remote sensing data, driven by necessity, data access, and computing power. The group presented the need to break this single number into ecologically meaningful components for better post-fire assessment and remediation. Improvements could involve incorporating additional information (e.g., peak soil temperature, heat residence time, and fuel moisture). Coupling atmospheric fire behavior models could address temporal gaps, necessitating high-spatial and temporal resolution thermal data sets.
The participants agreed that future strategies should include monitoring warmer areas and smoldering zones instead of just flaming fronts, as well as exploring temperature differences across burn severities. Additionally, post-fire assessments would benefit from using other spectral bands and post-fire Ecosystem Spaceborne Thermal Radiometer Experiment on Space Station (ECOSTRESS) products. They also added that access to more field information is crucial for scientific post-fire observations. Efforts are underway to make the SBS S123 survey system a national standard, though surveys currently reside with local units that have good record-keeping practices.
Conclusion
The 2024 AEOIP workshop addressed a wide range of geospatial data tool and training needs and forums. The meeting centered on coproduction of knowledge and community-of-practice building as key needs for the geospatial data topics. Participants identified capacity building – through awareness, accessibility, and utility of data and tools – as the top priority for processing and technological advancement initiatives.
The breakout session topics selected (e.g., carbon concentrations, wildfires, prescribed fires, and landscape dynamics) were chosen to promote dialogue between data users and scientists, leading to plans for action and change in data and tool utility in four areas of interest for land managers. Following the meeting, the organizers submitted a spreadsheet detailing the data and tool needs identified during the breakouts to the Earth Action Program. The SNWG has also been made aware of the most compelling needs that participants identified. The AEOIP believes that by bridging two groups – data users and research and development – it will be possible to bolster user provenance and efficacy of NASA resources moving forward.
Severin Scott
Washington State University
severin.scott@wsu.edu
Alan B. Ward
NASA’s Goddard Space Flight Center (GSFC)/Global Science and Technology (GST)
alan.b.ward@nasa.gov
Alexis O’Callahan
University of Arkansas
aocallah@uark.edu
Share
Details
Related Terms
Powered by WPeMatico