110 Years Ago: The National Advisory Committee for Aeronautics Founded
On March 3, 1915, the United States Congress created the National Advisory Committee for Aeronautics (NACA). Although the NACA’s founding took place just over 11 years after the Wright Brothers’ first powered flightfirst powered flight at Kitty Hawk, North Carolina, Congress took the action in response to America lagging behind other world powers’ advances in aviation and aeronautics. From its modest beginnings as an advisory committee, over the years, the NACA established research centers and test facilities that enabled groundbreaking advances in civilian and military aviation, as well as the fledgling discipline of spaceflight. With the creation of the National Aeronautics and Space Administration in 1958, the new agency incorporated the NACA’s facilities, its employees, and its annual budget. The NACA provided NASA with a strong foundation as it set out to explore space.
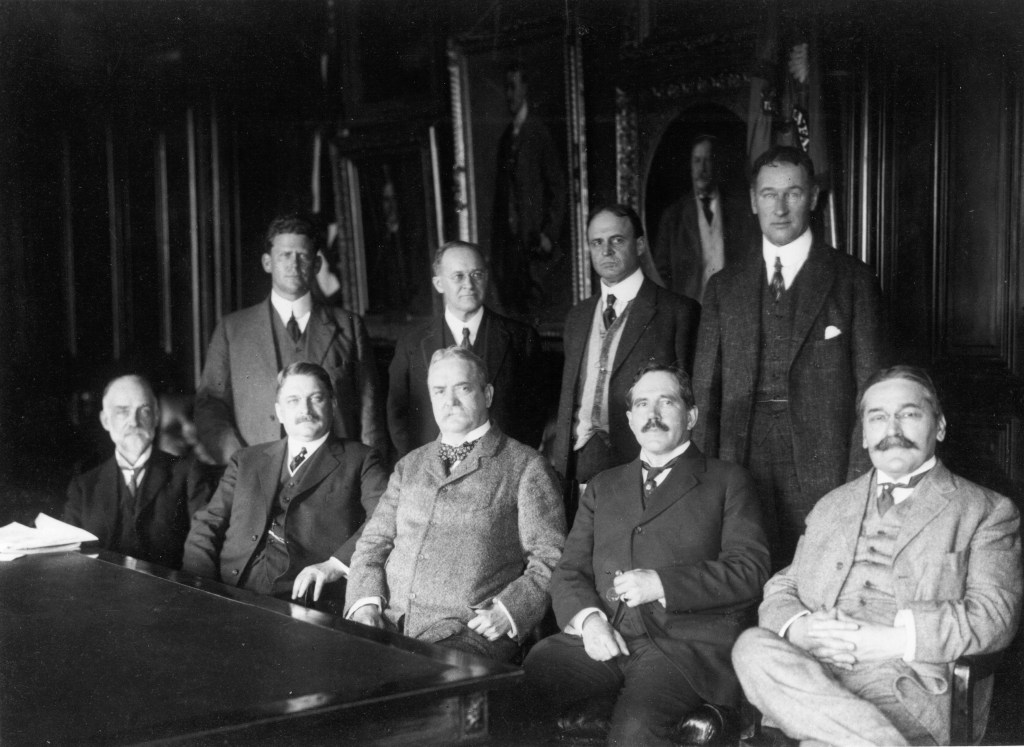
The first meeting of the National Advisory Committee for Aeronautics on April 23, 1915.
NASA
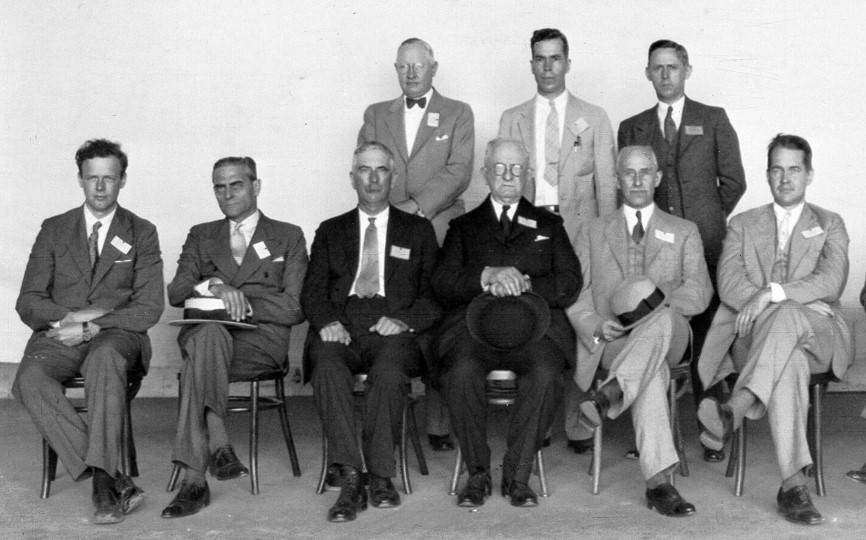
The NACA executive committee in 1934.
NASA
The Congressional action that created the NACA, implemented as a rider to the 1915 Naval Appropriations Bill, reads in part, “…It shall be the duty of the advisory committee for aeronautics to supervise and direct the scientific study of the problems of flight with a view to their practical solution. …”. In its initial years, the NACA fulfilled its intended role, coordinating activities already in place in the area of aeronautics research, reporting directly to the president. The committee, made up of 12 representatives from government agencies, academia, and the military, first met on April 23 in the Office of the Secretary of War in Washington, D.C. It established a nine-member executive committee to oversee day-to-day operations and spent the first few years establishing its headquarters in Washington.
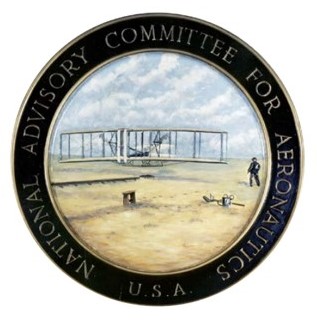
The committee’s logo, approved in 1941.
NASA
The committee’s seal, approved by presidential executive order in 1953.
NASA
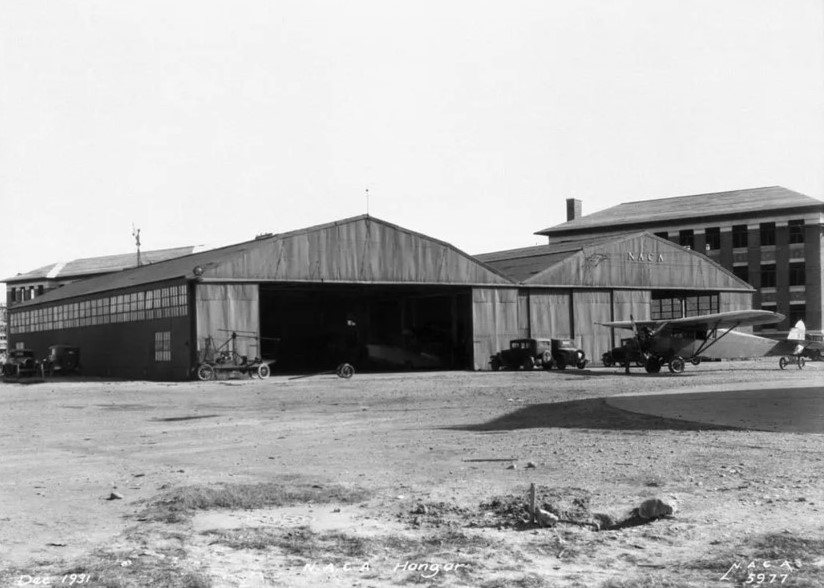
Hangars at the Langley Memorial Aeronautical Laboratory in Hampton, Virginia, in 1931.
NASA
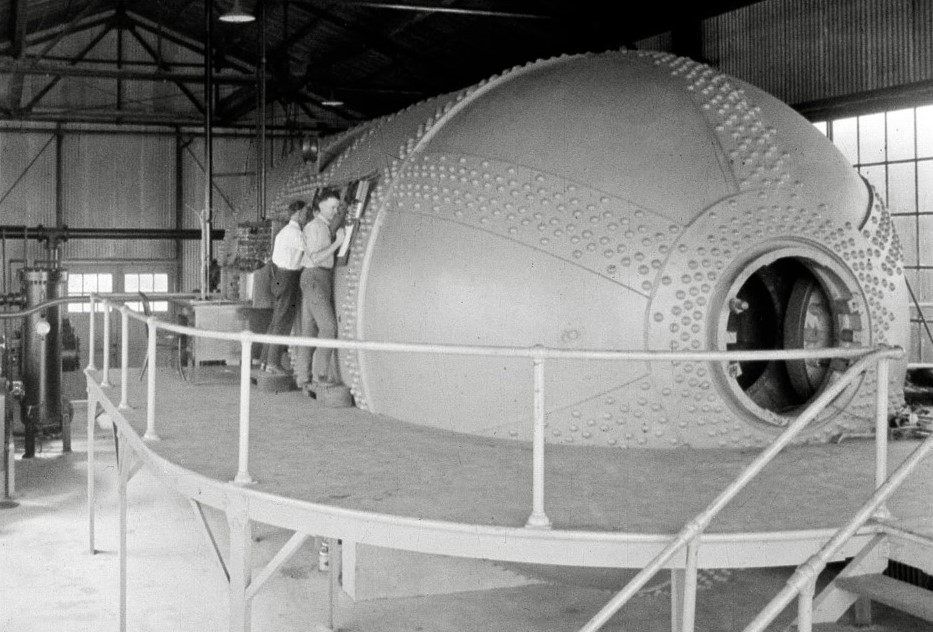
The Variable Density Tunnel at Langley.
NASA
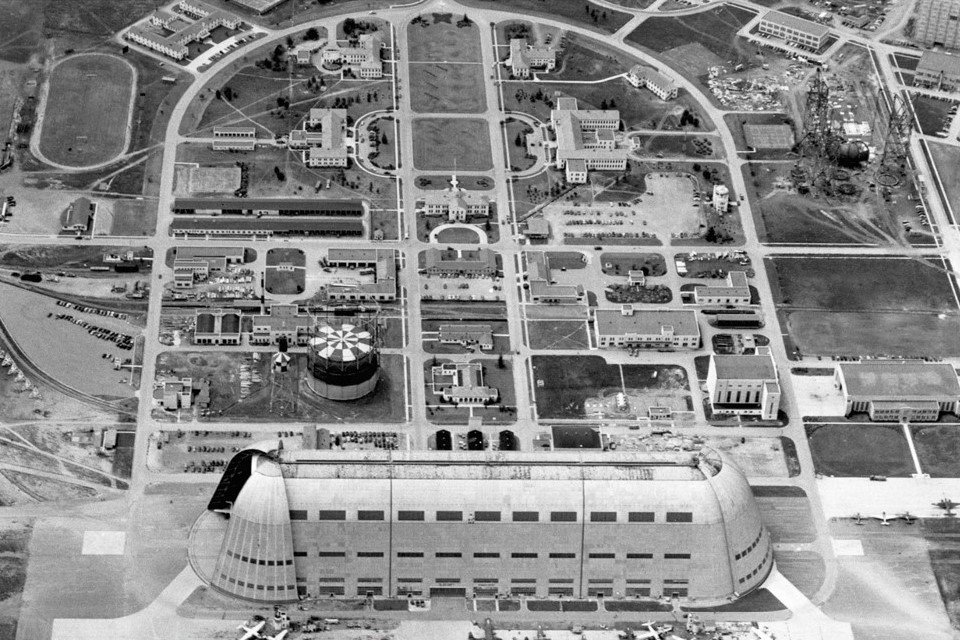
Aerial view of the Ames Aeronautical Laboratory in Sunnyvale, California, in 1944.
NASA
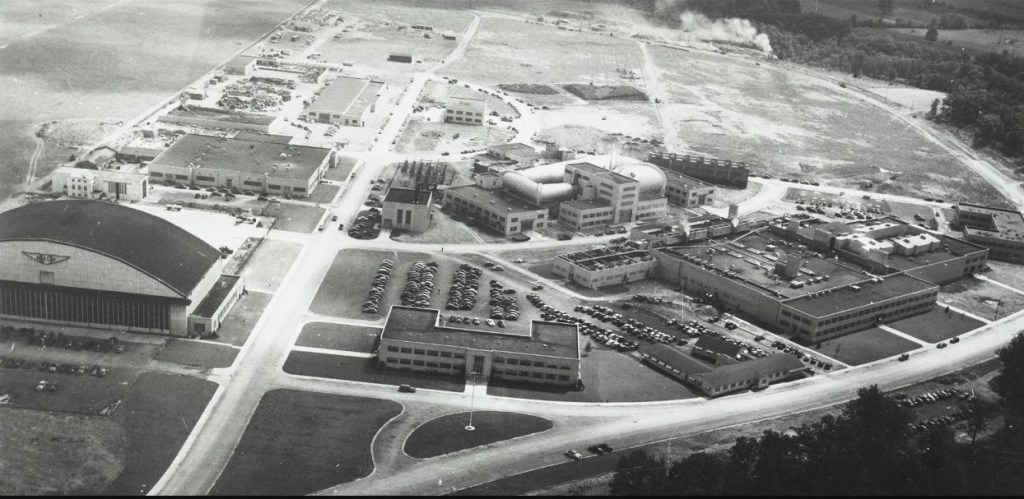
Aerial view of the Aircraft Engine Research Laboratory in Cleveland, Ohio, in 1945.
NASA
Within a few years, the NACA’s role began to expand with the establishment of research facilities. The Langley Memorial Aeronautical Laboratory, today NASA’s Langley Research Center, in Hampton, Virginia, opened on June 11, 1920. Over the next few decades, Langley served as a testing facility for new types of aircraft, using wind tunnels and other technological advances. The Ames Aeronautical Laboratory in Sunnyvale, California, today NASA’s Ames Research Center, opened in 1940 and the Aircraft Engine Research Laboratory in Cleveland, today NASA’s Glenn Research Center, in 1941. The three labs achieved many breakthroughs in civilian and military aviation before, during, and after World War II. The Cleveland lab, renamed the Lewis Flight Propulsion Laboratory in 1948, concentrated most of its efforts on advances in jet propulsion.
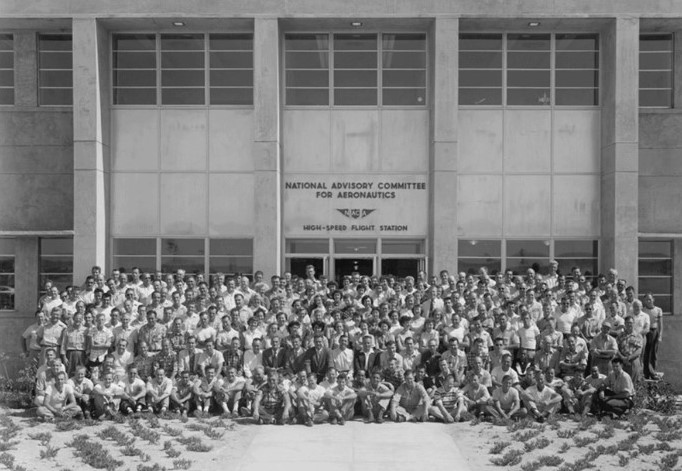
The NACA High-Speed Flight Station, now NASA’s Armstrong Flight Research Center, at Edwards Air Force Base in California’s Mojave Desert.
NASA
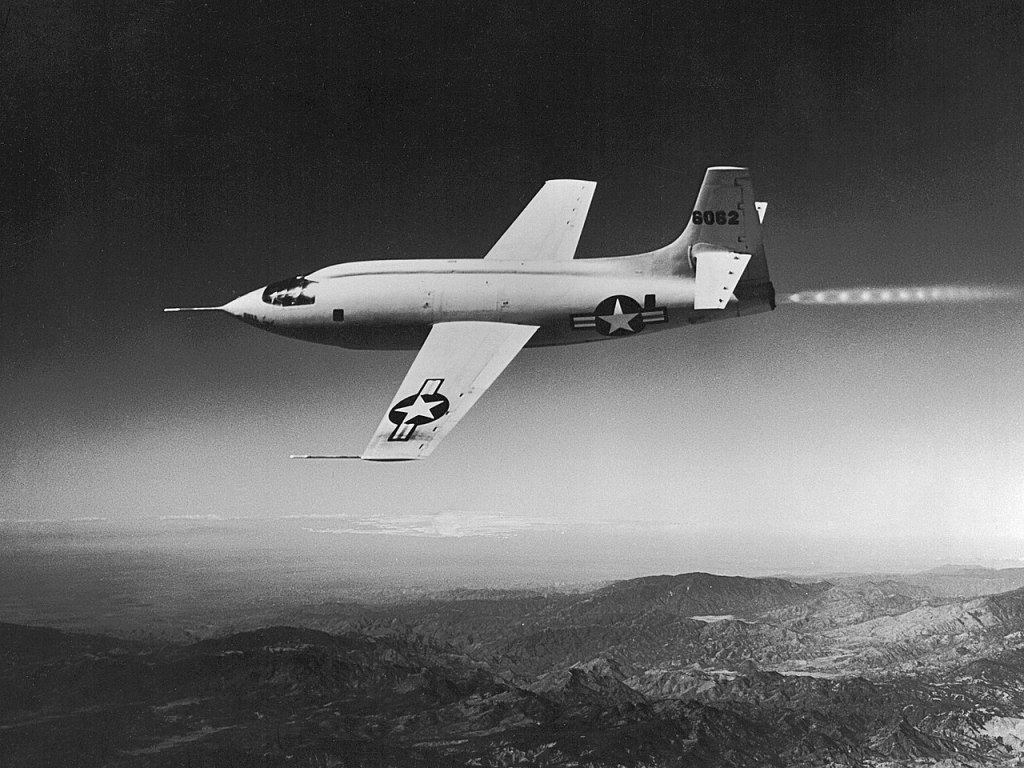
The Bell X-1, the first aircraft to break the sound barrier in 1947.
NASA
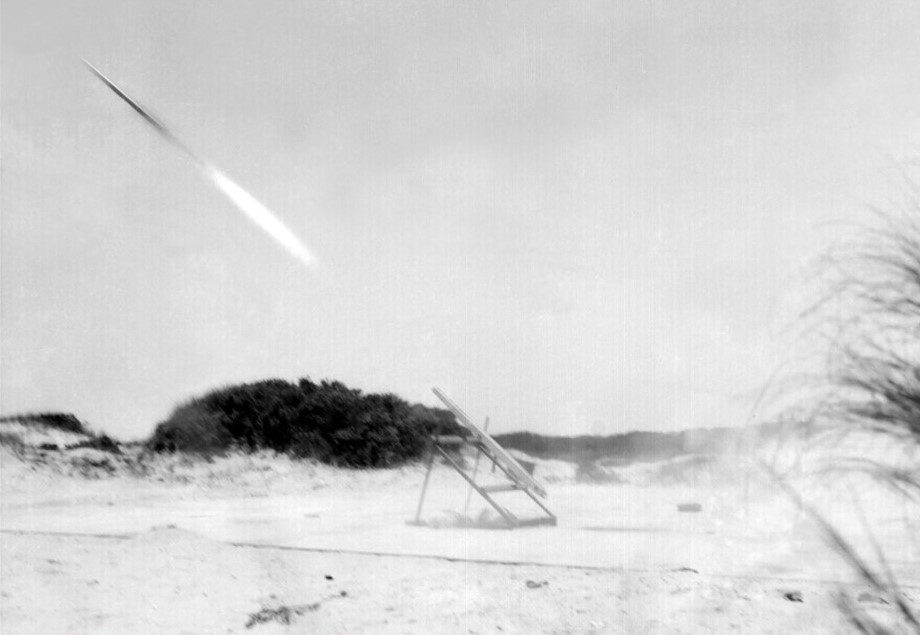
The first sounding rocket launch from the Pilotless Aircraft Research Station at Wallops Island, Virginia, in 1945.
NASA
After World War II, the NACA began work on achieving supersonic flight. In 1946, the agency established the Muroc Flight Test Unit at the Air Force’s Muroc Field, later renamed Edwards Air Force Base, in California’s Mojave Desert. In a close collaboration, the NACA, the Air Force, and Bell Aircraft developed the X-1 airplane that first broke the sound barrier in 1947. Muroc Field underwent several name changes, first to the High-Speed Flight Station in 1949, then in 1976 to NASA’s Dryden, and in 2014 to Armstrong Flight Research Center. In 1945, the NACA established the Pilotless Aircraft Research Station on Wallops Island, Virginia, now NASA’s Wallops Flight Facility, as a test site for rocketry research, under Langley’s direction. From the first launch in 1945 through 1958, the NACA launched nearly 400 different types of rockets from Wallops.
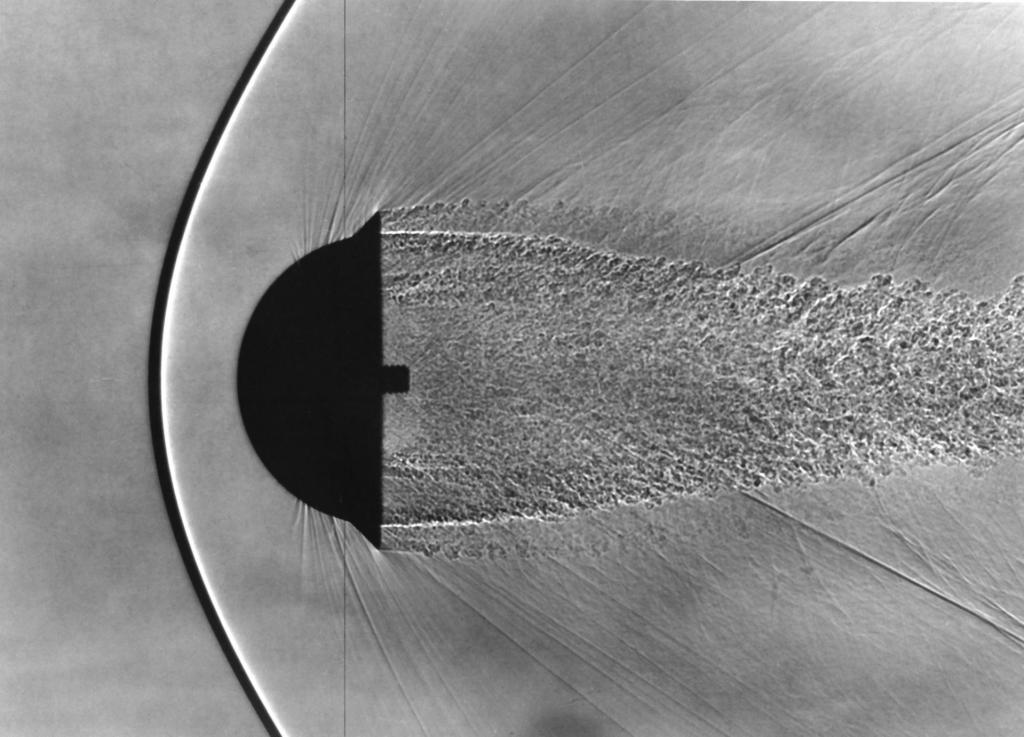
Shadowgraph of finned hemispherical model in free flight shows shock waves produced by blunt bodies.
NACA
Meeting of the NACA’s Special Committee on Space Technology in May 1958.
NASA
In the 1950s, the NACA began to study the feasibility of spaceflight, including sending humans into space. In 1952, NACA engineers developed the concept of a blunt body capsule as the most efficient way to return humans from space. The design concept found its way into the Mercury capsule and all future American spacecraft. Following the dawn of the space age in 1957, the NACA advocated that it take the lead in America’s spaceflight effort. The Congress passed, and President Dwight D. Eisenhower signed legislation to create a new civilian space agency, and on Oct. 1, 1958, NASA officially began operations. The new organization incorporated the NACA’s research laboratories and test facilities, its 8,000 employees, and its $100 million annual budget. Many of NASA’s key early leaders and engineers began their careers in the NACA. The NACA’s last director, Hugh Dryden, served as NASA’s first deputy administrator.
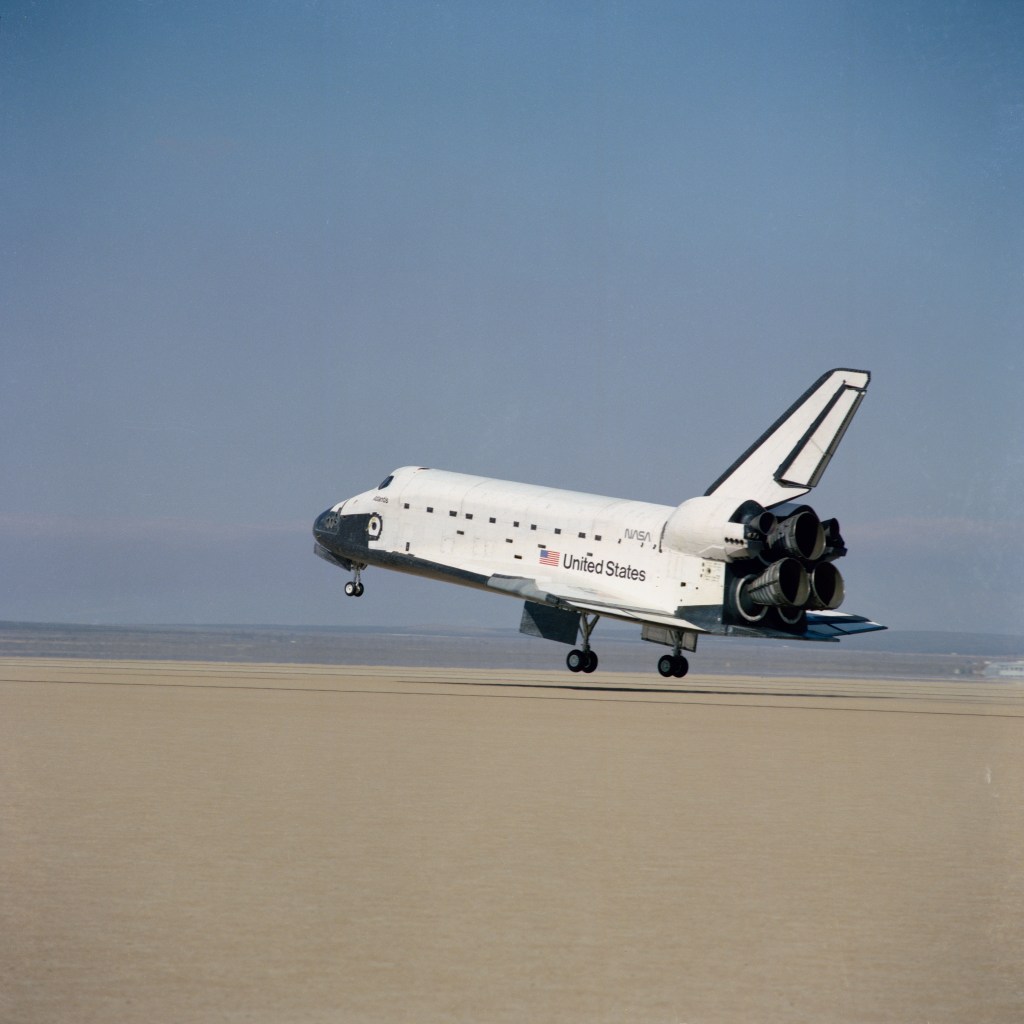
35 Years Ago: STS-36 Flies a Dedicated Department of Defense Mission
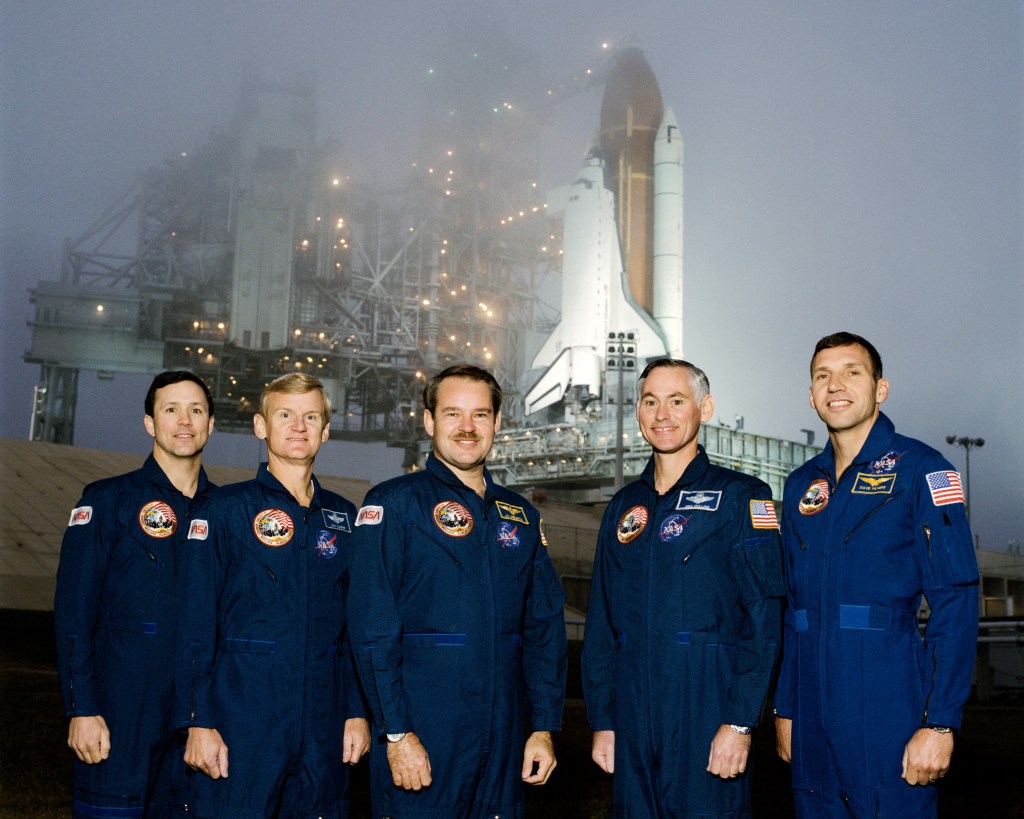
On Feb. 28, 1990, space shuttle Atlantis took off from NASA’s Kennedy Space Center in Florida on STS-36, the sixth shuttle mission dedicated to the Department of Defense. As such, many of the details of the flight remain classified. The mission marked the 34th flight of the space shuttle, the sixth for Atlantis, and the fourth night launch of the program. The crew of Commander John Creighton, Pilot John Casper, Mission Specialists Mike Mullane, David Hilmers, and Pierre Thuot flew Atlantis to the highest inclination orbit of any human spaceflight to date. During the four-day mission, the astronauts deployed a classified satellite, ending with a landing at Edwards Air Force Base in California.
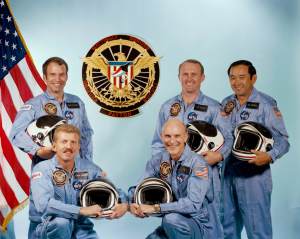
The STS-36 crew, from left, was Mission Specialist Pierre Thuot, left, Pilot John Casper, Commander John Creighton, and Mission Specialists Mike Mullane and David Hilmers.
NASA
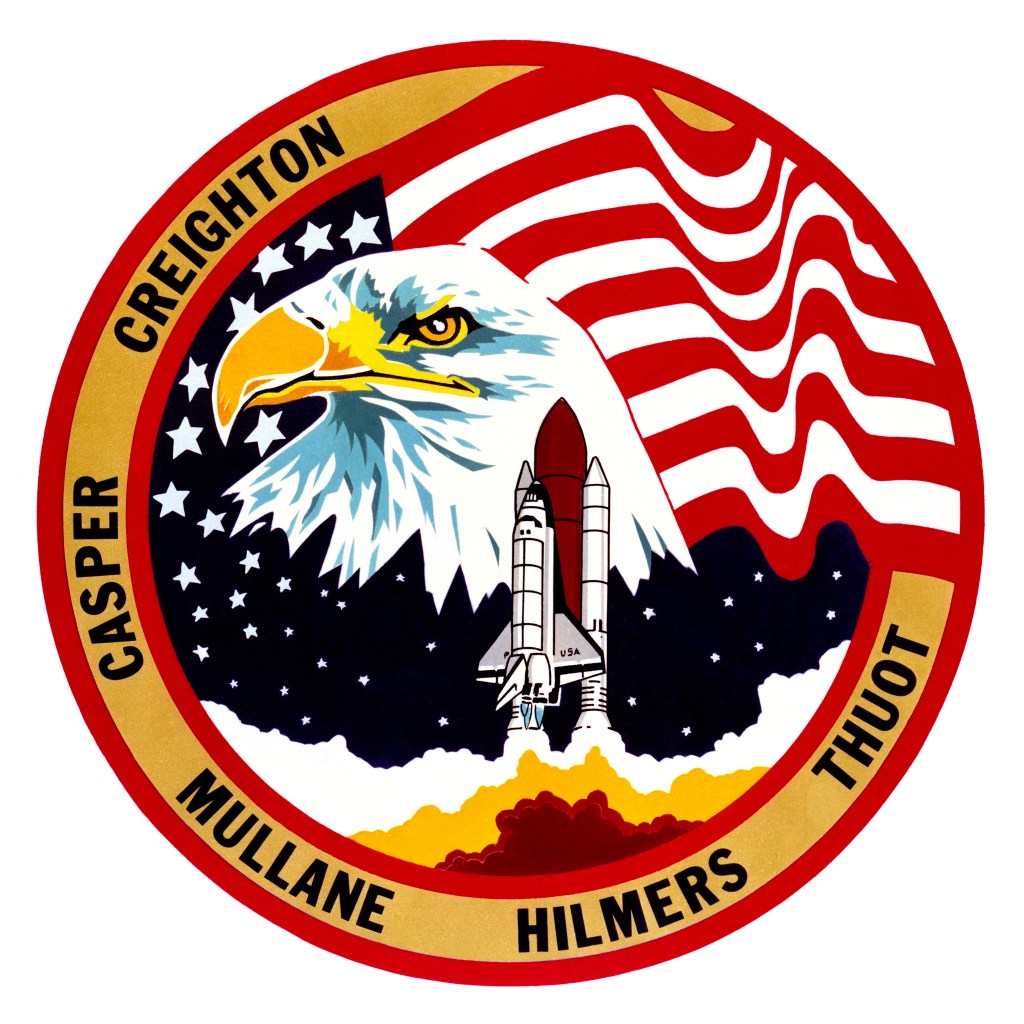
The STS-36 crew patch.
NASA
In February 1989, NASA assigned astronauts Creighton, Casper, Mullane, Hilmers, and Thuot to the STS-36 mission. The mission marked the second spaceflight for Creighton, selected as an astronaut in 1978. He previously served as the pilot on STS-51G. Mullane, also from the class of 1978, previously flew on STS-41D and STS-27, while Hilmers, from the class of 1980, previously flew on STS-51J and STS-26. For Casper and Thuot, selected as astronauts in the classes of 1984 and 1985, respectively, STS-36 marked their first trip into space.
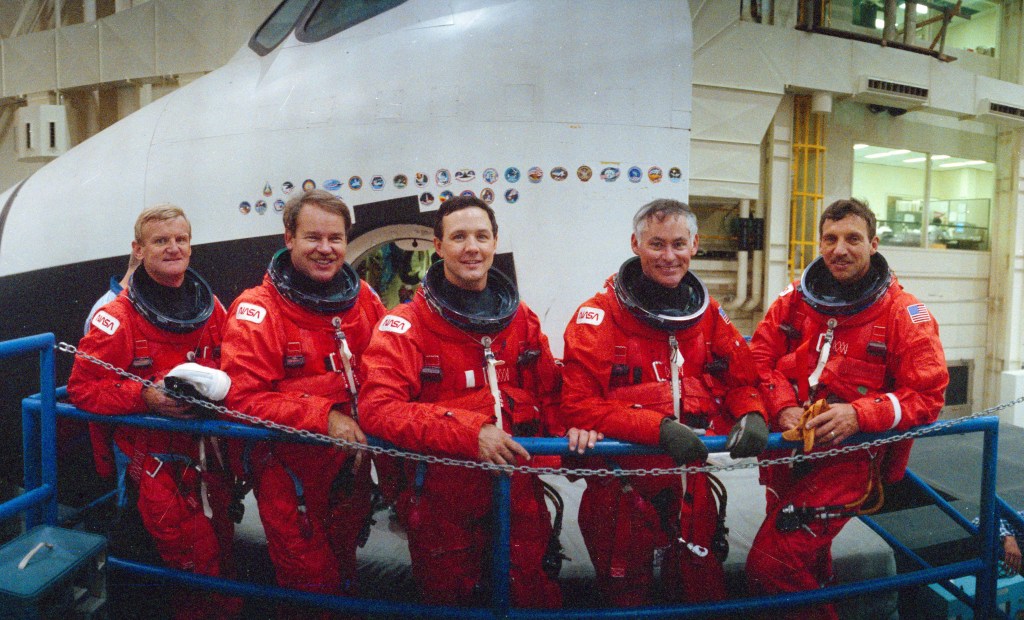
The STS-36 crew poses outside the crew compartment trainer at NASA’s Johnson Space Center in Houston.
NASA
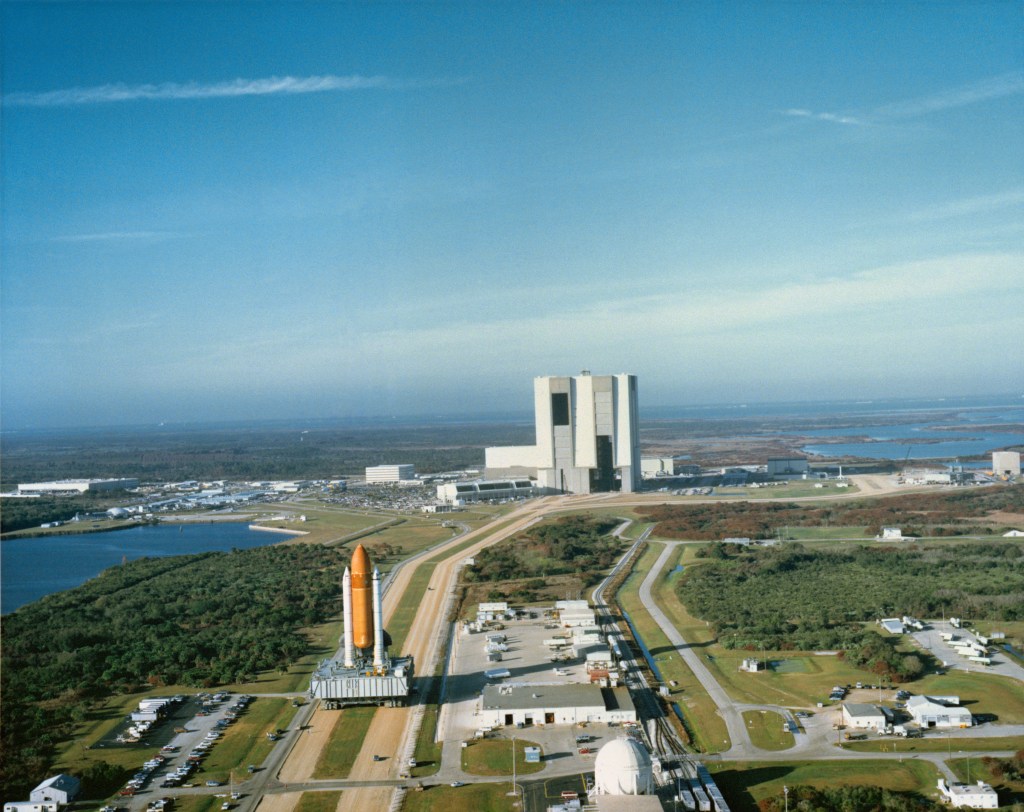
Space shuttle Atlantis during the rollout to Launch Pad 39A at NASA’s Kennedy Space Center in Florida.
NASA
The STS-36 crew participates in a simulation.
NASA
STS-36 Commander John Creighton and Pilot John Casper in the shuttle simulator.
NASA
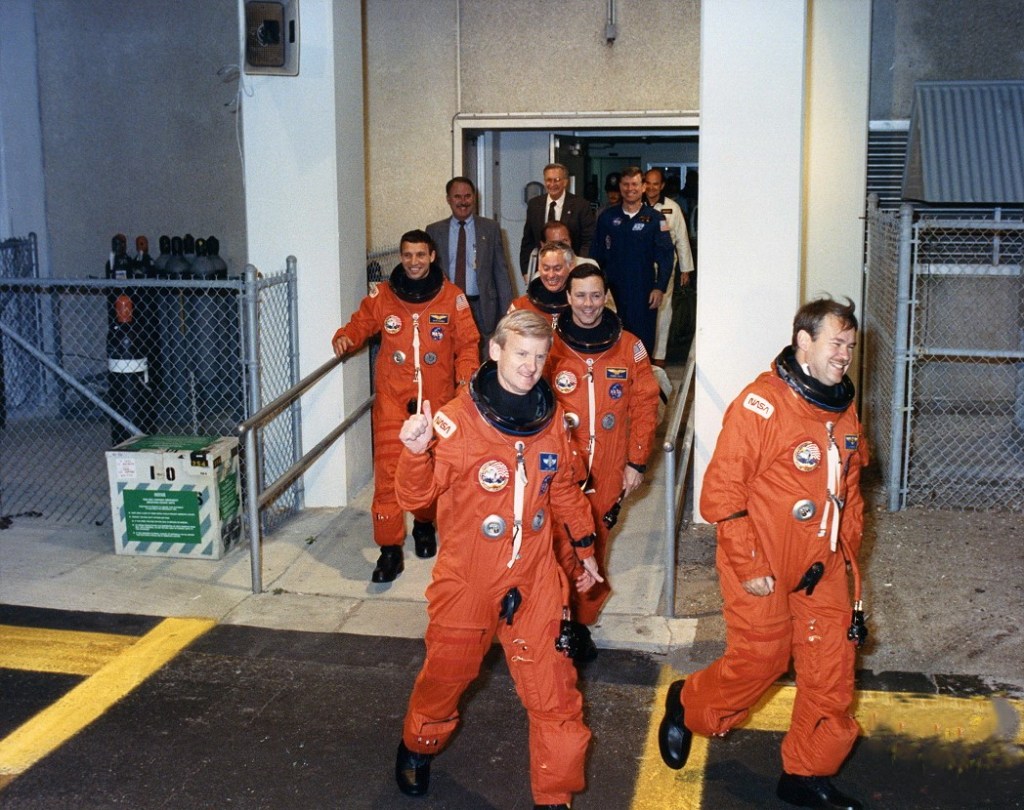
The STS-36 crew exits crew quarters for the ride to Launch Pad 39A.
NASA
Atlantis returned from its previous flight, STS-34, in October 1989. The orbiter spent a then-record 75 days in the processing facility and assembly building, rolling out to Launch Pad 39A on Jan. 25, 1990. The astronauts arrived on Feb. 18 for the planned launch four days later. First Creighton, then Casper and Hilmers, came down with colds, delaying the launch to Feb. 25. Weather and hardware problems pushed the launch back to Feb. 28, giving the astronauts time to return to Houston for some simulator training. On launch day, winds and rain delayed the liftoff for more than two hours before launch controllers gave Atlantis the go to launch.
Liftoff of space shuttle Atlantis on STS-36.
NASA
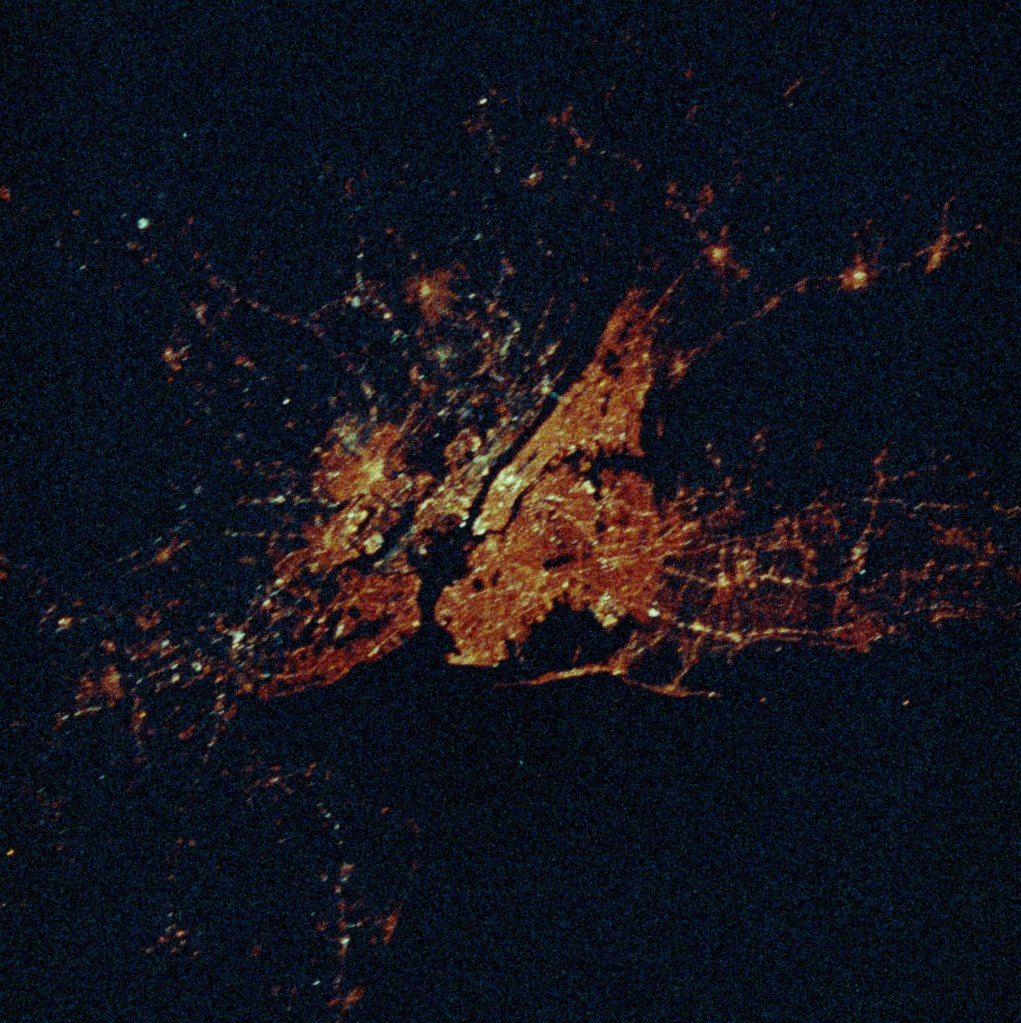
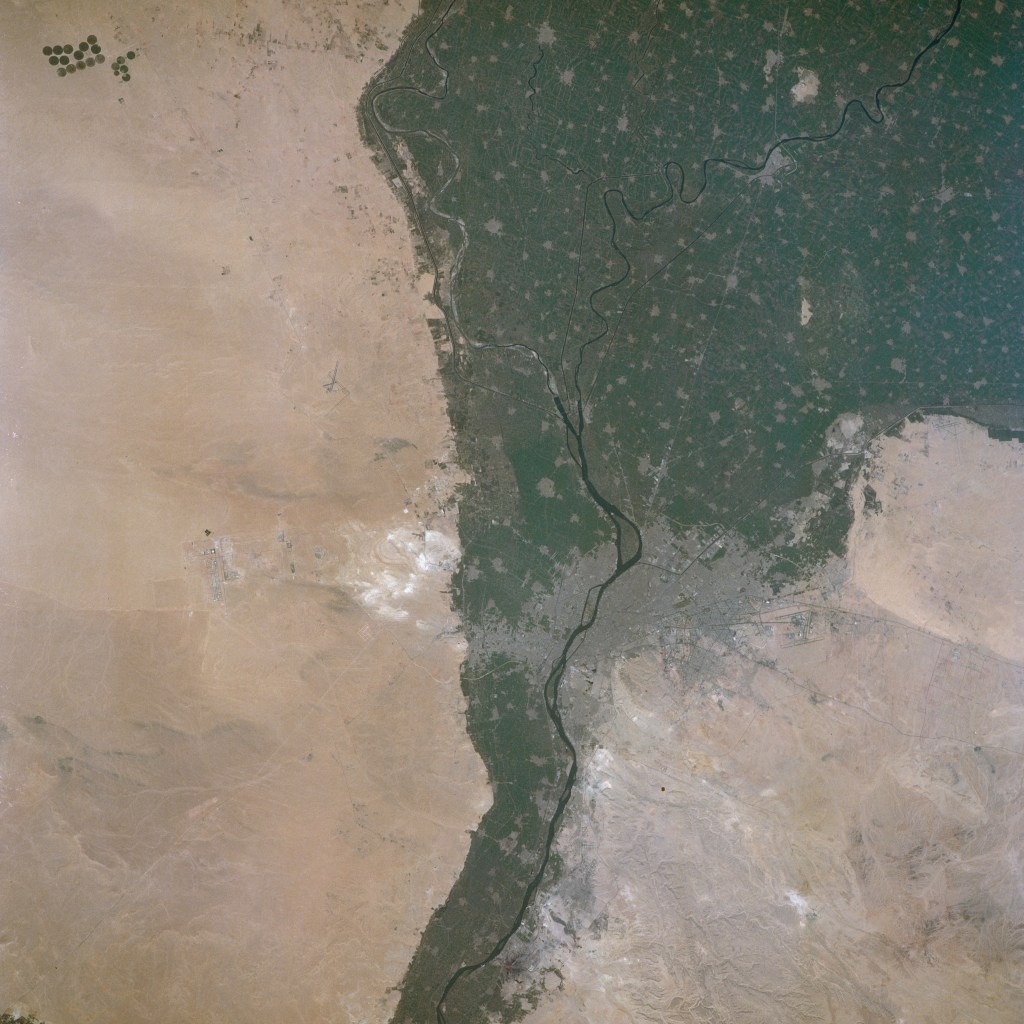
With mere seconds remaining in the launch window, Atlantis lifted off at 2:50 a.m. EST Feb. 28, to begin the STS-36 mission. Atlantis flew an unusual dog leg maneuver during ascent to achieve the mission’s 62-degree inclination. Once Atlantis reached orbit, the classified nature prevented any more detailed public coverage of the mission. The astronauts likely deployed the classified satellite on the mission’s second day. During the remainder of their mission, the astronauts conducted several experiments and photographed preselected areas and targets of opportunity on planet Earth. Their high-inclination orbit enabled them to photograph areas not usually seen by shuttle crews.
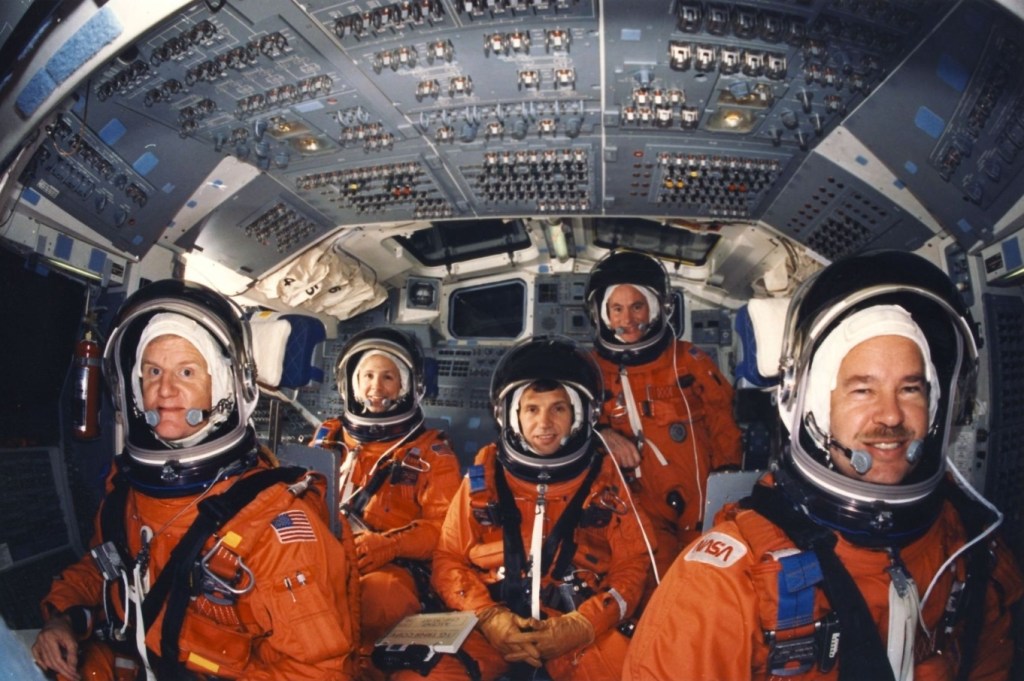
In-flight photo of the STS-36 crew on Atlantis’ flight deck.
NASA
STS-36 crew members David Hilmers, left, Pierre Thuot, and John Casper work in the shuttle’s middeck.
NASA
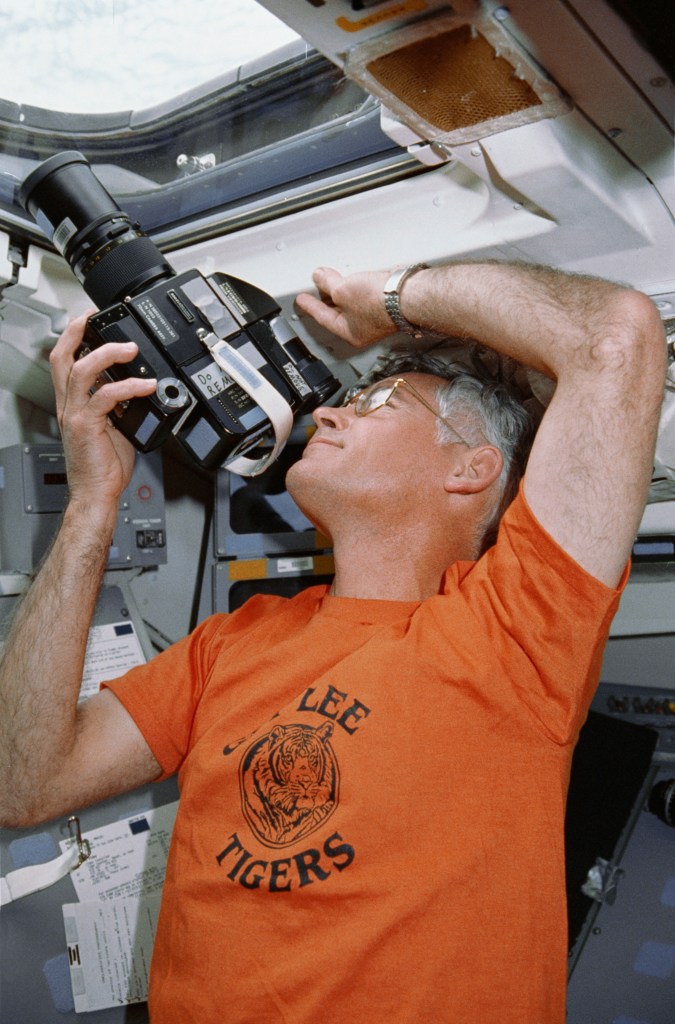
Mission Specialist Mike Mullane takes photographs from Atlantis’ flight deck.
NASA
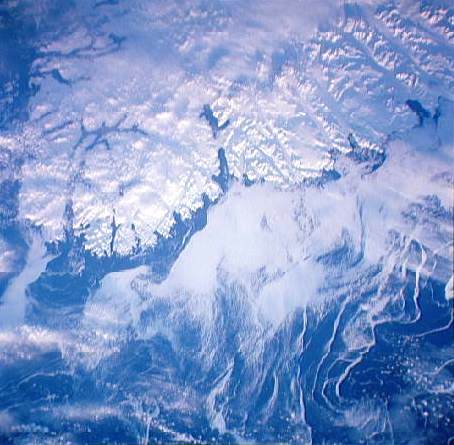
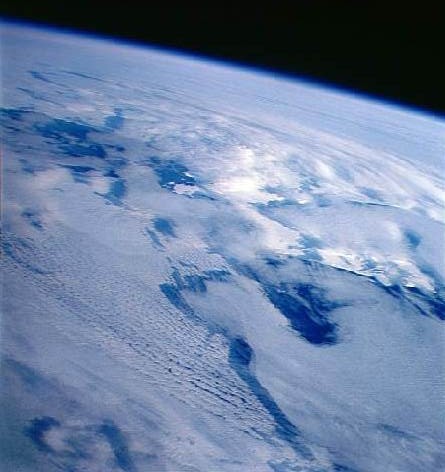
A selection of crew Earth observation photographs from STS-36. The coast of Greenland.
NASA
New York City at night.
NASA
The Nile River including Cairo and the Giza pyramids
NASA
The coast of Antarctica.
NASA
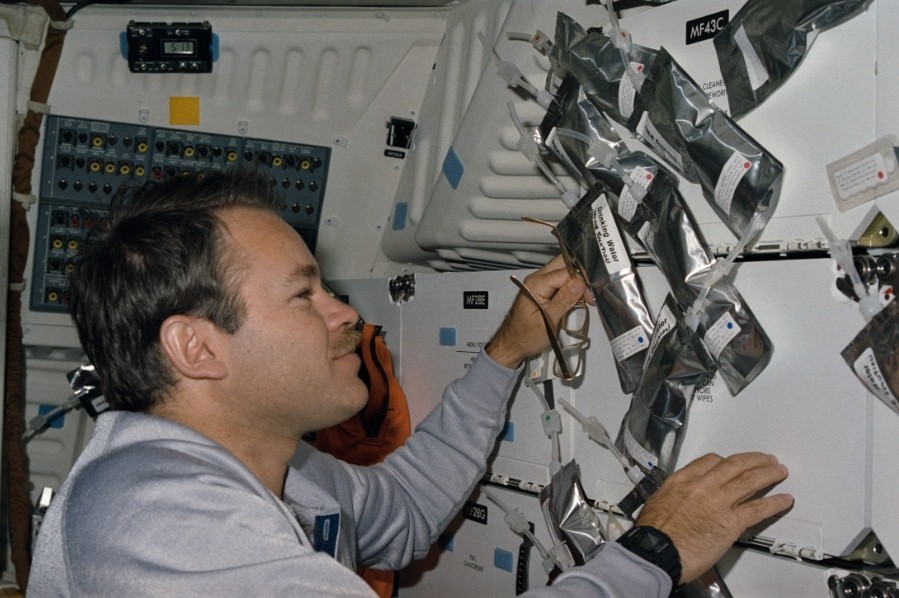
John Creighton prepares drink bags for prelanding hydration.
NASA
Atlantis touches down at Edwards Air Force Base in California.
NASA
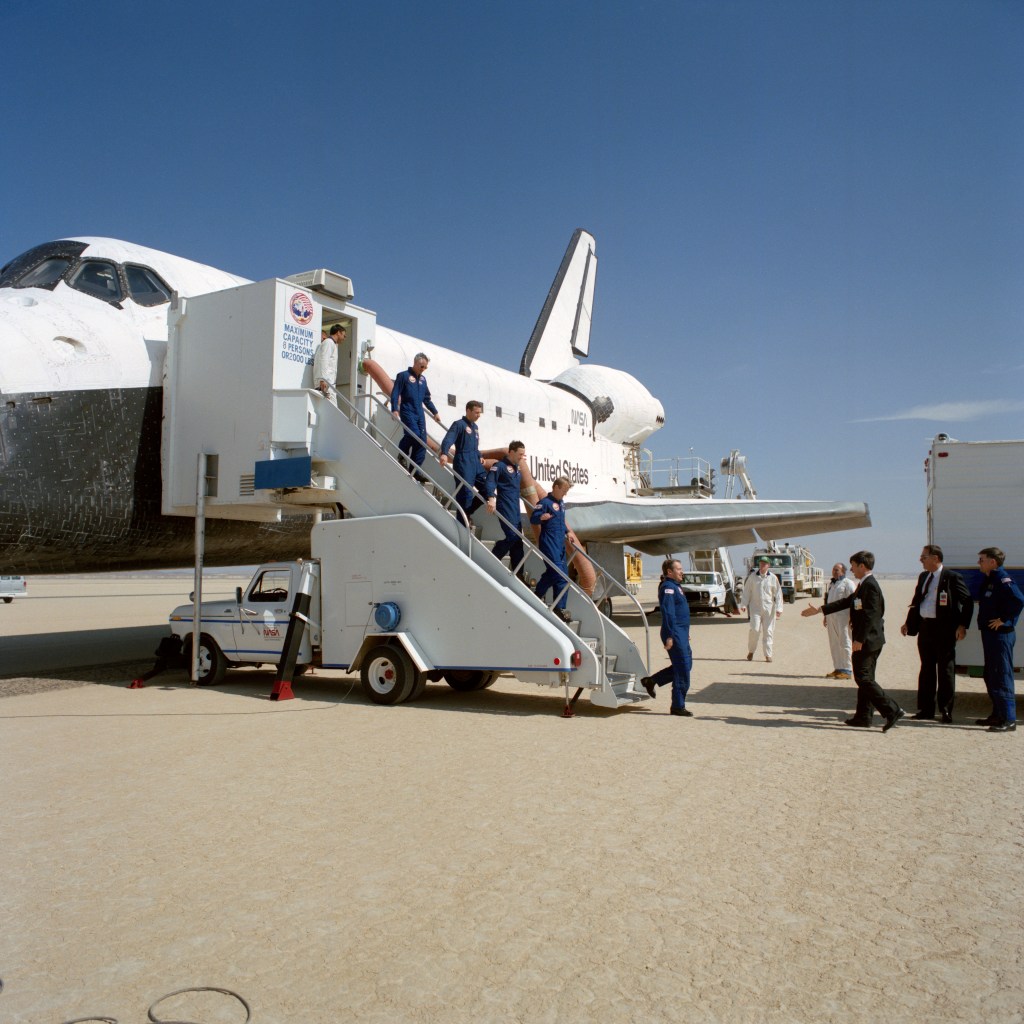
NASA officials greet the STS-36 astronauts as they exit Atlantis.
NASA
To maintain the mission’s confidentiality, NASA could reveal the touchdown time only 24 hours prior to the event. On March 4, Creighton and Casper brought Atlantis to a smooth landing at Edwards Air Force Base after 72 orbits of the Earth and a flight of four days, 10 hours, and 18 minutes. About an hour after touchdown, the astronaut crew exited Atlantis for the ride to crew quarters and the flight back to Houston. Later in the day, ground crews prepared Atlantis for the ferry ride back to Kennedy. Atlantis left Edwards on March 10 and three days later arrived at Kennedy, where workers began to prepare it for its next flight, STS-38 in November 1990.
An Ocean in Motion: NASA’s Mesmerizing View of Earth’s Underwater Highways
1 min read
An Ocean in Motion: NASA’s Mesmerizing View of Earth’s Underwater Highways
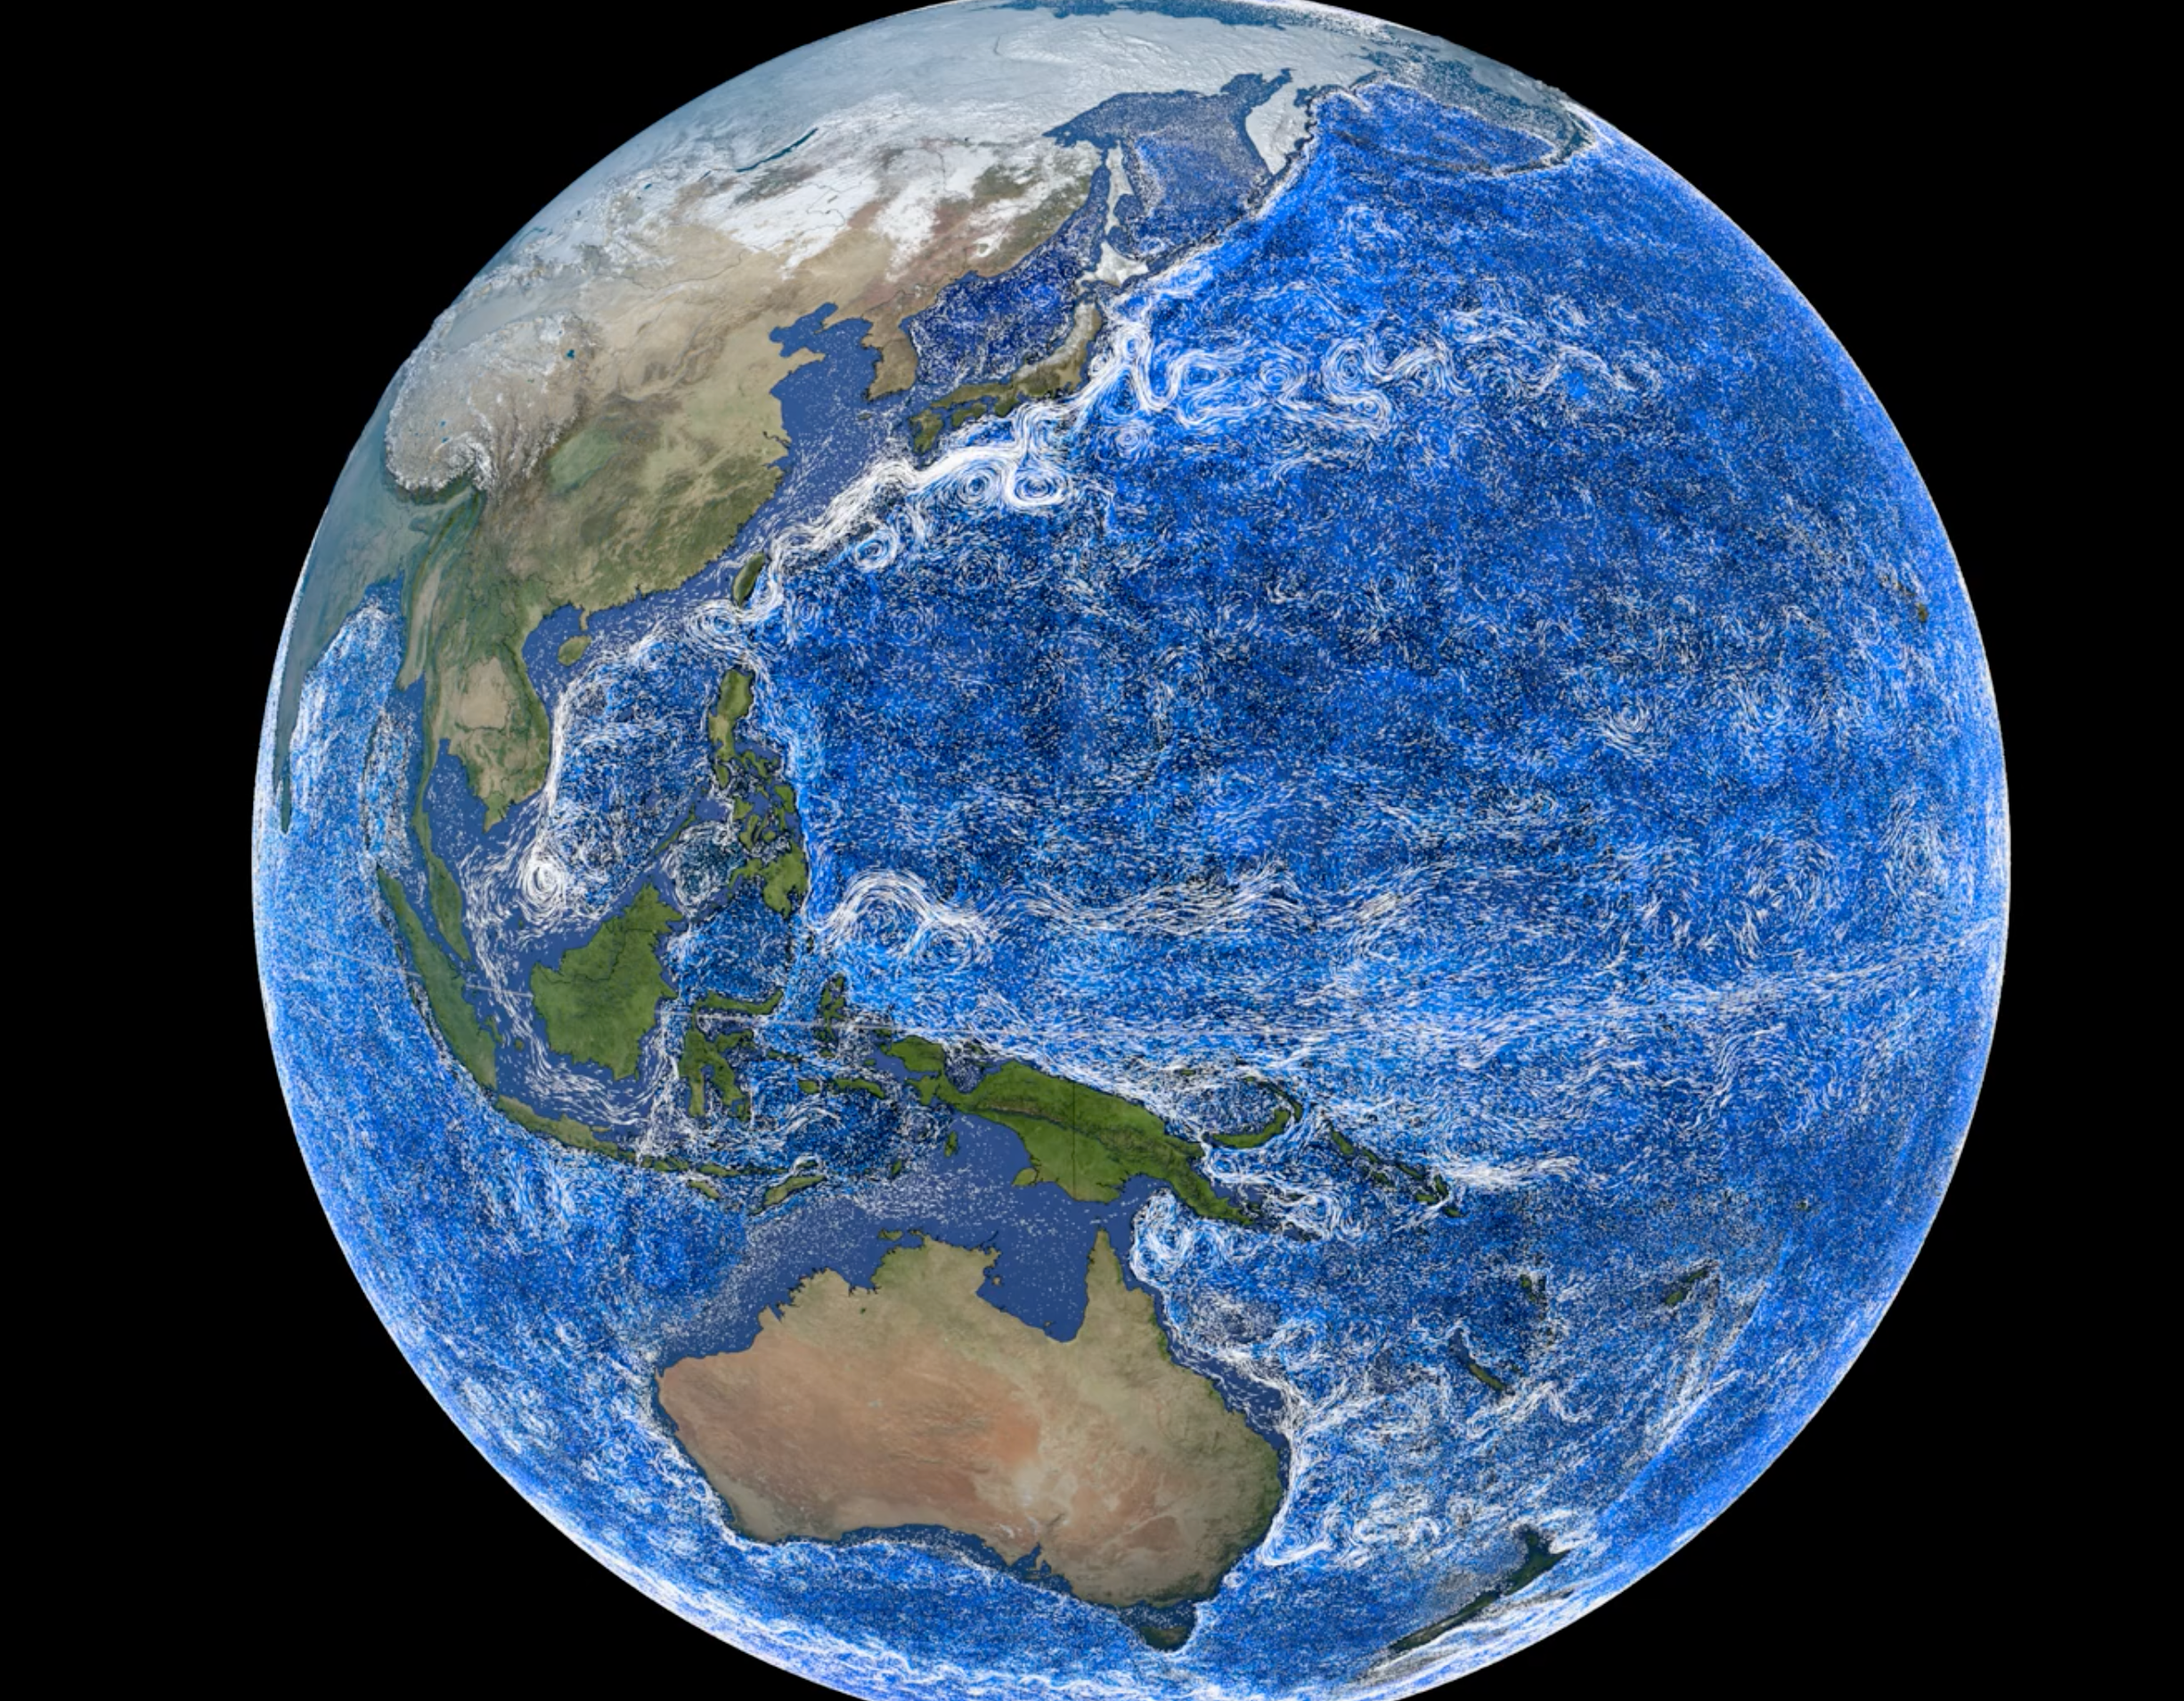
This data visualization showing ocean currents around the world uses data from NASA’s ECCO model, or Estimating the Circulation and Climate of the Ocean. The model pulls data from spacecraft, buoys, and other measurements.
Going With the Flow: Visualizing Ocean Currents with ECCO
8 Min Read
Going With the Flow: Visualizing Ocean Currents with ECCO
The North American Gulf Stream as illustrated with the ECCO model.
Credits: Greg Shirah/NASA’s Scientific Visualization Studio
Historically, the ocean has been difficult to model. Scientists struggled in years past to simulate ocean currents or accurately predict fluctuations in temperature, salinity, and other properties. As a result, models of ocean dynamics rapidly diverged from reality, which meant they could only provide useful information for brief periods.
In 1999, a project called Estimating the Circulation and Climate of the Ocean (ECCO) changed all that. By applying the laws of physics to data from multiple satellites and thousands of floating sensors, NASA scientists and their collaborators built ECCO to be a realistic, detailed, and continuous ocean model that spans decades. ECCO enabled thousands of scientific discoveries, and was featured during the announcement of the Nobel Prize for Physics in 2021.
NASA ECCO is a powerful integrator of decades of ocean data, narrating the story of Earth’s changing ocean as it drives our weather, and sustains marine life.
The ECCO project includes hundreds of millions of real-world measurements of temperature, salinity, sea ice concentration, pressure, water height, and flow in the world’s oceans. Researchers rely on the model output to study ocean dynamics and to keep tabs on conditions that are crucial for ecosystems and weather patterns. The modeling effort is supported by NASA’s Earth science programs and by the international ECCO consortium, which includes researchers from NASA’s Jet Propulsion Laboratory in Southern California and eight research institutions and universities.
The project provides models that are the best possible reconstruction of the past 30 years of the global ocean. It allows us to understand the ocean’s physical processes at scales that are not normally observable.
Credits: Greg Shirah/NASA’s Scientific Visualization Studio
Large-scale wind patterns around the globe drag ocean surface waters with them, creating complex currents, including some that flow toward the western sides of the ocean basins. The currents hug the eastern coasts of continents as they head north or south from the equator: These are the western boundary currents. The three most prominent are the Gulf Stream, Agulhas, and Kuroshio.
Credits: Greg Shirah/NASA’s Scientific Visualization Studio
Seafarers have known about the Gulf Stream — the Atlantic Ocean’s western boundary current — for more than 500 years. By the volume of water it moves, the Gulf Stream is the largest of the western boundary currents, transporting more water than all the planet’s rivers combined.
In 1785, Benjamin Franklin added it to maritime charts showing the current flowing up from the Gulf, along the eastern U.S. coast, and out across the North Atlantic. Franklin noted that riding the current could improve a ship’s travel time from the Americas to Europe, while avoiding the current could shorten travel times when sailing back.
A visualization built of ECCO data reveals a cold, deep countercurrent that flows in the opposite direction of the warm Gulf Stream above it. Download this visualization from NASA Goddard’s Scientific Visualization Studio.
Credits: Greg Shirah/NASA’s Scientific Visualization Studio
Franklin’s charts showed a smooth Gulf Stream rather than the twisted, swirling path revealed in ECCO data. And Franklin couldn’t have imagined the opposing flow of water below the Gulf Stream. The countercurrent runs at depths of about 2,000 feet (600 meters) in a cold river of water that is roughly the opposite of the warm Gulf Stream at the surface. The submarine countercurrent is clearly visible when the upper layers in the ECCO model are peeled away in visualizations.
The Gulf Stream is a part of the Atlantic Meridional Overturning Circulation (AMOC), which moderates climate worldwide by transporting warm surface waters north and cool underwater currents south. The Gulf Stream, in particular, stabilizes temperatures of the southeastern United States, keeping the region warmer in winter and cooler in summer than it would be without the current. After the Gulf Stream crosses the Atlantic, it tempers the climates of England and the European coast as well.
The Agulhas current originates along the equator in the Indian Ocean, travels down the western coast of Africa, and spawns swirling Agulhas rings that travel across the Atlantic toward South America. Download this visualization from NASA Goddard’s Scientific Visualization Studio.
Credits: Greg Shirah/NASA’s Scientific Visualization Studio
The Agulhas Current flows south along the western side of the Indian Ocean. When it reaches the southern tip of Africa, it sheds swirling vortices of water called Agulhas Rings. Sometimes persisting for years, the rings glide across the Atlantic toward South America, transporting small fish, larvae, and other microorganisms from the Indian Ocean.
Researchers using the ECCO model can study Agulhas Current flow as it sends warm, salty water from the tropics in the Indian Ocean toward the tip of South Africa. The model helps tease out the complicated dynamics that create the Agulhas rings and large loop of current called a supergyre that surrounds the Antarctic. The Southern Hemisphere supergyre links the southern portions of other, smaller current loops (gyres) that circulate in the southern Atlantic, Pacific, and Indian oceans. Together with gyres in the northern Atlantic and Pacific, the southern gyres and Southern Hemisphere supergyre influence climate while transporting carbon around the globe.
The Kuroshio Current flows on the western side of the Pacific Ocean, past the east coast of Japan, east across the Pacific, and north toward the Arctic. Along the way, it provides warm water to drive seasonal storms, while also creating ocean upwellings that carry nutrients that sustain fisheries off the coasts of Taiwan and northern Japan. Download this visualization from NASA Goddard’s Scientific Visualization Studio.
Credits: Greg Shirah/NASA’s Scientific Visualization Studio
In addition to affecting global weather patterns and temperatures, western boundary currents can drive vertical flows in the oceans known as upwellings. The flows bring nutrients up from the depths to the surface, where they act as fertilizer for phytoplankton, algae, and aquatic plants.
The Kuroshio Current that runs on the west side of the Pacific Ocean and along the east side of Japan has recently been associated with upwellings that enrich coastal fishing waters. The specific mechanisms that cause the vertical flows are not entirely clear. Ocean scientists are now turning to ECCO to tease out the connection between nutrient transport and currents like the Kuroshio that might be revealed in studies of the water temperature, density, pressure, and other factors included in the ECCO model.
Tracking Ocean Temperatures and Salinity
When viewed through the lens of ECCO’s temperature data, western boundary currents carry warm water away from the tropics and toward the poles. In the case of the Gulf Stream, as the current moves to far northern latitudes, some of the saltwater freezes into salt-free sea ice. The saltier water left behind sinks and then flows south all the way toward the Antarctic before rising and warming in other ocean basins.
Colors indicate temperature in this visualization of ECCO data. Warm water near the equator is bright yellow. Water cools when it flows toward the poles, indicated by the transition to orange and red shades farther from the equator. Download this visualization from NASA Goddard’s Scientific Visualization Studio.
Credits: Greg Shirah/NASA’s Scientific Visualization Studio
Currents also move nutrients and salt throughout Earth’s ocean basins. Swirling vortexes of the Agulhas rings stand out in ECCO temperature and salinity maps as they move warm, salty water from the Indian Ocean into the Atlantic.
The Mediterranean Sea has a dark red hue that indicates its high salt content. Other than the flow through the narrow Strait of Gibraltar, the Mediterranean is cut off from the rest of the world’s oceans. Because of this restricted flow, salinity increases in the Mediterranean as its waters warm and evaporate, making it one of the saltiest parts of the global ocean. Download this visualization from NASA Goddard’s Scientific Visualization Studio.
Credits: Greg Shirah/NASA’s Scientific Visualization Studio
Experimenting with ECCO
ECCO offers researchers a way to run virtual experiments that would be impractical or too costly to perform in real oceans. Some of the most important applications of the ECCO model are in ocean ecology, biology, and chemistry. Because the model shows where the water comes from and where it goes, researchers can see how currents transport heat, minerals, nutrients, and organisms around the planet.
In prior decades, for example, ocean scientists relied on extensive temperature and salinity measurements by floating sensors to deduce that the Gulf Stream is primarily made of water flowing past the Gulf rather than through it. The studies were time-consuming and expensive. With the ECCO model, data visualizers at NASA’s Goddard Space Flight Center in Greenbelt, Maryland, virtually replicated the research in a simulation that was far quicker and cheaper.
A simulation built with data from the ECCO model shows that very little of the water in the gulf contributes to the water flowing in the Gulf Stream. Download this visualization from NASA Goddard’s Scientific Visualization Studio.
Credits: Atousa Saberi/NASA’s Scientific Visualization Studio
The example illustrated here relies on ECCO to track the flow of water by virtually filling the Gulf with 115,000 particles and letting them move for a year in the model. The demonstration showed that less than 1% of the particles escape the Gulf to join the Gulf Stream.
Running such particle-tracking experiments within the ocean circulation models helps scientists understand how and where environmental contaminants, such as oil spills, can spread.
Take an ECCO Deep Dive
Today, researchers turn to ECCO for a broad array of studies. They can choose ECCO modeling products that focus on one feature – such as global flows or the biology and chemistry of the ocean – or they can narrow the view to the poles or specific ocean regions. Every year, more than a hundred scientific papers include data and analyses from the ECCO model that delve into our oceans’ properties and dynamics.
Credits: Kathleen Gaeta Greer/ NASA’s Scientific Visualization Studio
Composed by James Riordon / NASA’s Earth Science News Team
Information in this piece came from the resources below and interviews with the following sources: Nadya Vinogradova Shiffer, Dimitris Menemenlis, Ian Fenty, and Atousa Saberi.
References and Sources
Liao, F., Liang, X., Li, Y., & Spall, M. (2022). Hidden upwelling systems associated with major western boundary currents. Journal of Geophysical Research: Oceans, 127(3), e2021JC017649.
Richardson, P. L. (1980). The Benjamin Franklin and Timothy Folger charts of the Gulf Stream. In Oceanography: The Past: Proceedings of the Third International Congress on the History of Oceanography, held September 22–26, 1980 at the Woods Hole Oceanographic Institution, Woods Hole, Massachusetts, USA on the occasion of the Fiftieth Anniversary of the founding of the Institution (pp. 703-717). New York, NY: Springer New York.
Biastoch, A., Rühs, S., Ivanciu, I., Schwarzkopf, F. U., Veitch, J., Reason, C., … & Soltau, F. (2024). The Agulhas Current System as an Important Driver for Oceanic and Terrestrial Climate. In Sustainability of Southern African Ecosystems under Global Change: Science for Management and Policy Interventions (pp. 191-220). Cham: Springer International Publishing.
Lee-Sánchez, E., Camacho-Ibar, V. F., Velásquez-Aristizábal, J. A., Valencia-Gasti, J. A., & Samperio-Ramos, G. (2022). Impacts of mesoscale eddies on the nitrate distribution in the deep-water region of the Gulf of Mexico. Journal of Marine Systems, 229, 103721.
NASA Names Norman Knight as Acting Deputy Director of Johnson Space Center
Official NASA portrait of Norman D. Knight.
Credit: NASA
NASA has selected Norman Knight as acting deputy director of Johnson Space Center. Knight currently serves as Director of Johnson’s Flight Operations Directorate (FOD), responsible for astronaut training and for overall planning, directing, managing, and implementing overall mission operations for NASA human spaceflight programs. This also includes management for all Johnson aircraft operations and aircrew training. Knight will serve in this dual deputy director and FOD director role for the near term.
Knight began his career at the Johnson Space Center as a Space Shuttle mechanical systems flight controller, working 40 missions in this capacity. He progressed through management roles with increasing responsibility, and in 2000, he was selected as a flight director and worked in that capacity for numerous International Space Station expeditions and Space Shuttle missions. In 2009, he became the deputy chief of the Flight Director Office and participated in a NASA fellowship at Harvard Business School in general management. In 2012, Knight was selected as the chief of the Flight Director Office and then in 2018 as deputy director of the Flight Operations Directorate after serving a temporary assignment as the assistant administrator, Human Exploration and Operations Mission Directorate at NASA Headquarters. In 2021, Knight was selected as the director of FOD.
Throughout his career, Knight has been recognized for outstanding technical achievements and leadership, receiving a Spaceflight Awareness Honoree award for STS-82. He also received several center and agency awards, including two Exceptional Achievement medals, multiple Johnson and agency group achievement awards, two Superior Accomplishment awards, an Outstanding Leadership medal, the Johnson Director’s Commendation award, and the Distinguished Service medal.
Knight earned a bachelor’s degree in aeronautical engineering from the Embry Riddle Aeronautical University in 1990.