Laser Focused: Keith Barr Leads Orion’s Lunar Docking Efforts 

Laser Focused: Keith Barr Leads Orion’s Lunar Docking Efforts 

Keith Barr was born only months before the historic Apollo 11 landing in 1969. While he was too young to witness that giant leap for mankind, the moment sparked a lifelong fascination that set him on a path to design technology that will carry astronauts farther into space than ever before. 

Today, Barr serves as a chief engineer and Orion Docking Lidar Field Test lead at NASA’s Johnson Space Center in Houston. He spearheads the field testing of docking lidars for the Orion spacecraft, which will carry astronauts to the Moon on the Artemis III mission. These lidars are critical to enabling Orion to autonomously dock with the human landing system on Artemis III — the mission that will land astronauts near the Moon’s South Pole for the first time in history. 

Keith Barr prepares for a wind lidar test flight in one of the U.S. Navy’s Twin Otter aircraft in support of the AC-130 Gunship lidar program.

“The Mercury, Gemini, and Apollo missions are some of humanity’s greatest technical achievements,” he said. “To be part of the Artemis chapter is a profound honor.”  

In recognition of his contributions, Barr was selected as a NASA Space Flight Awareness Honoree in 2025 for his exceptional dedication to astronaut safety and mission success. Established in 1963, NASA’s Space Flight Awareness Program celebrates individuals who play a vital role in supporting human spaceflight. The award is one of the highest honors presented to the agency’s workforce. 

With a career spanning over 25 years at Lockheed Martin, Barr is now recognized as a renowned leader in lidar systems—technologies that use laser light to measure distances. He has led numerous lidar deployments and test programs across commercial aviation, wind energy, and military markets.  

In 2019, Barr and his team began planning a multi-phase field campaign to validate Orion’s docking lidars under real-world conditions. They repurposed existing hardware, developed a drone-based simulation system, and conducted dynamic testing at Lockheed Martin facilities in Littleton, Colorado, and Santa Cruz, California. 

In Littleton, the team conducted two phases of testing at the Space Operations Simulation Center, evaluating performance across distances ranging from 50 meters to docking. At the Santa Cruz facility, they began much farther out at 6,500 meters and tested down to 10 meters, just before the final docking phase. 

Of all these efforts, Barr is especially proud of the ingenuity behind the Santa Cruz tests. To simulate a spacecraft docking scenario, he repurposed a lidar pointing gimbal and test trailer from previous projects and designed a drone-based test system with unprecedented accuracy.  

“An often-overlooked portion of any field campaign is the measurement and understanding of truth,” he said. “The system I designed allowed us to record lidar and target positions with accuracy never before demonstrated in outdoor docking lidar testing.” 

Testing at the Santa Cruz Facility in California often began before sunrise and continued past sunset to complete the full schedule. Here, a drone hovers at the 10-meter station-keeping waypoint as the sun sets in the background.

The test stand at the Santa Cruz Facility had once been used for Agena upper stage rockets—a key piece of hardware used during the Gemini program in the 1960s. “We found a Gemini-era sticker on the door of the test bunker—likely from the time of Gemini VIII, the first space docking completed by Neil Armstrong and David Scott,” Barr said. “This really brought it home to me that we are simply part of the continuing story.” 

Keith Barr operates a wind lidar during a live fire test in an AC-130 Gunship aircraft. He is seated next to an open door while flying at 18,000 feet over New Mexico in January 2017.

Barr spent more than two decades working on WindTracer—a ground-based Doppler wind lidar system used to measure wind speed and turbulence at airports, wind farms, and in atmospheric research. 

The transition from WindTracer to Orion presented new challenges. “Moving onto a space program has a steep learning curve, but I have found success in this new arena and I have learned that I can adapt and I shouldn’t be nervous about the unknown,” he said. “Learning new technologies, applications, and skills keeps my career fun and exciting and I look forward to the next giant leap—whatever it is.” 

Keith Barr stands beside the Piper Cherokee 6 aircraft during his time as a captain for New England Airlines.

Barr’s passion for flight moves in tandem with his pursuit of innovation. Over his career, he has flown over 1.6 million miles on commercial airlines. “I often joke that I’m on my fourth trip to the Moon and back—just in economy class,” he said.  

Before specializing in lidar systems, Barr flew as a captain and assistant chief pilot at New England Airlines, operating small aircraft like the Piper Cherokee 6 and the Britten-Norman Islander.  

He also worked at the National Center for Atmospheric Research, contributing to several NASA airborne missions aimed at unraveling the science behind global ozone depletion.  

Keith Barr boards NASA’s DC-8 aircraft at Ames Research Center in California before heading to Salina, Kansas, to support a 1996 research mission studying how airplane emissions affect clouds and the atmosphere.

As Barr reflects on his journey, he hopes to pass along a sense of legacy to the Artemis Generation. “We are in the process of writing the next chapter of human space exploration history, and our actions, successes, and troubles will be studied and analyzed well into the future,” he said. “We all need to consider how our actions will shape history.” 

Powered by WPeMatico

Get The Details…
Sumer Loggins

Station Waits Extra Day for Axiom Mission 4 Launch, Studies Eyes and Proteins

Station Waits Extra Day for Axiom Mission 4 Launch, Studies Eyes and Proteins

NASA astronauts (left to right) Anne McClain and Nichole Ayers, both Expedition 73 Flight Engineers, pose for a portrait together aboard the International Space Station's Harmony module. Moments earlier, Ayers finished trimming McClain's hair using an electric razor with a suction hose attached that collects the loose hair to protect the station's atmosphere.
NASA astronauts (left to right) Anne McClain and Nichole Ayers pose for a portrait together aboard the International Space Station’s Harmony module. Moments earlier, Ayers finished trimming McClain’s hair using an electric razor with a suction hose attached that collects the loose hair to protect the station’s atmosphere.
NASA

The Axiom Mission 4 (Ax-4) crew is at NASA’s Kennedy Space Center counting down to a launch aboard the SpaceX Dragon spacecraft targeted for 8 a.m. EDT on Wednesday to the International Space Station. Veteran astronaut Peggy Whitson is commanding Ax-4 and will be flying on her fifth mission to the orbiting lab. She is leading first time space flyers Pilot Shubhanshu Shukla from India and Mission Specialists Sławosz Uzanański-Wiśniewksi from Poland and Tibor Kapu from Hungary. The four private astronauts are preparing for a two-week stay on the orbital laboratory to conduct a wide array of space research supporting human health, space commercialization, and more.

The Expedition 73 crew has had several days of Ax-4 reviews studying the mission’s profile and Dragon’s automated approach and rendezvous techniques. The orbital crewmates also readied space station systems, activated tablet computers, and installed sleep stations Ax-4 will use during its planned two-week stay aboard the station. NASA Flight Engineers Anne McClain and Nichole Ayers will be on duty monitoring Dragon as the Ax-4 quartet approaches the station for a docking at 12:30 p.m. on Thursday.

Meanwhile aboard the orbiting lab on Monday, the orbital residents’ research schedule was composed of eye checks, space physics, and Earth observations. Ongoing lab maintenance rounded out the day with spacesuit cleaning, advanced exercise gear inspections, electronics and plumbing hardware swaps, and Soyuz seat checks.

McClain, Ayers, and station Commander Takuya Onishi of JAXA (Japan Aerospace Exploration Agency) joined each other before their midday lunch and had their first set of eye exams. The trio participated in eye scans with the Ultrasound 2 biomedical device with remote guidance from doctors on the ground. The researchers were looking at the astronauts’ optic nerve, cornea, and lens to understand if microgravity is affecting their eye structure. The astronauts also got together at the end of their shift for a second set of eye checks peering into medical imaging hardware for more insight into space-caused vision issues.

Ayers began her shift in the Destiny laboratory module setting up physics research hardware inside the Microgravity Science Glovebox. The Ring Sheared Drop investigation looks at proteins in a liquid without a container for potential insights into neurodegenerative diseases such as Alzheimer’s and new space commercialization opportunities.

Onishi also partnered with NASA Flight Engineer Jonny Kim and inspected the Enhanced European Exploration Exercise Device (E4D) inside the Columbus laboratory module. The duo checked out components and greased rails and rollers to ensure the E4D’s functionality and prevent corrosion. The E4D is being tested on the station for future use on missions to the Moon, Mars, and beyond. Onishi then conducted leak checks and removed batteries from a spacesuit in the Quest airlock. Kim drained recycled water tanks and replaced hardware on the station’s bathroom located in the Tranquility module.

eteran cosmonaut and Flight Engineer Sergey Ryzhikov began his shift examining hatch seals in the station’s Roscosmos segment. Following that work, he cleaned and replaced ventilation system gear in the Poisk module then tested the functionality of communications hardware. Flight Engineer Alexey Zubritskiy transferred nitrogen from Poisk tanks then tested the operations of a 3D printer in the Nauka science module. The pair also performed a fit check of the seats they will ride in aboard the Soyuz MS-27 spacecraft when they return to Earth later this year with Jonny Kim. Flight Engineer Kirill Peskov pointed a specialized camera, called a hyperspectrometer, out a space station window and captured imagery of landmarks across Europe and Asia in visible and near-infrared wavelengths for analysis.

Learn more about station activities by following the space station blog, @space_station and @ISS_Research on X, as well as the ISS Facebook and ISS Instagram accounts.

Get the latest from NASA delivered every week. Subscribe here.

Powered by WPeMatico

Get The Details…

Mark A. Garcia

NASA’s Chandra Sees Surprisingly Strong Black Hole Jet at Cosmic “Noon”

NASA’s Chandra Sees Surprisingly Strong Black Hole Jet at Cosmic “Noon”

An artist's illustration showing material in a disk that is falling towards a supermassive black hole. A jet is blasting away from the black hole towards the upper right. The black hole is located 11.6 billion light-years from Earth when the cosmic microwave background (CMB), the leftover glow from the big bang, was much denser than it is now. As the electrons in the jets fly away from the black hole, they move through the sea of CMB radiation and collide with photons producing the microwaves. These collisions boost the energy of the photons up into the X-ray band, allowing them to be detected by Chandra even at this great distance. The schematic in the inset shows a close-up view of this process.
A black hole has blasted out a surprisingly powerful jet in the distant universe, according to a study from NASA’s Chandra X-ray Observatory.
X-ray: NASA/CXC/CfA/J. Maithil et al.; Illustration: NASA/CXC/SAO/M. Weiss; Image Processing: NASA/CXC/SAO/N. Wolk

A black hole has blasted out a surprisingly powerful jet in the distant universe, according to a new study from NASA’s Chandra X-ray Observatory and discussed in our latest press release. This jet exists early enough in the cosmos that it is being illuminated by the leftover glow from the big bang itself.

Astronomers used Chandra and the Karl G. Jansky Very Large Array (VLA) to study this black hole and its jet at a period they call “cosmic noon,” which occurred about three billion years after the universe began. During this time most galaxies and supermassive black holes were growing faster than at any other time during the history of the universe.

The main graphic is an artist’s illustration showing material in a disk that is falling towards a supermassive black hole. A jet is blasting away from the black hole towards the upper right, as Chandra detected in the new study. The black hole is located 11.6 billion light-years from Earth when the cosmic microwave background (CMB), the leftover glow from the big bang, was much denser than it is now. As the electrons in the jets fly away from the black hole, they move through the sea of CMB radiation and collide with microwave photons. These collisions boost the energy of the photons up into the X-ray band (purple and white), allowing them to be detected by Chandra even at this great distance, which is shown in the inset.

Researchers, in fact, identified and then confirmed the existence of two different black holes with jets over 300,000 light-years long. The two black holes are 11.6 billion and 11.7 billion light-years away from Earth, respectively. Particles in one jet are moving at between 95% and 99% of the speed of light (called J1405+0415) and in the other at between 92% and 98% of the speed of light (J1610+1811). The jet from J1610+1811 is remarkably powerful, carrying roughly half as much energy as the intense light from hot gas orbiting the black hole.

The team was able to detect these jets despite their great distances and small separation from the bright, growing supermassive black holes — known as “quasars” — because of Chandra’s sharp X-ray vision, and because the CMB was much denser then than it is now, enhancing the energy boost described above.

When quasar jets approach the speed of light, Einstein’s theory of special relativity creates a dramatic brightening effect. Jets aimed toward Earth appear much brighter than those pointed away. The same brightness astronomers observe can come from vastly different combinations of speed and viewing angle. A jet racing at near-light speed but angled away from us can appear just as bright as a slower jet pointed directly at Earth.

The researchers developed a novel statistical method that finally cracked this challenge of separating effects of speed and of viewing angle. Their approach recognizes a fundamental bias: astronomers are more likely to discover jets pointed toward Earth simply because relativistic effects make them appear brightest. They incorporated this bias using a modified probability distribution, which accounts for how jets oriented at different angles are detected in surveys.

Their method works by first using the physics of how jet particles scatter the CMB to determine the relationship between jet speed and viewing angle. Then, instead of assuming all angles are equally likely, they apply the relativistic selection effect: jets beamed toward us (smaller angles) are overrepresented in our catalogs. By running ten thousand simulations that match this biased distribution to their physical model, they could finally determine the most probable viewing angles: about 9 degrees for J1405+0415 and 11 degrees for J1610+1811.

These results were presented by Jaya Maithil (Center for Astrophysics | Harvard & Smithsonian) at the 246th meeting of the American Astronomical Society in Anchorage, AK, and are also being published in The Astrophysical Journal. A preprint is available here. NASA’s Marshall Space Flight Center in Huntsville, Alabama, manages the Chandra program. The Smithsonian Astrophysical Observatory’s Chandra X-ray Center controls science operations from Cambridge, Massachusetts, and flight operations from Burlington, Massachusetts.

Learn more about the Chandra X-ray Observatory and its mission here:

https://www.nasa.gov/chandra

https://chandra.si.edu

Visual Description

This release is supported by an artist’s illustration of a jet blasting away from a supermassive black hole.

The black hole sits near the center of the illustration. It resembles a black marble with a fine yellow outline. Surrounding the black hole is a swirling disk, resembling a dinner plate tilted to face our upper right. This disk comprises concentric rings of fiery swirls, dark orange near the outer edge, and bright yellow near the core.

Shooting out of the black hole are two streaky beams of silver and pale violet. One bright beam shoots up toward our upper right, and a second somewhat dimmer beam shoots in the opposite direction, down toward our lower left. These beams are encircled by long, fine, corkscrewing lines that resemble stretched springs.

This black hole is located 11.6 billion light-years from Earth, much earlier in the history of the universe. Near this black hole, the leftover glow from the big bang, known as the cosmic microwave background or CMB, is much denser than it is now. As the electrons in the jets blast away from the black hole, they move through the sea of CMB radiation. The electrons boost the energies of the CMB light into the X-ray band, allowing the jets to be detected by Chandra, even at this great distance.

Inset at our upper righthand corner is an X-ray image depicting this interaction. Here, a bright white circle is ringed with a band of glowing purple energy. The jet is the faint purple line shooting off that ring, aimed toward our upper right, with a blob of purple energy at its tip.

News Media Contact

Megan Watzke
Chandra X-ray Center
Cambridge, Mass.
617-496-7998
mwatzke@cfa.harvard.edu

Lane Figueroa
Marshall Space Flight Center, Huntsville, Alabama
256-544-0034
lane.e.figueroa@nasa.gov

Powered by WPeMatico

Get The Details…
Lee Mohon

Central Brazil Cerrado

Central Brazil Cerrado

A dark-green and brown oval-shaped plateau oriented north-to-south is prominent toward the left side of this satellite image of Brazil. A reservoir with branching arms takes up the right side of the image, and a light-colored developed area sits between the plateau and reservoir. A patchwork of irregularly shaped fields surrounds those features.
Amid a patchwork of fields, towns, and winding rivers and roads in central Brazil stands a monolithic oval-shaped plateau. This conspicuous feature, the Serra de Caldas (also known as the Caldas Novas dome and Caldas Ridge), is perched about 300 meters (1,000 feet) above the surrounding landscape in the state of Goiás.
NASA/Wanmei Liang; Landsat data: USGS

On May 19, 2025, Landsat 9 captured this image of the Serra de Caldas in the state of Goiás, Brazil. The oval plateau is covered by a biologically rich savanna and grassland ecosystem called Cerrado. The Cerrado covers about one-fifth of Brazil’s land area and represents the second-largest biome in South America behind the Amazon. These lands are home to thousands of plant, bird, reptile, and mammal species, many of which are found nowhere else on the planet.

Learn more about this area sometimes referred to as the “cradle of waters.”

Text credit: Lindsey Doermann

Image credit: NASA/Wanmei Liang; Landsat data: USGS

Powered by WPeMatico

Get The Details…
Monika Luabeya

NASA’s TROPICS Mission: Offering Detailed Images and Analysis of Tropical Cyclones

NASA’s TROPICS Mission: Offering Detailed Images and Analysis of Tropical Cyclones

Feature Article header

9 min read

NASA’s TROPICS Mission: Offering Detailed Images and Analysis of Tropical Cyclones

Introduction

Tropical cyclones represent a danger to life, property, and the economies of communities. Researchers who study tropical cyclones have focused on remote observations using space-based platforms to image these storms, inform forecasts, better predict landfall, and improve understanding of storm dynamics and precipitation evolution – see Figure 1.

TROPICS figure 1
Figure 1. TROPICS imagery of Typhoon Kong-rey observed on October 29, 2024 near 205 GHz revealing a large and well-defined eye.
Figure credit: U.S. Naval Research Laboratory

The tropical cyclone community has leveraged data from Earth observing platforms for more than 30 years. These data have been retrieved from numerous instruments including: the Advanced Baseline Imager (ABI) on the National Oceanic and Atmospheric Administration’s (NOAA) Geostationary Operational Environmental Satellite (GOES)–Series R satellites; the Tropical Rainfall Measuring Mission (TRMM) Microwave Imager (TMI); the Global Precipitation Measurement (GPM) Microwave Imager (GMI); the Special Sensor Microwave Imager/Sounder (SSMIS) on the Defense Meteorological Satellite (DSMP) satellites; the Advanced Microwave Scanning Radiometer (AMSR-E) on Aqua; AMSR2 on the Japan Aerospace Exploration Agency’s (JAXA) Global Change Observation Mission–Water (GCOM-W) mission; the Advanced Microwave Sounding Unit (AMSU) on Aqua and the Advanced Technology Microwave Sounder (ATMS) on the NASA–NOAA Suomi National Polar-Orbiting Partnership (Suomi NPP), NOAA-20, and NOAA-21; the Moderate Resolution Imaging Spectroradiometer (MODIS) on NASA’s Terra and Aqua Platform; and the Visible Infrared Imaging Radiometer Suite (VIIRS) on Suomi NPP, as well as on the first two Joint Polar Satellite System (JPSS) missions (i.e., NOAA-20 and NOAA-21).

Despite having decades of data at their disposal, scientists lack data from instruments placed in low-inclination orbits that provide more frequent views within tropical regions. This limitation is especially pronounced in the tropical and subtropical latitudes, which is where tropical storms develop and intensify.

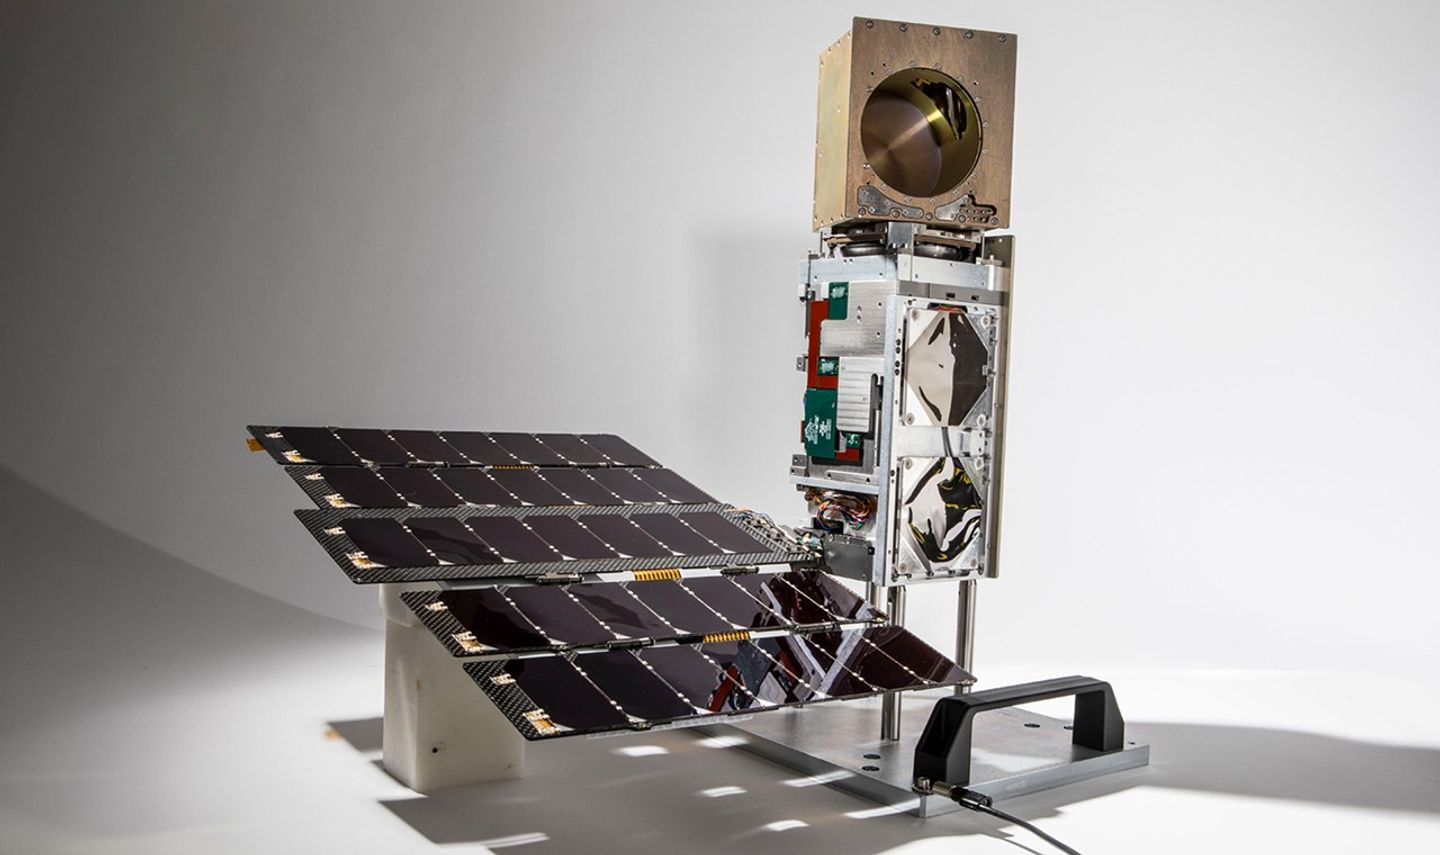
The NASA Time-Resolved Observations of Precipitation structure and storm Intensity with a Constellation of Smallsats (TROPICS) grew from the Precipitation and All-weather Temperature and Humidity (PATH) to address a need for obtaining three-dimensional (3D) temperature and humidity measurements as well as precipitation with a temporal revisit rate of one hour or better – see Figure 2. TROPICS uses multiple small satellites flying in a carefully engineered formation to obtain rapid revisits of measurements of precipitation structure within the storms, as well as temperature and humidity profiles, both within and outside of the storms, including the intensity of the upper-level warm core. In addition, the instruments provide a median revisit time of about one hour. The data gathered also informs changes in storm track and intensity and provides data to improve weather prediction models.

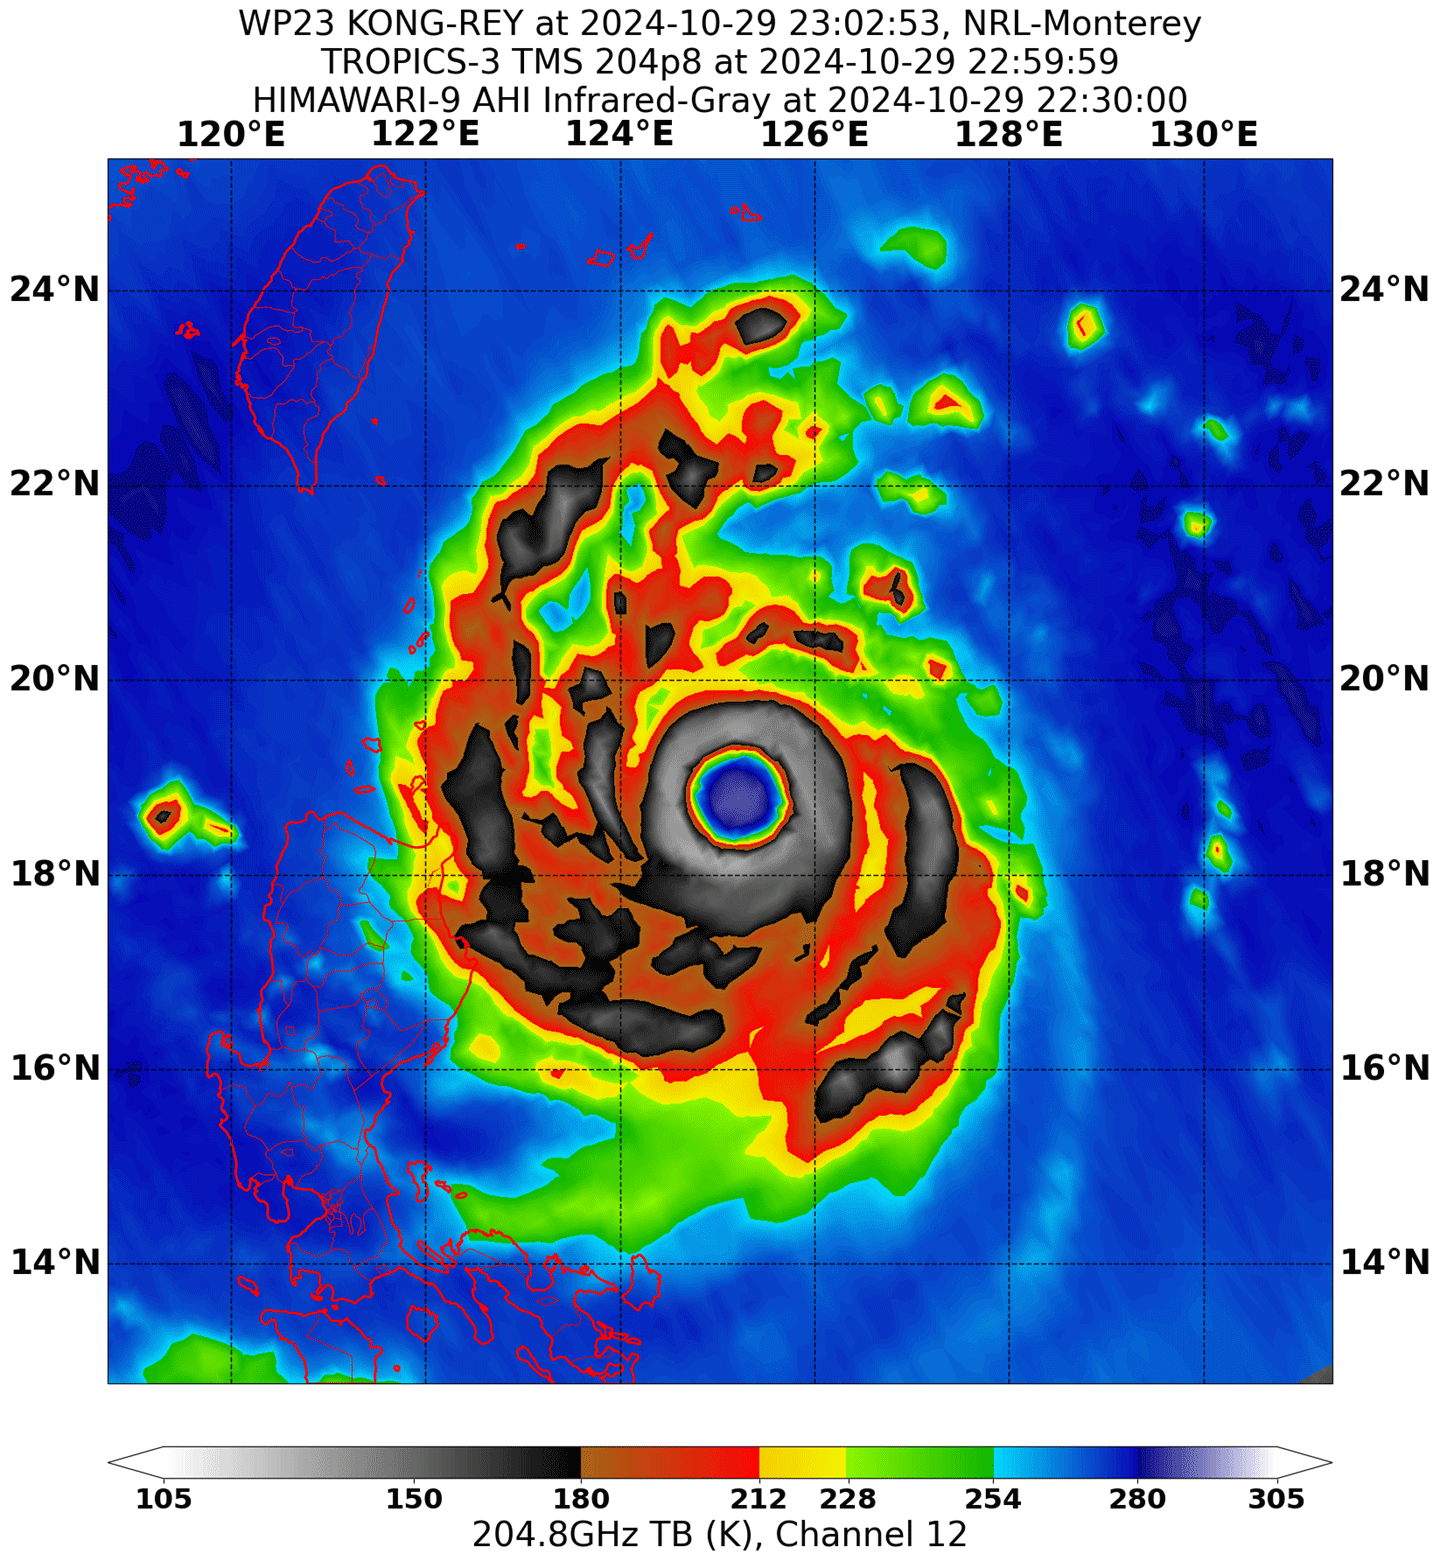
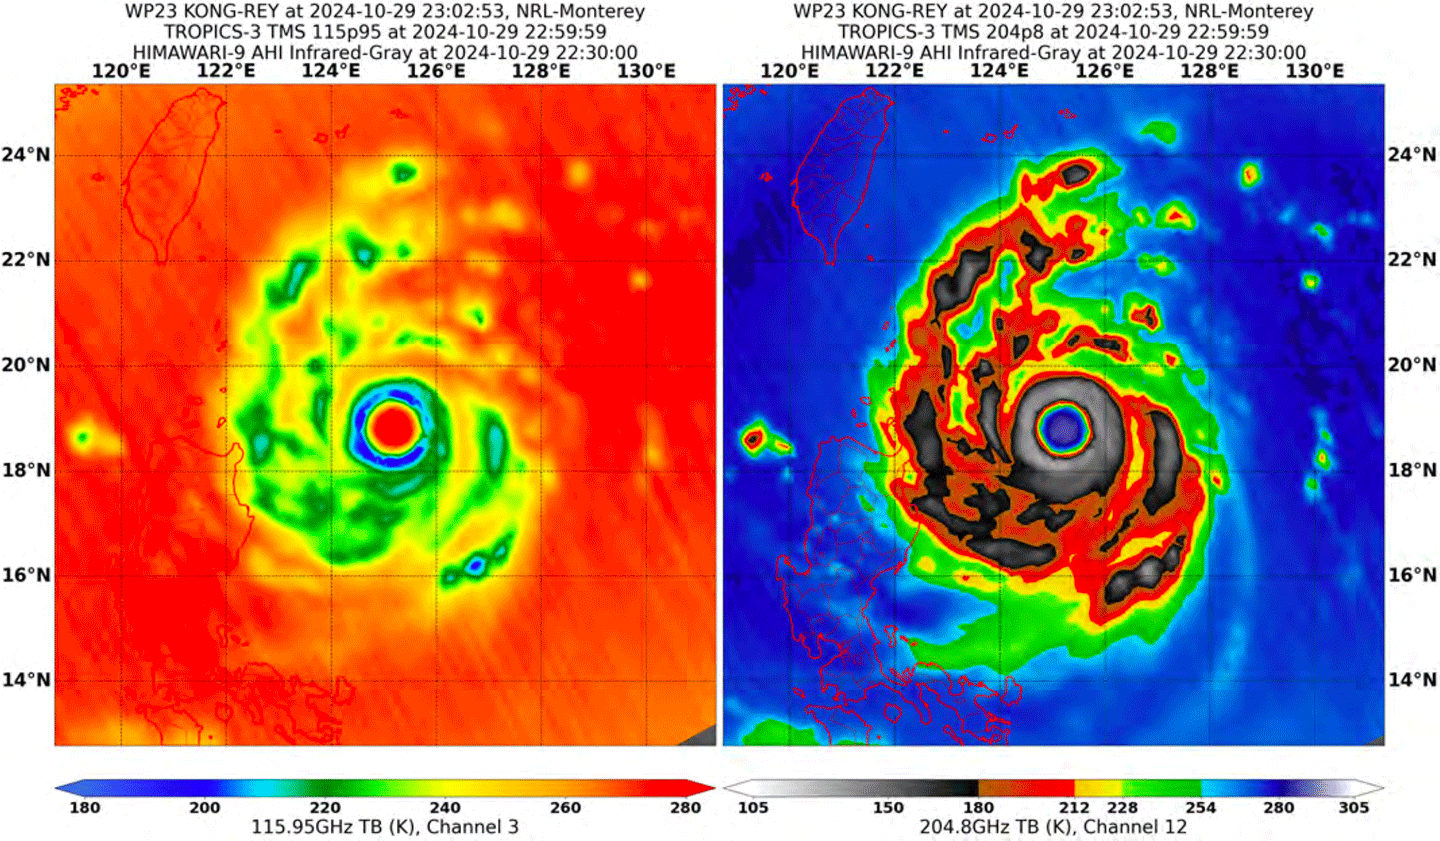
The imagery is focused on inner storm structure (near 91 and 205 GHz), temperature soundings (near 118 GHz), and moisture soundings (near 183 GHz). Spatial resolution at nadir is approximately 24 km (16.8 mi) for temperature and 17 km (10.6 mi) for moisture and precipitation, covering a swath of approximately 2000 km (1243 mi) in width. Researchers can use TROPICS data to create hundreds of high-resolution images of tropical cyclones throughout their lifecycle.

TROPICS figure 2
Figure 2. TROPICS space vehicle showing the CubeSat bus, radiometer payload, and deployed articulated solar array.
Figure credit: Blue Canyon Technologies and MIT Lincoln Laboratory

This article provides an overview of the two years of successful science operations of TROPICS, with a focus on the suite of geophysical Level-2 (L2) products (e.g., atmospheric vertical temperature and moisture profiles, instantaneous surface rain rate, and tropical cyclone intensity) and the science investigations resulting from these measurements. The complete article, available in the Proceedings Of The IEEE: Special Issue On Satellite Remote Sensing Of The Earth, provides more comprehensive details of the results.

From Pathfinder to Constellation

A single TROPICS satellite was launched as a Pathfinder vehicle on June 30, 2021, aboard a SpaceX Falcon 9 rideshare into a Sun-synchronous polar orbit. TROPICS was originally conceived as a six-satellite constellation, with two satellites launched into each of three low-inclination orbits. Regrettably, the first launch, on June 22, 2022 aboard an Astra Rocket 3.3, failed to reach orbit. While unfortunate, the mission could still proceed with four satellites and meet its baseline revisit rate requirement (with no margin), with the silver lining of an extra year of data gathered from TROPICS Pathfinder that allowed the tropical cyclone research community to prepare and test communications systems and data processing algorithms before the launch of the four remaining constellation satellites. These satellites were deployed on two separate launches – May 8, 2023 and May 26, 2023 aboard a Rocket Lab launch vehicle. The early testing accelerated calibration and validation for the constellation.

Collecting Data Critical to Understanding Tropical Cyclones

Tropical cyclone investigations require rapid quantitative observations to create 2D storm structure information. The four radiance data products in the TROPICS constellation [i.e., antenna temperature (L1a), brightness temperature (L1b), unified brightness temperature, and regularized scan pattern and limb-adjusted brightness temperature (L1c)] penetrate below the cloud top to gather data at greater frequency for a lower cost than current operational systems. The constellation data has been used to evaluate the development of the warm core and evolution of the ice water path within storms – two indicators of storm formation and subsequent changes in intensity.

The upper-level warm core is key to tropical cyclone development and intensification. Precipitation may instigate rapid intensification through convective bursts that are characterized by expanding cold cloud tops, increasing ice scattering, lightning, and towers of intense rain and ice water that are indicative of strong updrafts. TROPICS frequencies provide a wealth of information on scattering by precipitation-sized ice particles in the eyewall and rainbands that will allow for researchers to track the macrostructure of convective bursts in tropical cyclones across the globe. In addition, TROPICS data helps clarify how variations in environmental humidity around tropical cyclones affect storm structure and intensification.

Upper-level Warm Core

Analysis of the upper-level warm core of a tropical cyclone reveals valuable information about the storm’s development. The tropical cyclone community is using data from TROPICS to understand the processes that lead to precipitating ice structure and the role it plays in intensification – see Figure 3. While the warm core has been studied for decades, TROPICS provides a new opportunity to get high-revisit rate estimates of the atmospheric vertical temperature profile. By pairing the temperature profile with the atmospheric vertical moisture profile, researchers can define the relative humidity in the lower-to-middle troposphere, which is critical to understanding the impact of dry environmental air on storm evolution and structure.

TROPICS figure 3
Figure 3. TROPICS-3 imagery of Typhoon Kong-rey observed on October 29, 2024, a Category-5 storm that formed in the Pacific Ocean basin. Data gathered near 118 GHz was used to characterize temperature while data gathered near 205 GHz [right] revealed more about the inner structure of the storm. These data are used to define the warm core of the well-defined eye, located at 18.5° N.
Figure Credit: U.S. Naval Research Laboratory

Ice Water Path and Precipitation

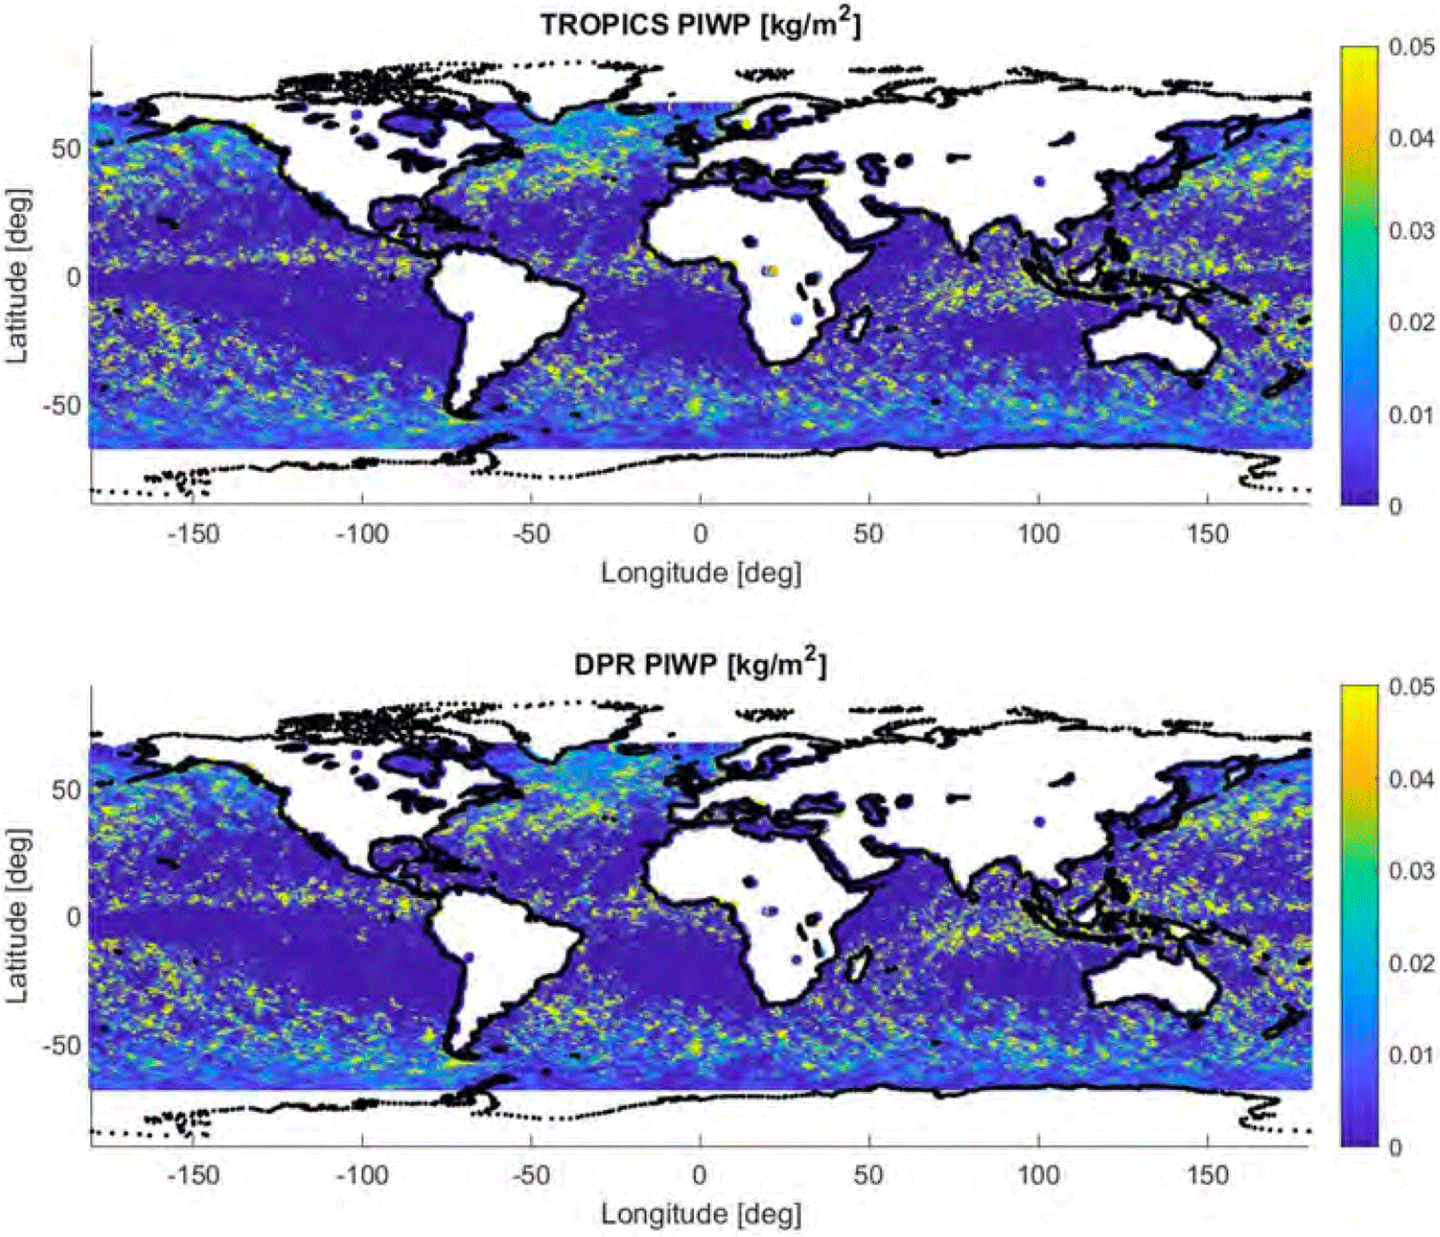
Another variable that helps to provide insight into the development of tropical cyclones is the ice water path, which details the total mass of ice present in a vertical column of the atmosphere and is therefore useful for characterizing the structure and intensity of these storms. Increasing ice water path can reflect strengthening convection within a storm and thereby be an indicator of likely intensification – see Figure 4. TROPICS is the first spaceborne sensor equipped with a 205-GHz channel that, along with the traditional 89, 118, and 183 GHz channels, is more sensitive to detecting precipitation-sized ice particles. In addition, the TROPICS Precipitation Retrieval and Profiling Scheme (PRPS) provides an estimate of precipitation. This scheme is based solely on the satellite radiances linked to precipitation rates, which can be used to generate products across time scales, from near-real-time to climatological scales.

TROPICS figure 4
Figure 4. Global precipitation ice water path (PIWP) retrievals derived from TROPICS [top] compared to those derived using data from the GPM Dual-frequency Precipitation Radar (GPM DPR) [bottom] The strong agreement between the two datasets is further validated through case studies over hurricanes, where TROPICS observations correspond well with known storm characteristics.

Collaborations and TROPICS Data in Action

To evaluate and enhance the data gathered by TROPICS, the TROPICS application team enlisted the assistance of operational weather forecasters that formed the TROPICS Early Adopters program. In 2018, the program connected the application team to stakeholders interested in using TROPICS data for research, forecasting, and decision making. This collaboration improved approaches to diagnose and predict tropical cyclones. For example, the National Hurricane Center (NHC) found that the new TROPICS channel at 204.8 GHz offered the best approach to capture convective storm structure, followed by the more traditionally used 91-GHz channel. In addition, the U.S. Joint Typhoon Warning Center (JTWC) has been using TROPICS data to center-fix tropical cyclones and identify cloud formations. In particular, the JTWC team found that the 91-GHz channel was most useful for identifying cloud structure. Both NHC and JTWC found the TROPICS high revisit rate to be beneficial.

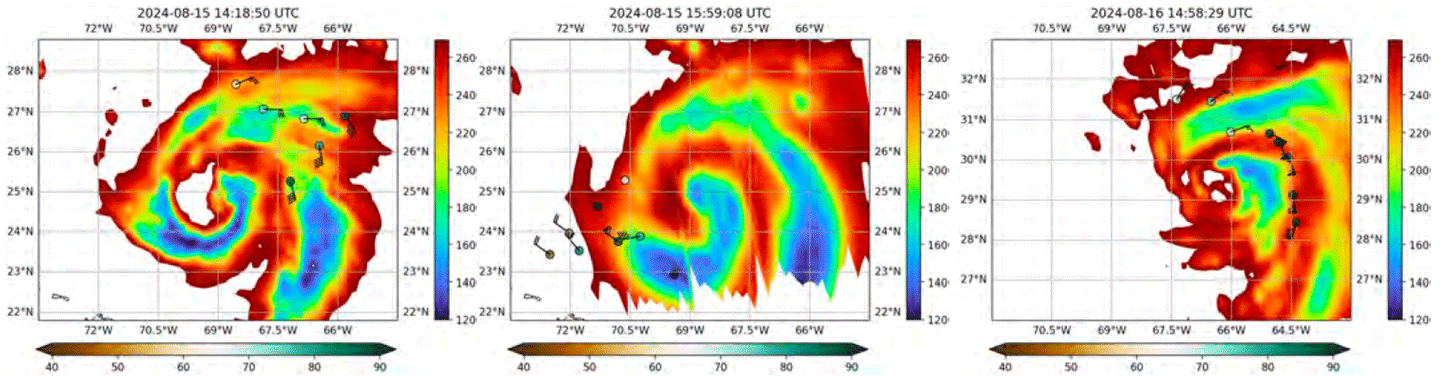
In 2024, the TROPICS applications team developed the TROPICS Satellite Validation Module as part of the NOAA Hurricane Research Division’s annual Advancing the Prediction of Hurricanes Experiment (APHEX). The module coordinated data collection from NOAA’s Hurricane Hunter aircraft beneath TROPICS satellite overpasses to provide data to calibrate and validate TROPICS temperature, moisture, and precipitation measurements. Using this approach, the Hurricane Hunter team tracked Hurricane Ernesto over the central North Atlantic on August 15 and 16, 2024 and used the data to characterize the environment of Ernesto’s rain bands – see Figure 5.

TROPICS figure 5
Figure 5. Brightness temperature (K) measured at 205 GHz from TROPICS-5 [right] and TROPICS-6 [left and center] from Hurricane Ernesto on August 15 and 16, 2024. The shaded circles denote 850–700 hPa relative humidity (%). Wind barbs are 850–700 hPa layer averaged winds (kt). Dropsonde data within 30 minutes of the TROPICS overpass times are plotted.

In addition, the team used TROPICS observations in combination with GPM constellation precipitation estimates to characterize the lifecycle of Hurricane Franklin, which formed on August 19, 2023 and underwent a period of rapid intensification about eight days later. Intensification of the storm, in particular the period of rapid intensification (45 knot increase in maximum winds in 24 hours), occurred in association with a decrease in environmental vertical wind shear, a contraction of the radius of maximum precipitation, and an increase in the precipitation rate. Intensification ended with the formation of secondary rainbands and an outward shift in the radius of maximum precipitation.

Conclusion

TROPICS data offer the potential for improving forecasts from numerical weather prediction models and operational forecasts using its high spatial resolution and high revisit rates that enable enhanced characterization of tropical cyclones globally. To date, the TROPICS mission has produced a high-quality aggregate data record spanning 10 billion observations and 10 satellite years, using relatively low-cost microwave sounder constellations. All L1 (i.e., radiances) and L2 (i.e., geophysical products) data products and Algorithm Theoretical Basis Documents are available to the general public through the Goddard Earth Sciences Data and Information Services Center (GES DISC). The GES DISC data discussed in this article include L1 and L2 products for TROPICS-1, TROPICS-3, TROPICS-5, and TROPICS-6.

TROPICS data has aided hurricane track forecasting for multiple storms as forecasters have used the data at multiple operational tropical cyclone forecast centers. Data gathered by TROPICS will soon be complemented by multiple commercial constellations that are coming online to improve the revisit rate and performance.

William Blackwell 
MIT Lincoln Laboratory
wjb@ll.mit.edu

Scott Braun
NASA GSFC, TROPICS Project Scientist

scott.a.braun@nasa.gov

Stacy Kish
Earth Observer Staff
Earthspin.science@gmail.com

Share

Details

Last Updated
Jun 09, 2025

Related Terms

Powered by WPeMatico

Get The Details…