PLANETS Units Have Landed – Free NASA-Funded Out-of-School Time Resources
4 min read
PLANETS Units Have Landed – Free NASA-Funded Out-of-School Time Resources
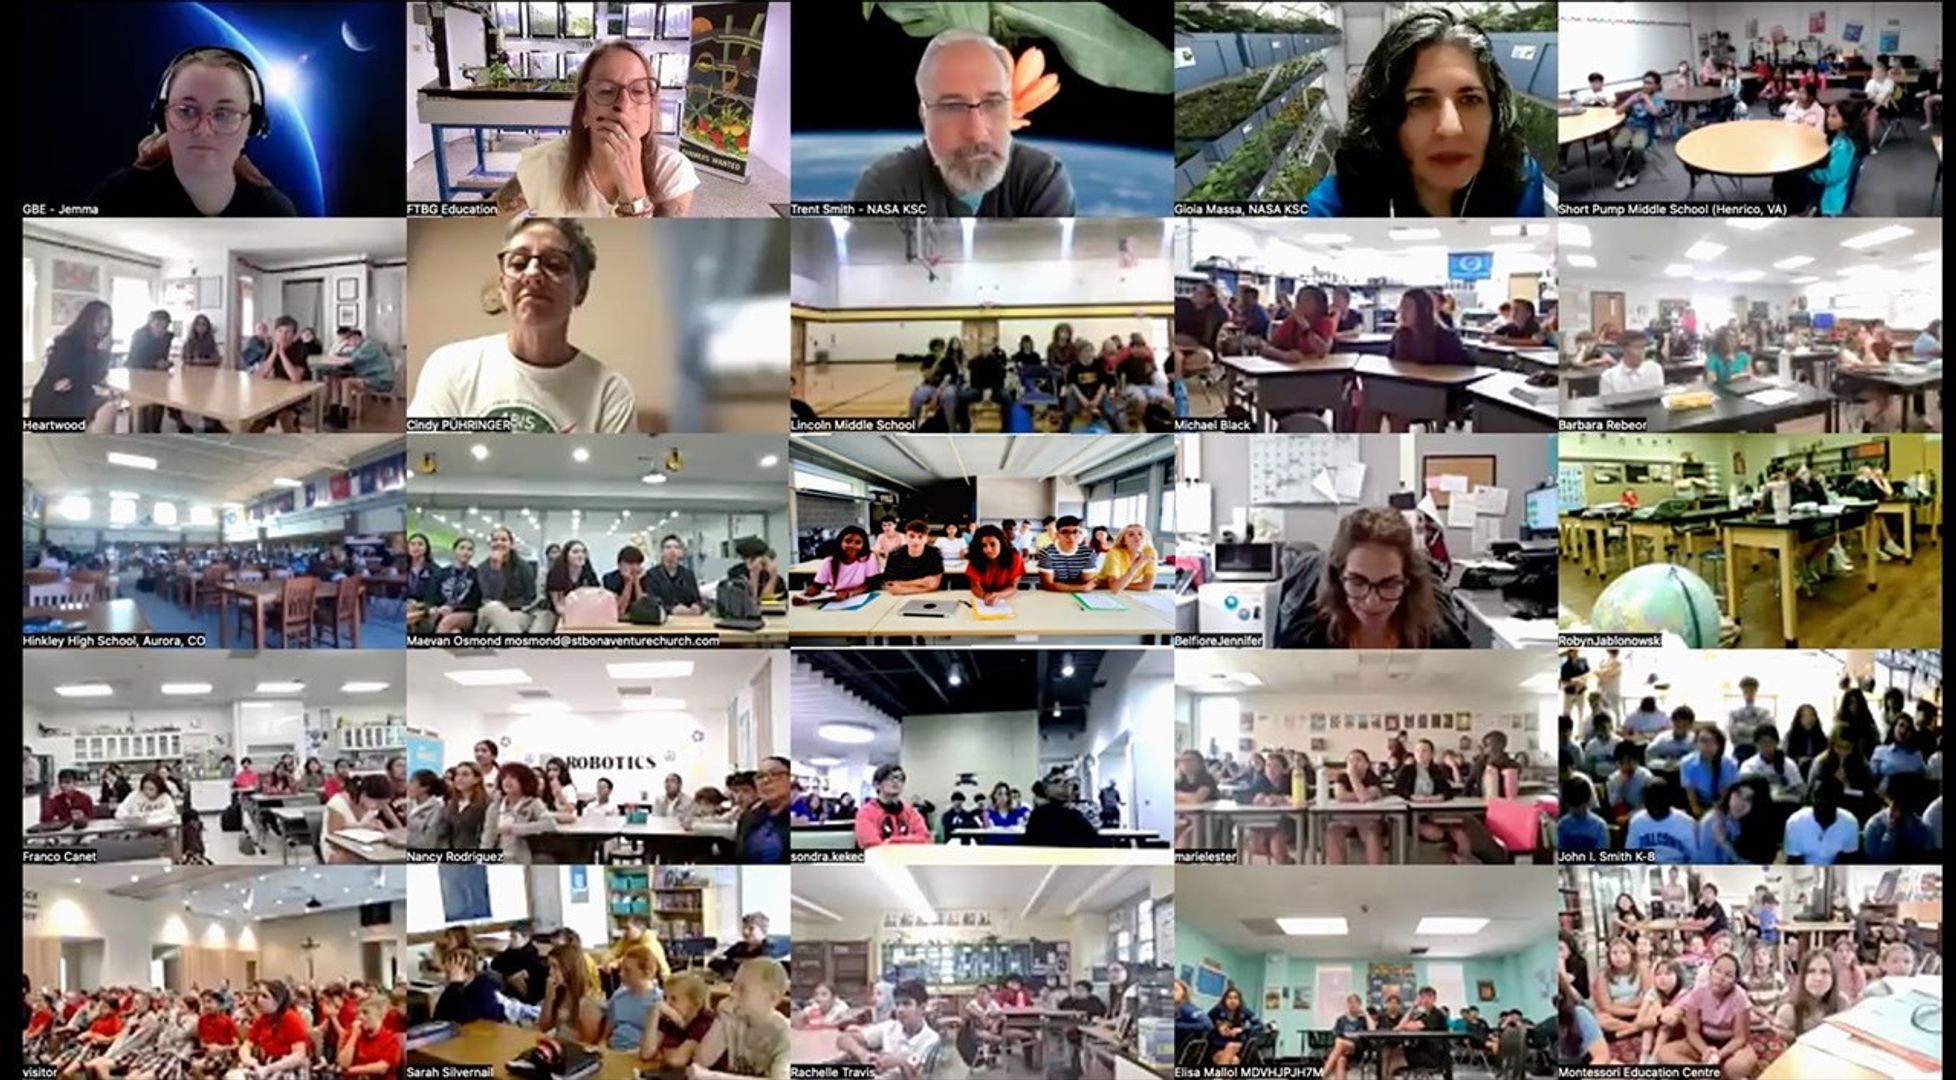
The NASA Science Activation program’s PLANETS (Planetary Learning that Advances the Nexus of Engineering, Technology, and Science) project, led by Northern Arizona University (NAU), is pleased to announce the official launch of three free out-of-school (OST) time units that give all learners in grades 3-5 and 6-8 the chance to do real planetary science and engineering. These units are supported by comprehensive educator guides, videos, and resources.
These three units – Space Hazards, Water in Extreme Environments, and Remote Sensing – have complementary engineering and science pathways that can be taught on their own or together. Subject matter experts in planetary science from the USGS Astrogeology Science Center were involved in every part of developing the activities, working with STEM (Science, Technology, Engineering, & Mathematics) education experts from Northern Arizona University Center for STEM Teaching & Learning, the Boston Museum of Science, and WestEd to ensure the activities are educational, engaging, and accurate.
PLANETS intentionally designed the units to benefit all learners. The curriculum reflects research-based pedagogical strategies, including those for multilingual learners, Indigenous learners, and learners with differing physical abilities. The units have been tested extensively in out-of-school time programs across the country and revised based on their feedback to ensure the needs of all learners are met. PLANETS provides a practical guide for out-of-school time educators with useful advice to effectively teach all students. All units also include educator background on the subject matter, as well as videos, and many useful tips and links to relevant NASA projects and resources.
“PLANETS is one of the most thoughtfully designed STEM resources I’ve used in an out-of-school setting. The hands-on activities are engaging, accessible, and grounded in real-world challenges that spark curiosity in every learner. What sets it apart is the intentional support for diverse learners and the clear, practical guidance for facilitators—making it truly turnkey for OST educators at any experience level. If you’re looking to build STEM identity, teamwork, and creative problem-solving in your program, PLANETS is a must.” ~ Kara Branch, CEO & Founder, Black Girls Do Engineer
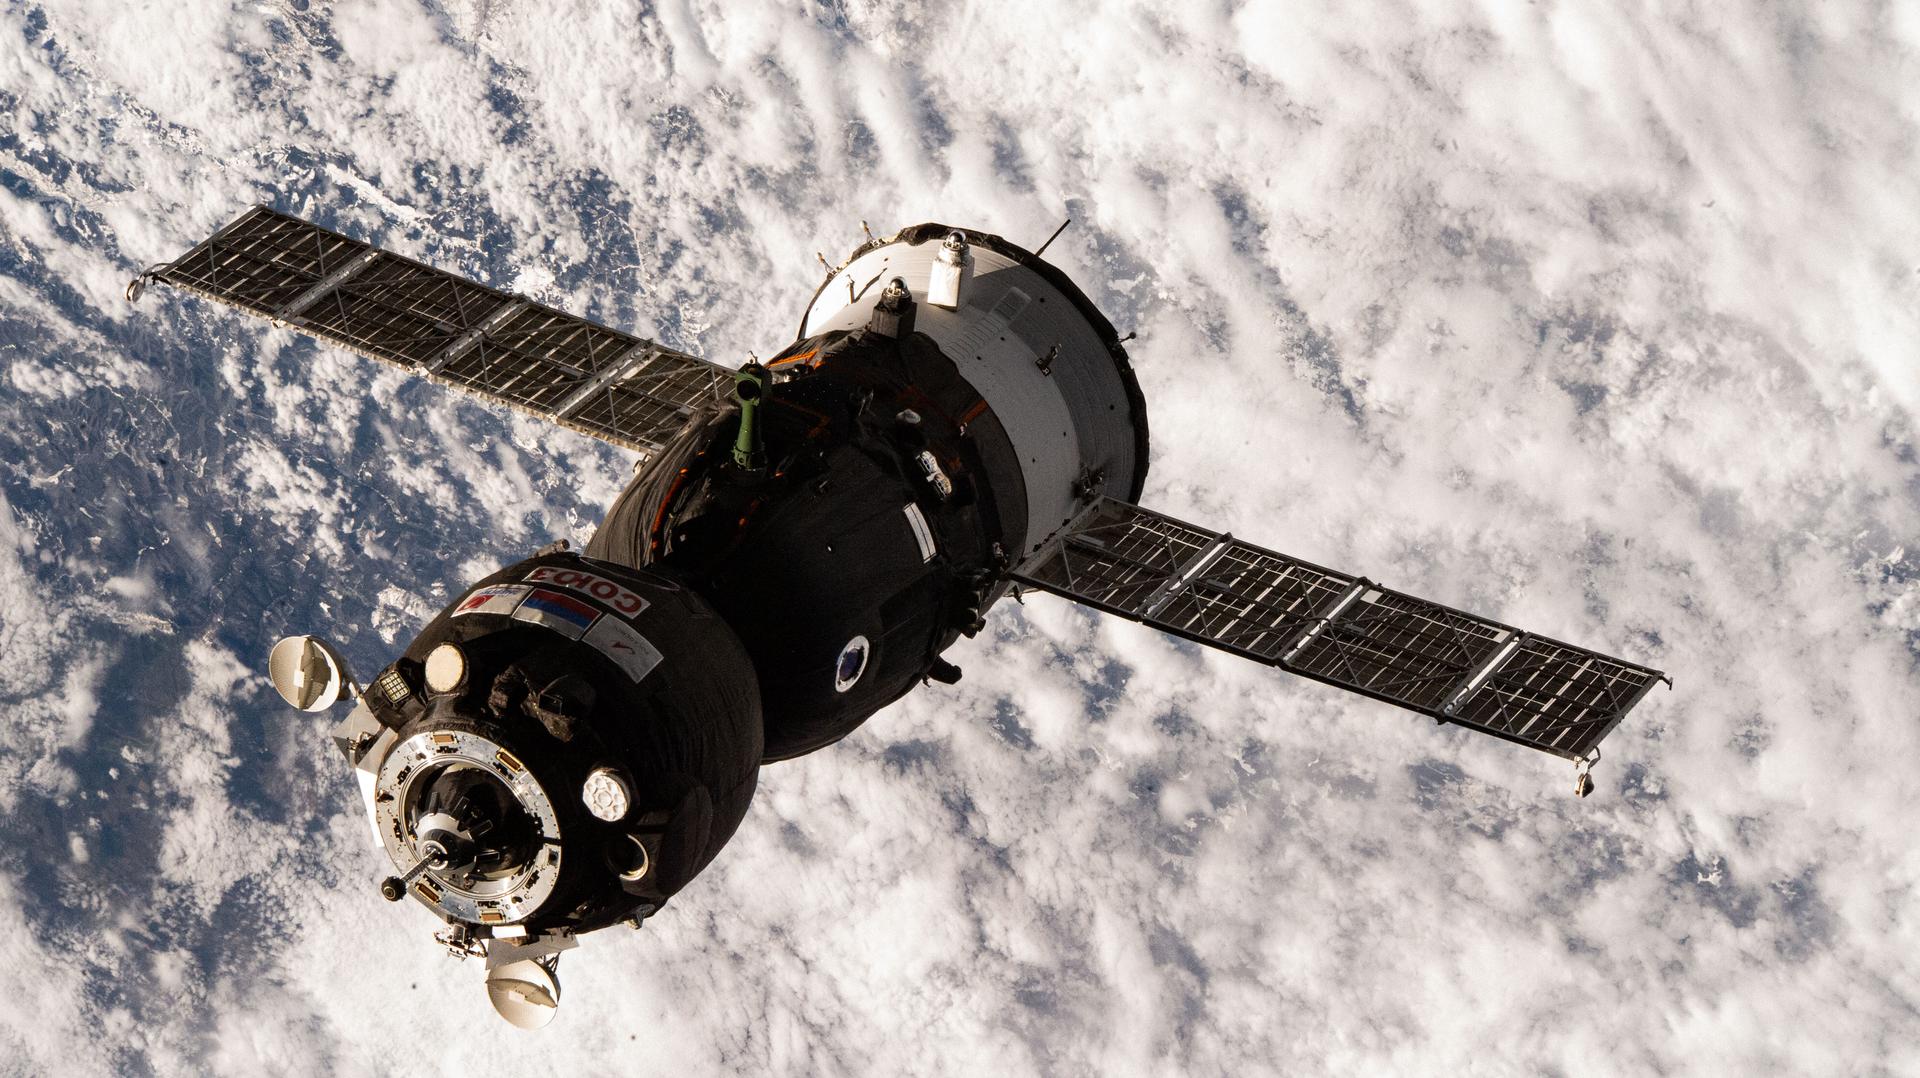
In the Space Hazards unit, intended for learners in grades 3-5, students play a card game to learn about how to protect against the different hazards that people face on Earth and that astronauts and robotic probes face in space. The engineering pathway for this unit presents students with a challenge: design a space glove that will keep astronauts safe while still allowing them to do their work.
The Water in Extreme Environments unit is designed for grades 6-8. In the science pathway, students use planet “water cards” to learn where there is the most water in our solar system (hint: it’s not Earth!). The engineering pathway introduces learners to the scarcity of fresh water, both in extreme environments on Earth and for astronauts in space. Students design a filtration system to purify water for reuse.
The engineering pathway for the Remote sensing unit, also designed for grades 6-8, puts students into the shoes of NASA spacecraft engineers, designing remote sensing devices to learn about the surface of planets, like Mars. The science pathway then uses real NASA remote sensing data from Mars landing site candidates to choose the best place to land a rover on Mars.
All PLANETS materials are available at no cost on the website: planets-stem.org. Check them out and empower every learner to see themselves as scientists and engineers.
PLANETS is supported by NASA under cooperative agreement award number NNX16AC53 and is part of NASA’s Science Activation Portfolio. Learn more about how Science Activation connects NASA science experts, real content, and experiences with community leaders to do science in ways that activate minds and promote deeper understanding of our world and beyond: https://science.nasa.gov/learn/about-science-activation/.
Details
NASA Science Editorial Team
Keep Exploring
Discover More Topics From NASA
Powered by WPeMatico
Get The Details…