Old Missions, New Discoveries: NASA’s Data Archives Accelerate Science

Old Missions, New Discoveries: NASA’s Data Archives Accelerate Science

5 min read

Old Missions, New Discoveries: NASA’s Data Archives Accelerate Science

 This solar system montage of the nine planets and four large moons of Jupiter in our solar system are set against a false-color view of the Rosette Nebula.
This montage of images taken by the Voyager spacecraft of the planets and four of Jupiter’s moons is set against a false-color picture of the Rosette Nebula with Earth’s moon in the foreground. Archival data from the Voyager missions continue to produce new scientific discoveries.
NASA/JPL/ASU

Every NASA mission represents a leap into the unknown, collecting data that pushes the boundaries of human understanding. But the story doesn’t end when the mission concludes. The data carefully preserved in NASA’s archives often finds new purpose decades later, unlocking discoveries that continue to benefit science, technology, and society.

“NASA’s science data is one of our most valuable legacies,” said Kevin Murphy, NASA’s chief science data officer at NASA Headquarters in Washington. “It carries the stories of our missions, the insights of our discoveries, and the potential for future breakthroughs.”

NASA’s science data is one of our most valuable legacies.

Kevin Murphy

Kevin Murphy

Chief Science Data Officer, NASA’s Science Mission Directorate

NASA’s Science Mission Directorate manages an immense amount of data, spanning astrophysics, biological and physical sciences, Earth science, heliophysics, and planetary science. Currently, NASA’s science data holdings exceed 100 petabytes—enough to store 20 billion photos from the average modern smartphone. This volume is expected to grow significantly with new missions.

This vast amount of data enables new discoveries, connecting scientific observations together in meaningful ways. Over 50% of scientific publications rely on archived data, which NASA provides to millions of commercial, government, and scientific users.

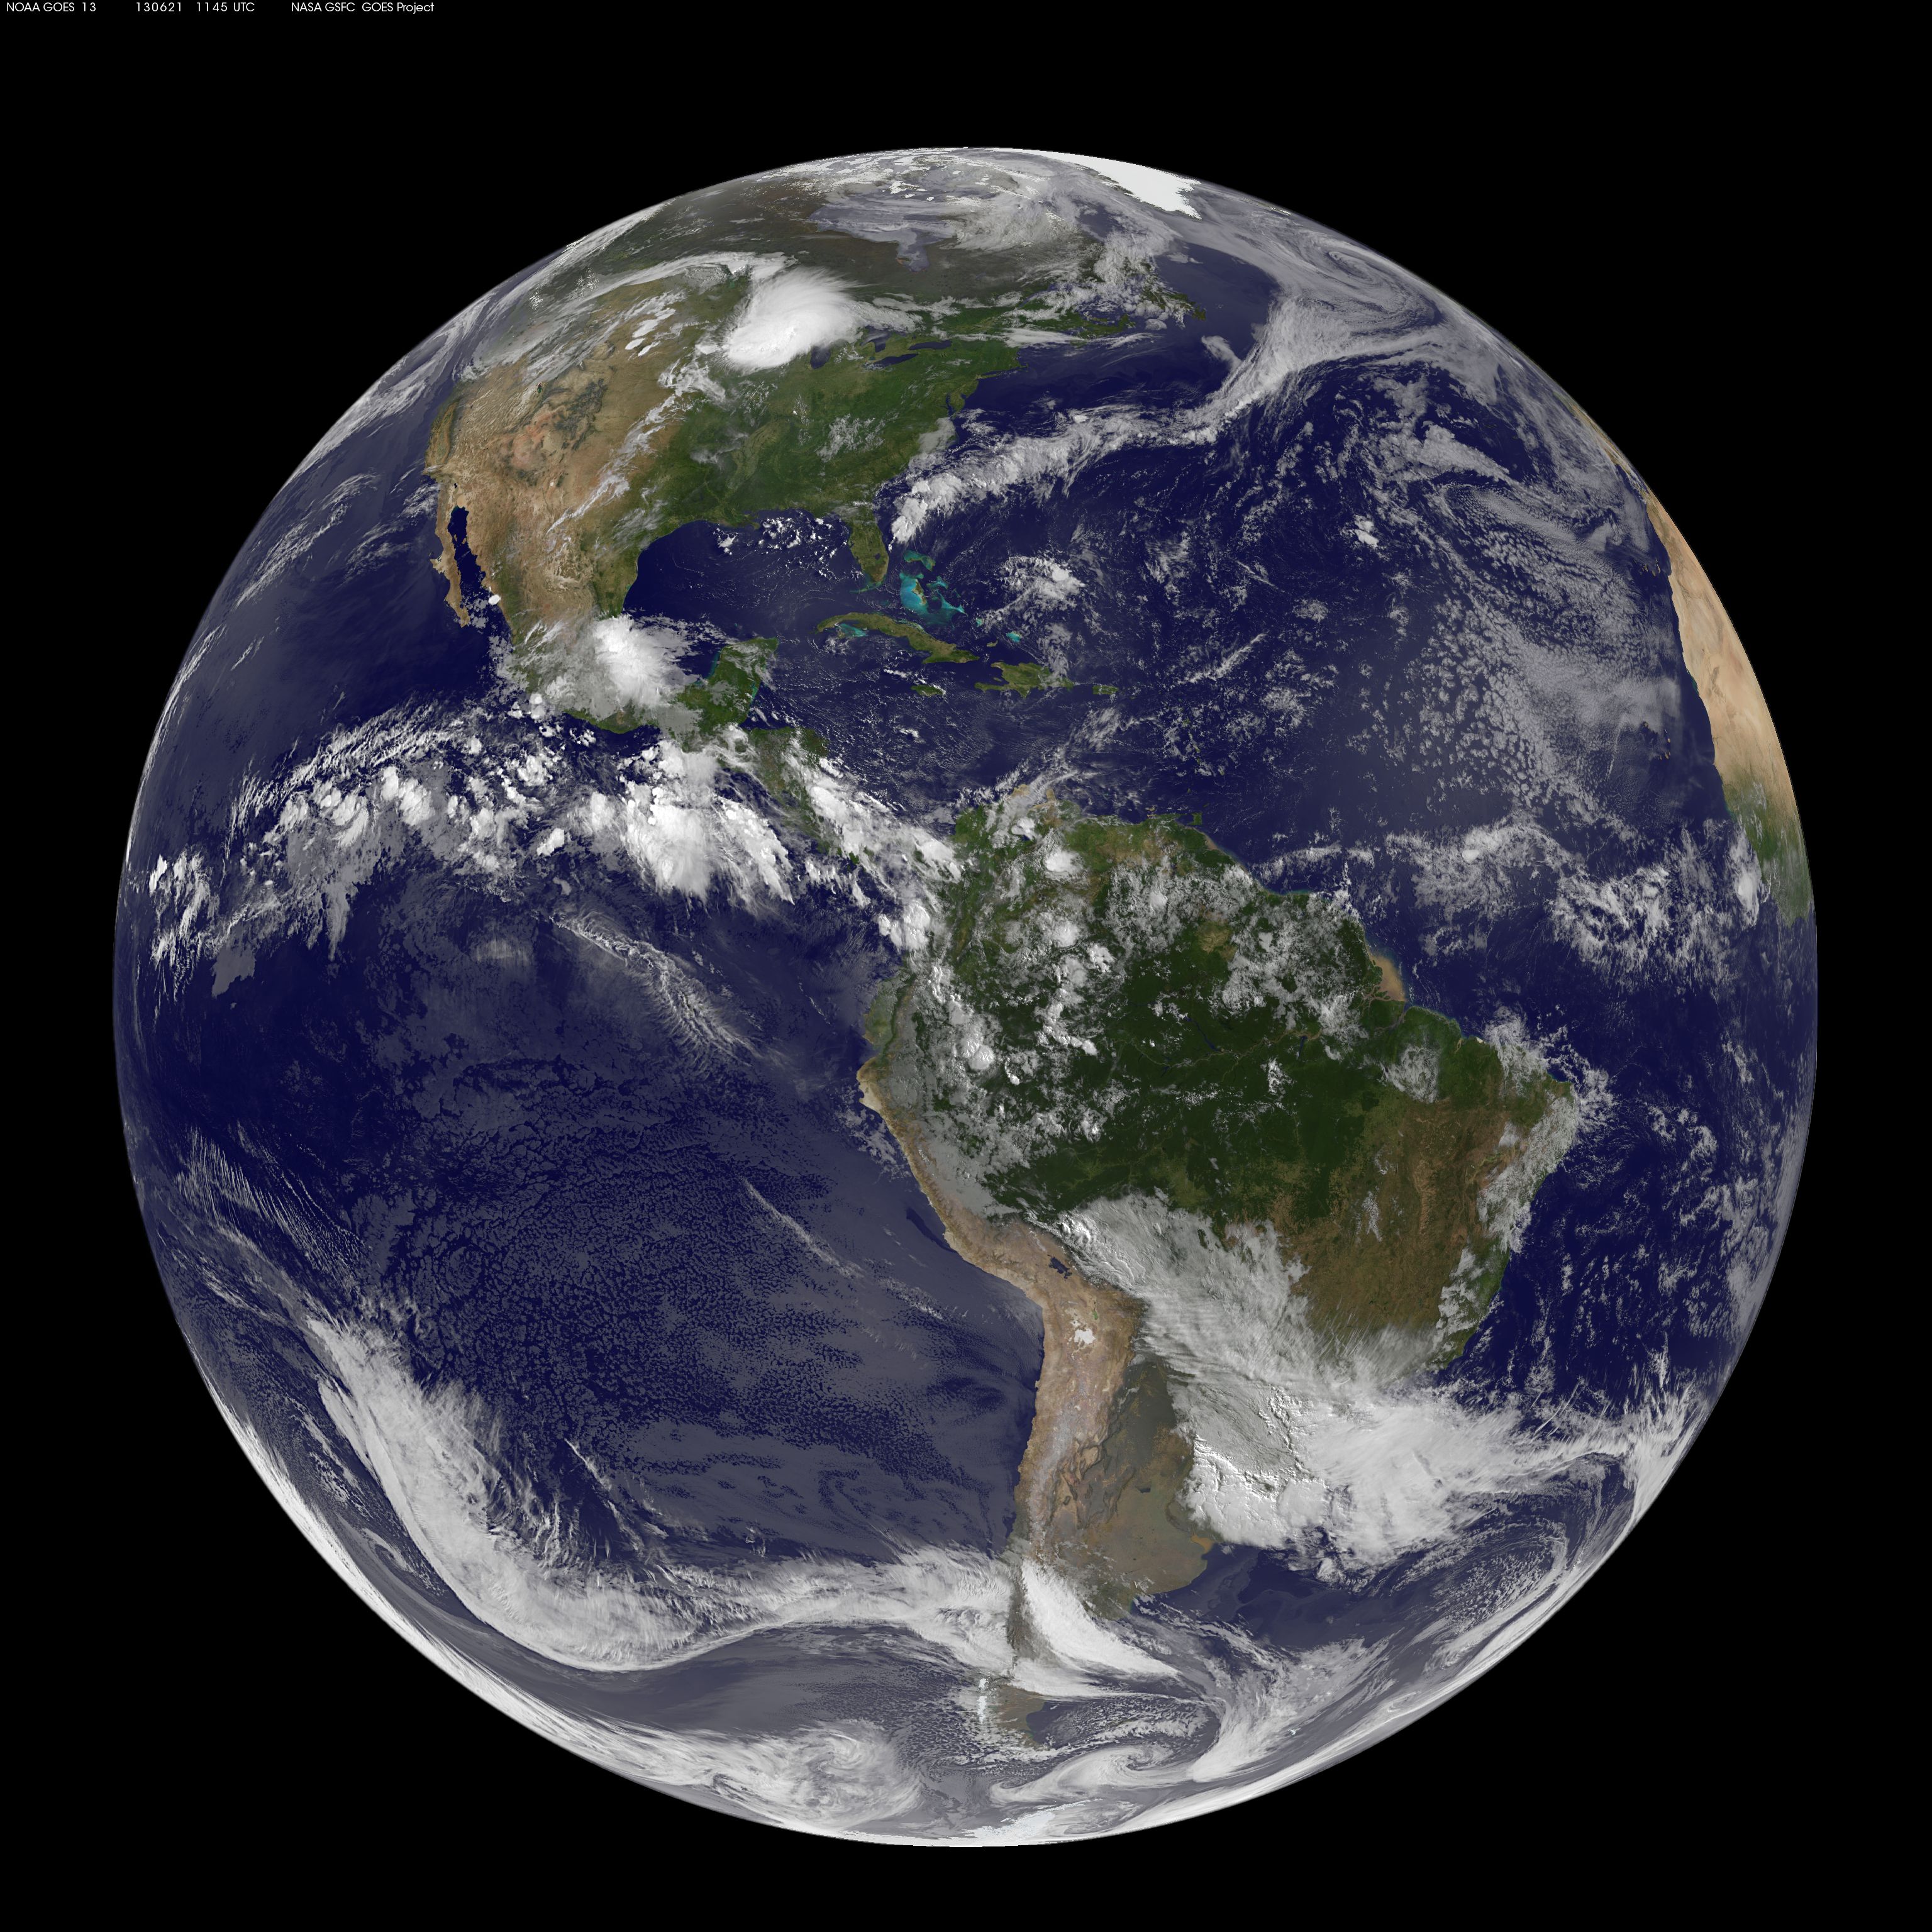
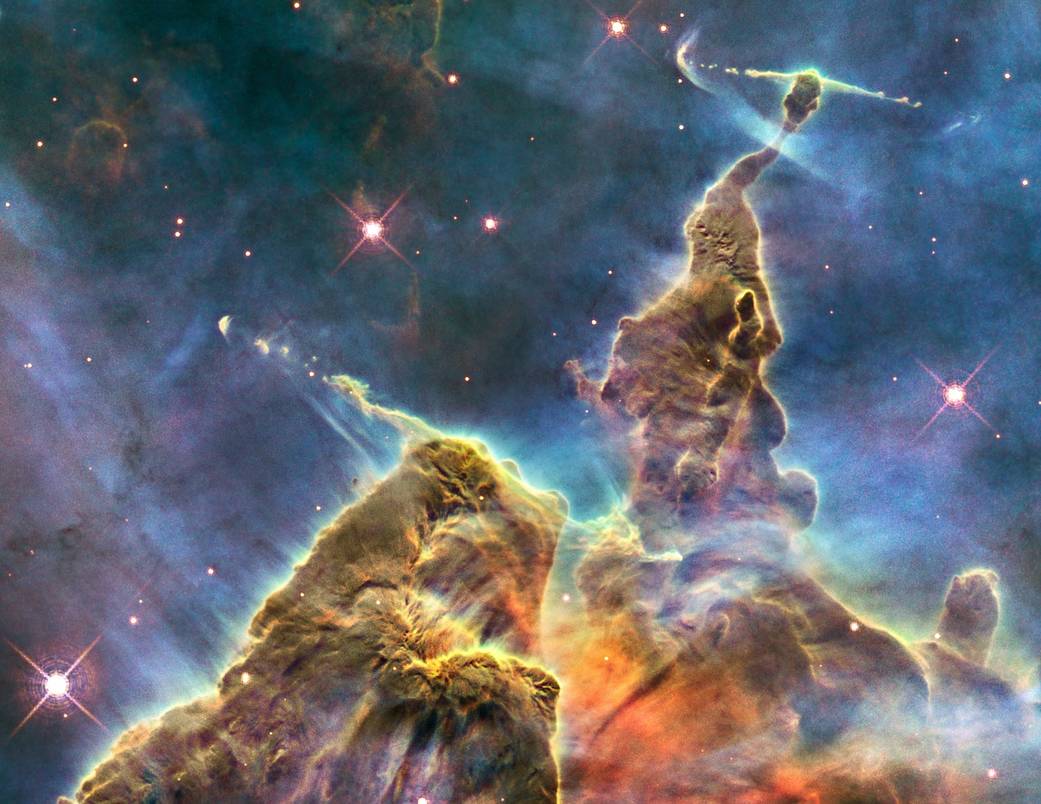
Image snippets showing Earth, the Carina nebula, Jupiter, the surface of the Sun, and a cell.
NASA’s five science divisions — Astrophysics, Biological and Physical Sciences, Earth Science, Heliophysics, and Planetary Science — store petabytes’ worth of data in their archives that enable scientists to continually make discoveries.
NASA

Managing and stewarding such massive volumes of information requires careful planning, robust infrastructure, and innovative strategies to ensure the data is accessible, secure, and sustainable. Continued support for data storage and cutting-edge technology is key to ensuring future generations of researchers can continue to explore using science data from NASA missions. 

Modern technology, such as image processing and artificial intelligence, helps unlock new insights from previous observations. For example, in 1986, NASA’s Voyager 2 spacecraft conducted a historic flyby of Uranus, capturing detailed data on the planet and its environment. Decades later, in the early 2000s, scientists used advanced image processing techniques on this archival data to discover two small moons, Perdita and Cupid, which had gone unnoticed during the initial analysis.

In 2024, researchers revisited this 38-year-old archival data and identified a critical solar wind event that compressed Uranus’s magnetosphere just before the Voyager 2 flyby. This rare event, happening only about four percent of the time, provided unique insights into Uranus’s magnetic field and its interaction with space weather.

The energized particles around Uranus defied scientist's understanding of how magnetic fields work to trap particle radiation.
The first panel of this artist’s concept depicts how Uranus’s magnetosphere (its protective bubble) was behaving before Voyager 2’s flyby. The second panel shows that an unusual kind of solar weather was happening at the same time as the spacecraft’s flyby, giving scientists a skewed view of Uranus’s magnetosphere. The work enabled by archival Voyager data contributes to scientists’ understanding of this enigmatic planet.
NASA/JPL-Caltech

NASA’s Lunar Reconnaissance Orbiter (LRO), launched in 2009, continues to provide data that reshapes our understanding of the Moon. In 2018, scientists analyzing the LRO’s archival data confirmed the presence of water ice in permanently shadowed regions at the Moon’s poles. 

In 2024, new studies out of NASA’s Goddard Space Flight Center in Greenbelt, Maryland, showed widespread evidence of water ice within the permanently shadowed regions outside the lunar South Pole, further aiding lunar mission planners. This discovery not only holds implications for lunar exploration but also demonstrates how existing data can yield groundbreaking insights.

Artist rendering of the Lunar Reconnaissance Orbiter LRO, above the moon.
Artist rendering of the Lunar Reconnaissance Orbiter (LRO) above the Moon. LRO carries seven instruments that make comprehensive remote sensing observations of the Moon and measurements of the lunar radiation environment. Archival data from LRO continues to help scientists make discoveries about the Moon.
NASA/GSFC

NASA’s data archives uncover the secrets of our own planet as well as others. In 2024, archaeologists published a study revealing a “lost” Mayan city in Campeche, Mexico that was previously unknown to the scientific community. The researchers identified the city in archival airborne Earth science data, including a 2013 dataset from NASA Goddard’s LiDAR Hyperspectral & Thermal Imager (G-LiHT) mission.

The Harmonized Landsat and Sentinel-2 (HLS) project provides frequent high-resolution observations of Earth’s surface. Data from HLS has been instrumental in tracking urban growth over time. By analyzing changes in land cover, researchers have used HLS to monitor the expansion of cities and infrastructure development. For example, in rapidly growing metropolitan areas, HLS data has revealed patterns of urban sprawl, helping planners analyze past trends to predict future metropolitan expansion.


1985
2010

This natural color Landsat 5 image shows the city of Ontario, California, from above in the year 1985. Vegetation is green and brown and urban structures are bright white and gray. There is a large dry riverbed in the northeast corner that is also bright white, but its nonlinear appearance sets it apart visually.
NASA’s Goddard Space Flight Center

This natural color Landsat 5 image shows the city of Ontario, California, from above in the year 2010. The airport, found in the southwest portion of the image, added a number of runways since 1985, and large warehousing structures now dominate the once rural areas surrounding the airport. Vegetation is green and brown and urban structures are bright white and gray. There is a large dry riverbed in the northeast corner that is also bright white, but its nonlinear appearance sets it apart visually.
NASA’s Goddard Space Flight Center

This natural color Landsat 5 image shows the city of Ontario, California, from above in the year 1985. Vegetation is green and brown and urban structures are bright white and gray. There is a large dry riverbed in the northeast corner that is also bright white, but its nonlinear appearance sets it apart visually.
NASA’s Goddard Space Flight Center
This natural color Landsat 5 image shows the city of Ontario, California, from above in the year 2010. The airport, found in the southwest portion of the image, added a number of runways since 1985, and large warehousing structures now dominate the once rural areas surrounding the airport. Vegetation is green and brown and urban structures are bright white and gray. There is a large dry riverbed in the northeast corner that is also bright white, but its nonlinear appearance sets it apart visually.
NASA’s Goddard Space Flight Center

1985

2010

Before and After

Urban Growth in Ontario, California

1985-2010


Thirty-five miles due east of downtown Los Angeles lies the city of Ontario, California. These natural color Landsat 5 images show the massive growth of the city between 1985 and 2010. The airport, found in the southwest portion of the images, added a number of runways, and large warehousing structures now dominate the once rural areas surrounding the airport. In these images, vegetation is green and brown, while urban structures are bright white and gray. A large dry riverbed in the northeast corner is also bright white, but its nonlinear appearance sets it apart visually. Researchers use archival data from Landsat and other satellites to track the growth of cities like Ontario, CA over time.

These discoveries represent only a fraction of what’s possible. NASA is investing in new technologies to harness the full potential of its data archives, including artificial intelligence (AI) foundation models—open-source AI tools designed to extract new findings from existing science data.

“Our vision is to develop at least one AI model for each NASA scientific discipline, turning decades of legacy data into a treasure trove of discovery,” said Murphy. “By embedding NASA expertise into these tools, we ensure that our scientific data continues to drive innovation across science, industry, and society for generations to come.”

Developed under a collaboration between NASA’s Office of the Chief Science Data Officer, IBM, and universities, these AI models are scientifically validated and adaptable to new datasets, making them invaluable for researchers and industries alike.

“It’s like having a virtual assistant that leverages decades of NASA’s knowledge to make smarter, quicker decisions,” said Murphy.

On June 22, 2013, the Operational Land Imager (OLI) on Landsat 8 captured this false-color image of the East Peak fire burning in southern Colorado near Trinidad. Burned areas appear dark red, while actively burning areas look orange. Dark green areas are forests; light green areas are grasslands. Data from Landsat 8 were used to train the Prithvi artificial intelligence model, which can help detect burn scars.
NASA Earth Observatory

The team’s Earth science foundation models—the Prithvi Geospatial model and Prithvi Weather model—analyze vast datasets to monitor Earth’s changing landscape, track weather patterns, and support critical decision-making processes.

Building on this success, the team is now developing a foundation model for heliophysics. This model will unlock new insights about the dynamics of solar activity and space weather, which can affect satellite operations, communication systems, and even power grids on Earth. Additionally, a model designed for the Moon is in progress, aiming to enhance our understanding of lunar resources and environments.

This investment in AI not only shortens the “data-to-discovery” timeline but also ensures that NASA’s data archives continue to drive innovation. From uncovering new planets to informing future exploration and supporting industries on Earth, the possibilities are boundless.

By maintaining extensive archives and embracing cutting-edge technologies, the agency ensures that the data collected today will continue to inspire and inform discoveries far into the future. In doing so, NASA’s legacy science data truly remains the gift that keeps on giving.

By Amanda Moon Adams
Communications Lead for the Office of the Chief Science Data Officer

Powered by WPeMatico

Get The Details…

Artemis II Core Stage Integration – Complete!

Artemis II Core Stage Integration – Complete!

The Artemis II core stage (a butterscotch orange cylinder in the middle) and solid rocket boosters (the white cylinders, branded with the NASA "worm" logo on each side of the core stage) are joined together by teams inside the Vehicle Assembly Building (VAB). The view is from the ground, looking far upward, to show the full height of the core stage - 212 feet. The inside of the VAB has many platforms and catwalks around the center of the building, which is open.
NASA/Frank Michaux

Technicians from NASA and primary contractor Amentum join the SLS (Space Launch System) rocket with the stacked solid rocket boosters for the Artemis II mission at NASA’s Kennedy Space Center in Florida on March 23, 2025. The core stage is the largest component of the rocket, standing 212 feet tall and weighing about 219,000 pounds with its engines. The stage is the backbone of the rocket, supporting the launch vehicle stage adapter, interim cryogenic propulsion stage, Orion stage adapter, and the Orion spacecraft.

Artemis II is the first crewed test flight under NASA’s Artemis campaign and is another step toward missions on the lunar surface and helping the agency prepare for future human missions to Mars.

Image credit: NASA/Frank Michaux

Powered by WPeMatico

Get The Details…
Tiffany L. Fairley

Career Spotlight: Technologist (Ages 14-18)

Career Spotlight: Technologist (Ages 14-18)

4 Min Read

Career Spotlight: Technologist (Ages 14-18)

NASA astronaut Kate Rubins uses tongs to pick up a geologic sample while wearing the Joint AR (Joint Augmented Reality Visual Informatics System) display during an advanced technology run

What does a technologist do?

Technologists are professionals who research, develop, and test emerging technologies. They also find useful ways to put new technologies to work. A technologist is an expert in a specific type of technology, often within a specific field. Many industries rely on innovations developed by technologists. Some of these include aerospace, research, manufacturing, healthcare, and information technology.

NASA technologists make use of technological advancements to improve NASA’s capabilities and better meet the needs of its missions. They also oversee how technologies developed by NASA can improve life on Earth through commercial products. These products are called spinoffs. For examples of how NASA shows up in your everyday life, visit: https://spinoff.nasa.gov.

What are some technology careers at NASA?

Instrument scientist: Works to improve or develop instruments that collect data. In aerospace, an instrument is a sensor or other device that takes measurements or gathers scientific information. This role may include working with other specialties to design, create, and test scientific instruments.

Data scientist: Uses computer science to create tools that manage data. Some of the tasks a data scientist might perform include developing predictive models, machine learning algorithms, or software to extract useful information from large sets of data.

Information technology (IT) specialist: Designs, maintains, implements, and protects IT systems across the agency. Develops software, manages IT projects, and develops applications to support both organizational and mission operations.

Members of a JPL team
One of three small lunar rovers that are part of a NASA technology demonstration called CADRE (Cooperative Autonomous Distributed Robotic Exploration) is prepared for shipping in a clean room at the agency’s Jet Propulsion Laboratory in Southern California.
NASA/JPL-Caltech

How can I become a technologist?

There are many different types of careers in technology, and the requirements vary. While you’re in high school, explore the possibilities and learn about the specialties and roles that will fit your interests. Then, investigate the academic path and experience you’ll need to eventually be hired into those roles. Current job openings, guidance counselors, and mentors can shed light on the types of certifications or degrees required. With this information, you can begin planning for the skills and education you’ll need.

It’s important to remember that technology is always advancing. Even after you’ve launched your technologist career, a “lifelong learning” mindset will help you keep up with new innovations and skills.

How can I start preparing today to become a technologist?

Start growing your technology skills today with hands-on activities created by NASA STEM. Looking for something more involved? Many of NASA’s student challenges, competitions, and activities offer authentic experience in aerospace technology, computer science, and more.

Students aged 16 and up who are U.S. citizens are eligible to apply for a paid NASA internship. Interns work on real projects with the guidance of a NASA mentor. Internship sessions are held each year in spring, summer, and fall; visit NASA’s Internships website to learn about important deadlines and current opportunities.

Frank Pena, test director, checks on the 10-foot Mock Truss-Braced Wing at NASA’s Armstrong Flight Research Center in Edwards, California. The aircraft concept involves a wing braced on an aircraft using diagonal struts that also add lift and could result in significantly improved aerodynamics.
NASA

Advice from NASA technologists

“Think about your personal interests and passions, and also the impact you’d like your work to have. What do you feel personally interested in when it comes to science and technology? Is there a problem that you think is very important for our society to solve? Often there is a research or technology field that can combine those two things!” – Olivia Tyrrell, NASA research engineer

What do you feel personally interested in when it comes to science and technology?

Olivia Tyrrell

Olivia Tyrrell

NASA Research Engineer

“If you like to create things or find solutions to problems, working in technology is a great choice. Scientists identify problems, engineers solve problems, but ultimately, we need to create new technologies, new things, new gadgets.  Technologists are building the next generation toolbox for engineers and scientists to pull from, enabling everyone to solve problems in more effective and innovative ways. (Technologists invent things… what’s cooler than that?!)” – Kristen John, technical integration manager for lunar dust mitigation

Additional Resources

NASA Data Science, Cybersecurity, and IT Careers

NASA Space Technology

Technology | NASA+

Powered by WPeMatico

Get The Details…
Sandra May

Career Spotlight: Scientist (Ages 14-18)

Career Spotlight: Scientist (Ages 14-18)

4 Min Read

Career Spotlight: Scientist (Ages 14-18)

A scientist in a white coat, mask, hair net, and purple gloves holds up a clear vial with a black substance inside near the camera.

What does a scientist do?

Science is about exploring answers to questions. A scientist uses research and evidence to form hypotheses, test variables, and then share their findings.

NASA scientists conduct groundbreaking research to answer some of humanity’s most profound questions. Most scientists start as project scientists in their early careers. They spend a lot of time publishing their peer-reviewed literature and presenting scientific research. Senior-level scientists provide leadership in the NASA community, actively publish research group work, and take on management roles.

What are some of the different types of scientists that work at NASA?

Many types of scientists work at NASA to support its wide variety of missions. The agency’s scientists research the foods we send to space, the habitability of other planets, the weather in space, and so much more. Here are a few examples of types of scientists at NASA.

Planetary scientist: Discovers and studies the planetary objects in our solar system. These efforts shed light on the history of the solar system and the distribution of life within it.

Astrobiologist: Studies the origins of life, how life evolves, and where it might be found in the universe.

Astrophysicist: Studies the physical and chemical structures of stars, planets, and other natural objects found in space.

Biological/physical scientist: Studies how biological and physical processes work in challenging environments like space. This information helps NASA design longer human space missions and also benefits life on Earth.

Earth scientist: Uses observations and data from satellites and other sources to study Earth’s atmosphere, oceans, land cover, and land use.

Heliophysicist: Studies the Sun and its behaviors, such as magnetic fields, solar wind, and space weather. This knowledge helps us better understand and predict the Sun’s effects on Earth and in space.

Jess Bunchek, a pseudonaut and associate scientist at NASA’s Kennedy Space Center in Florida, prepares red romaine lettuce seeds for a germination test inside the Space Station Processing Facility.

How can I become a scientist?

Focus on building your scientific knowledge and skills. You can do this by taking challenging academic courses, participating in science fairs, and joining extracurricular activities that have a scientific focus. This is also a good time to research what types of sciences you’re most interested in, possible careers in those fields, and academic degrees required for those jobs.

Scientists typically need at least a four-year degree. Most pursue a master’s degree or even a doctorate (Ph.D.) to become experts in their field.

How can I start preparing today to become a scientist?

Interested in applying some science skills right away? NASA provides a variety of hands-on activities for a range of skill levels. The space agency also offers student challenges, competitions, and activities that provide authentic experience in a variety of science fields. For up-to-date opportunities, visit:

NASA also offers paid internships for U.S. citizens aged 16 and up. Interns work on real projects with the guidance of a NASA mentor. Internship sessions are held each year in spring, summer, and fall; visit NASA’s Internships website to learn about important deadlines and current opportunities.

NASA scientist Trevor Graff peers at a calibration target designed to help fine-tune settings on the Scanning Habitable Environments with Raman & Luminescence for Organics and Chemicals (SHERLOC) instrument carried aboard NASA's Perseverance Mars rover.

Advice from NASA scientists

    “Take advantage of opportunities in different fields like attending summer classes, volunteering on the weekends, visiting museums, attending community lectures, and reading introductory books at the library. These are a few ways to expand your scope of possibility within the sciences, while simultaneously narrowing your focus in a field.” – Angela Garcia, exploration geologist

    “The key to being a scientist is to love asking questions. If you are fascinated about how and why things work — you are already a scientist.”

    Nicola Fox

    Nicola Fox

    NASA Associate Administrator, Science Mission Directorate

    “One general skill that is often overlooked is the ability to write well and clearly. There’s a misconception that being a scientist means using big words and writing in ways that no one understands, when it’s actually the opposite. The ability to communicate your thoughts and ideas so that a child can understand is not easy, but it’s essential for good scientific writing.” – Matt Mickens, NASA horticulturist

    Additional Resources

    Careers in Science and Research

    NASA Science Career Path Navigator

    NASA Science Mission Directorate

    People of NASA Science

    Explore NASA+ Scientist Resources

    Powered by WPeMatico

    Get The Details…
    Sandra May

    20-Year Hubble Study of Uranus Yields New Atmospheric Insights

    20-Year Hubble Study of Uranus Yields New Atmospheric Insights

    5 Min Read

    20-Year Hubble Study of Uranus Yields New Atmospheric Insights

    Graphic titled “Hubble Space Telescope – Observations of Uranus,” with 16 images of Uranus, arranged in a 4 by 4 grid showing changes in appearance of Uranus as observed by Hubble between 2002 and 2022. Columns are labeled with observation year, from left to right: 2002; 2012; 2015; and 2022. Rows are labeled from top to bottom: visible light; visible and near infrared; aerosols/haze; and methane depletion. In the visible light images in the top row, Uranus appears blue-green with faint vertical bends of slightly lighter or darker color. In the visible and near infrared images in the second row, Uranus is very colorful, with deep neon blue to neon green bands within an orange-red glow that outlines the edge of the planet. In the two bottom rows of images, Uranus appears in grayscale, with vertical bands ranging from dark gray to almost white. All four rows of images show changes from observation to observation (left to right). For a given year, all four images in the column show similar banding patterns.
    The image columns show the change of Uranus for the four years that STIS observed Uranus across a 20-year period. Over that span of time, the researchers watched the seasons of Uranus as the south polar region darkened going into winter shadow while the north polar region brightened as northern summer approaches.
    Credits:
    NASA, ESA, Erich Karkoschka (LPL)

    The ice-giant planet Uranus, which travels around the Sun tipped on its side, is a weird and mysterious world. Now, in an unprecedented study spanning two decades, researchers using NASA’s Hubble Space Telescope have uncovered new insights into the planet’s atmospheric composition and dynamics. This was possible only because of Hubble’s sharp resolution, spectral capabilities, and longevity. 

    The team’s results will help astronomers to better understand how the atmosphere of Uranus works and responds to changing sunlight. These long-term observations provide valuable data for understanding the atmospheric dynamics of this distant ice giant, which can serve as a proxy for studying exoplanets of similar size and composition.

    When Voyager 2 flew past Uranus in 1986, it provided a close-up snapshot of the sideways planet. What it saw resembled a bland, blue-green billiard ball. By comparison, Hubble chronicled a 20-year story of seasonal changes from 2002 to 2022. Over that period, a team led by Erich Karkoschka of the University of Arizona, and Larry Sromovsky and Pat Fry from the University of Wisconsin used the same Hubble instrument, STIS (the Space Telescope Imaging Spectrograph), to paint an accurate picture of the atmospheric structure of Uranus. 

    Uranus’ atmosphere is mostly hydrogen and helium, with a small amount of methane and traces of water and ammonia. The methane gives Uranus its cyan color by absorbing the red wavelengths of sunlight.

    The Hubble team observed Uranus four times in the 20-year period: in 2002, 2012, 2015, and 2022. They found that, unlike conditions on the gas giants Saturn and Jupiter, methane is not uniformly distributed across Uranus. Instead, it is strongly depleted near the poles. This depletion remained relatively constant over the two decades. However, the aerosol and haze structure changed dramatically, brightening significantly in the northern polar region as the planet approaches its northern summer solstice in 2030.

    Graphic titled “Hubble Space Telescope – Observations of Uranus,” with 16 images of Uranus, arranged in a 4 by 4 grid showing changes in appearance of Uranus as observed by Hubble between 2002 and 2022. Columns are labeled with observation year, from left to right: 2002; 2012; 2015; and 2022. Rows are labeled from top to bottom: visible light; visible and near infrared; aerosols/haze; and methane depletion. In the visible light images in the top row, Uranus appears blue-green with faint vertical bends of slightly lighter or darker color. In the visible and near infrared images in the second row, Uranus is very colorful, with deep neon blue to neon green bands within an orange-red glow that outlines the edge of the planet. In the two bottom rows of images, Uranus appears in grayscale, with vertical bands ranging from dark gray to almost white. All four rows of images show changes from observation to observation (left to right). For a given year, all four images in the column show similar banding patterns.
    The image columns show the change of Uranus for the four years that STIS observed Uranus across a 20-year period. Over that span of time, the researchers watched the seasons of Uranus as the south polar region darkened going into winter shadow while the north polar region brightened as northern summer approaches.
    NASA, ESA, Erich Karkoschka (LPL)

    Uranus takes a little over 84 Earth years to complete a single orbit of the Sun. So, over two decades, the Hubble team has only seen mostly northern spring as the Sun moves from shining directly over Uranus’ equator toward shining almost directly over its north pole in 2030. Hubble observations suggest complex atmospheric circulation patterns on Uranus during this period. The data that are most sensitive to the methane distribution indicate a downwelling in the polar regions and upwelling in other regions. 

    The team analyzed their results in several ways. The image columns show the change of Uranus for the four years that STIS observed Uranus across a 20-year period. Over that span of time, the researchers watched the seasons of Uranus as the south polar region (left) darkened going into winter shadow while the north polar region (right) brightened as it began to come into a more direct view as northern summer approaches.

    The top row, in visible light, shows how the color of Uranus appears to the human eye as seen through even an amateur telescope. 

    In the second row, the false-color image of the planet is assembled from visible and near-infrared light observations. The color and brightness correspond to the amounts of methane and aerosols. Both of these quantities could not be distinguished before Hubble’s STIS was first aimed at Uranus in 2002. Generally, green areas indicate less methane than blue areas, and red areas show no methane. The red areas are at the limb, where the stratosphere of Uranus is almost completely devoid of methane. 

    The two bottom rows show the latitude structure of aerosols and methane inferred from 1,000 different wavelengths (colors) from visible to near infrared. In the third row, bright areas indicate cloudier conditions, while the dark areas represent clearer conditions. In the fourth row, bright areas indicate depleted methane, while dark areas show the full amount of methane. 

    At middle and low latitudes, aerosols and methane depletion have their own latitudinal structure that mostly did not change much over the two decades of observation.  However, in the polar regions, aerosols and methane depletion behave very differently. 

    In the third row, the aerosols near the north pole display a dramatic increase, showing up as very dark during early northern spring, turning very bright in recent years. Aerosols also seem to disappear at the left limb as the solar radiation disappeared. This is evidence that solar radiation changes the aerosol haze in the atmosphere of Uranus. On the other hand, methane depletion seems to stay quite high in both polar regions throughout the observing period. 

    Astronomers will continue to observe Uranus as the planet approaches northern summer.

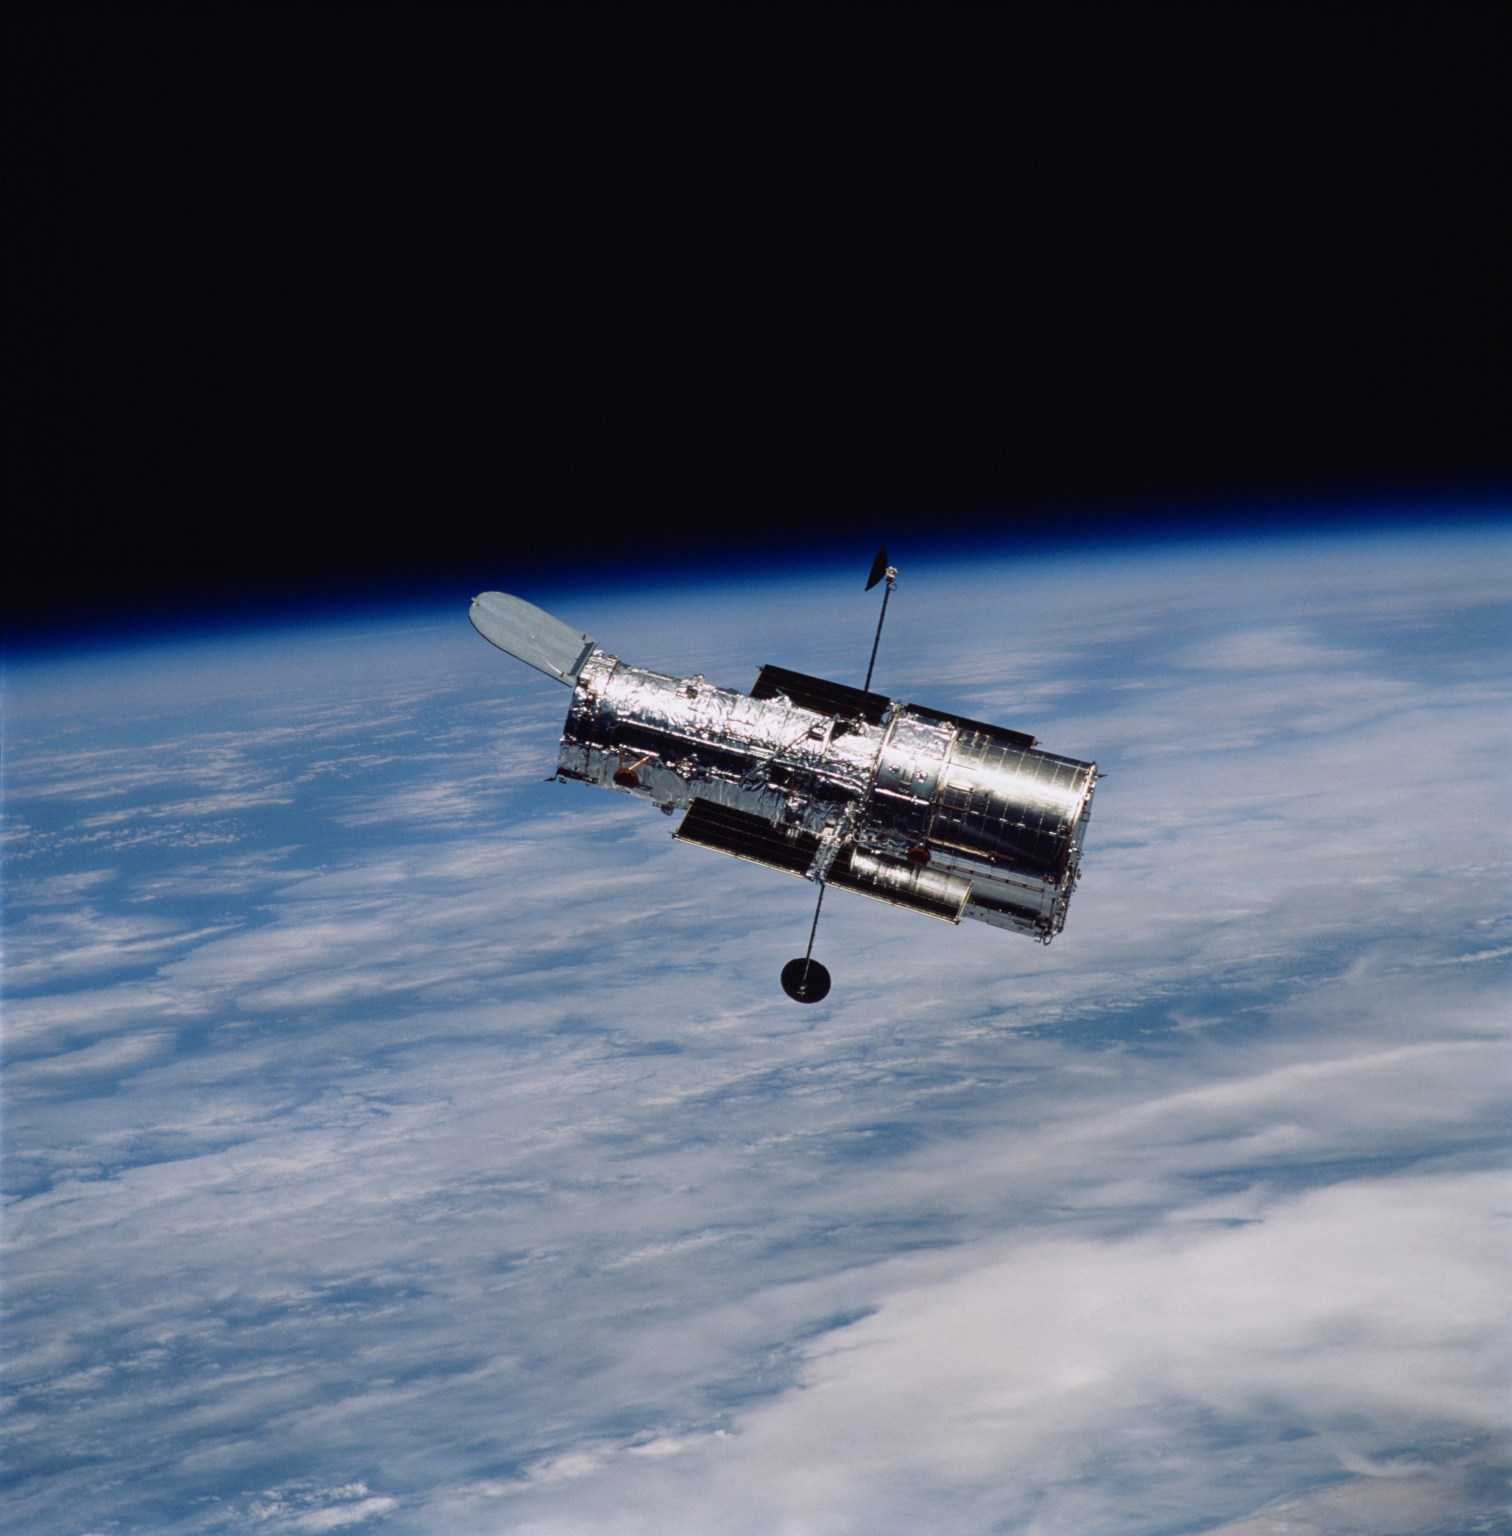
    The Hubble Space Telescope has been operating for over three decades and continues to make ground-breaking discoveries that shape our fundamental understanding of the universe. Hubble is a project of international cooperation between NASA and ESA (European Space Agency). NASA’s Goddard Space Flight Center in Greenbelt, Maryland, manages the telescope and mission operations. Lockheed Martin Space, based in Denver, also supports mission operations at Goddard. The Space Telescope Science Institute in Baltimore, which is operated by the Association of Universities for Research in Astronomy, conducts Hubble science operations for NASA.

    Share

    Details

    Last Updated
    Mar 31, 2025
    Editor
    Andrea Gianopoulos
    Contact
    Media

    Claire Andreoli
    NASA’s Goddard Space Flight Center
    Greenbelt, Maryland
    claire.andreoli@nasa.gov

    Ann Jenkins
    Space Telescope Science Institute, Baltimore, Maryland

    Ray Villard
    Space Telescope Science Institute, Baltimore, Maryland

    Powered by WPeMatico

    Get The Details…