NASA Awards Enable Research, Technology to Build Future Workforce

NASA Awards Enable Research, Technology to Build Future Workforce

3 Min Read

NASA Awards Enable Research, Technology to Build Future Workforce

An illustration of a suited Artemis astronaut looking out of a Moon lander hatch across the lunar surface, the Lunar Terrain Vehicle and other surface elements.

An illustration of a suited Artemis astronaut looking out of a Moon lander hatch across the lunar surface, a Lunar Terrain Vehicle and other surface elements.

Credits:
NASA

NASA has selected 12 U.S. institutions to receive $12 million to accelerate academic research and technology development in support of the agency’s priorities for exploring the Moon, Mars, and deep space.

Through NASA’s Minority University Research and Education Project (MUREP) Space Technology Artemis Research (M‑STAR) initiative, selected institutions will each receive up to $1 million to grow their scientific and engineering capabilities, enhance faculty and student engagement in aerospace research, and expand their ability to compete for future federal and commercial research awards.

“We are excited to launch this new cohort of M-STAR investigators,” said Alicia Baturoni Cortez, MUREP program manager in the agency’s Office of STEM Engagement. “NASA investments in our Nation’s research institutions create real opportunities for students and faculty to build skills, knowledge, and infrastructure, while helping NASA close technology gaps for long-duration operations on the Moon and eventually, Mars.”

As NASA enters a Golden Age of innovation and exploration, the M-STAR initiative supports the agency’s mission to develop innovative technologies that improve space transportation, human exploration, robotic discovery, and the growing space economy.

The awardees and their projects are as follows:

California State University, Sacramento
Adaptive Vision-Language-Action Models for Resilient Multi-Robot Collaboration in Unstructured Planetary Environments

University of Central Florida, Orlando
M-FAST: Multi-Fidelity Aerothermal Simulation & Testing for Artemis

University of Hawaii at Manoa
HI-STRIDE: Hawai’i Student Training in Radiation Instrumentation, Detection, and Exploration

University of Houston
RODEO: Rover-carried On-surface Deployables for Exploration Operations

University of Texas, San Antonio
Characterizing Physical and Mechanical Properties of Regolith at Cryogenic Conditions Using the Multi-Planetary Surface Simulator (MPS2)

Kean University, Union, New Jersey
Integrating Terrain Understanding of AI Models With Robust Control for Autonomous Path Planning

Virginia Commonwealth University, Richmond
BNNT-Reinforced Multifunctional Composites for Radiation-Tolerant, Hydrogen-Compatible Nuclear Thermal Propulsion (NTP) Secondary Hardware

Shaw University, Raleigh, North Carolina
Project ARES (Advanced Regenerative Environmental Systems): A Materials-by-Design Research and Workforce Development Platform for Environmental Control and Surface Infrastructure

Howard University, Washington
LumSHRS: Lunar monolithic Spatial Heterodyne Raman Spectrometer for Minirover In-Situ and Standoff Remote Sensing

Prairie View A&M University, Prairie View, Texas
Functionally Graded Interfaces for Directed-Energy-Deposition Repair of Copper-to-Superalloy Propulsion Hardware: An Integrated AI/ML Design-to-Validation Research Capability at Prairie View A&M University

University of New Mexico, Albuquerque
POWER-Artemis: Extreme-Environment Batteries and Fuel Cells for Sustained Moon and Mars Operations

Fayetteville State University, North Carolina
From Documents to Models: Method-Compliant Generative AI for Bootstrapping Model-Based Systems Engineering in NASA’s Artemis Enterprise (Doc2Model)

NASA’s Office of STEM Engagement fosters an ecosystem across education, industry, and government to cultivate a well‑prepared talent pool, while the agency’s Research and Technology Mission Directorate develops the transformative space technologies that enable future NASA missions and ensure U.S. leadership in aerospace. Together, they accelerate mission readiness by aligning cutting edge technological innovation with the workforce needed to carry it forward.

Powered by WPeMatico

Get The Details…
Sandra May

Rigorous Analysis Confirms NASA’s Artemis II Heat Shield Performance 

Rigorous Analysis Confirms NASA’s Artemis II Heat Shield Performance 

A post‑mission comparison of the Orion spacecraft heat shields from Artemis I (left) and Artemis II (right) are shown after removal from their crew modules. Both heat shields are seen rotated for inspection inside the Operations and Checkout Building at NASA’s Kennedy Space Center in Florida.
NASA

NASA’s Artemis II mission sent four astronauts around the Moon and brought them safely back to Earth, laying a foundation for crewed flights to the Moon’s surface.

Additional engineering data analysis of the Orion spacecraft’s heat shield confirmed initial data showing the heat shield performed as expected.  

In particular, NASA measured whether the thermal protection system effectively safeguarded the crew and Orion systems as the spacecraft reentered Earth’s atmosphere. This test flight was the first time astronauts flew aboard Orion. 

Orion reached a maximum velocity of 39 times the speed of sound and experienced external temperatures exceeding 4,000 degrees Fahrenheit at its peak, all while the four astronauts inside Orion stayed relatively cool with a cabin temperature in the mid-70 degree Fahrenheit range during their return to Earth from the Moon.  

After NASA’s thorough analysis of Artemis I heat shield findings, informed by extensive arc jet material testing at NASA’s Ames Research Center in California’s Silicon Valley, the agency modified Orion’s reentry trajectory for Artemis II by shortening the maximum downrange distance the spacecraft could fly between when it entered Earth’s atmosphere and splashed down in the Pacific Ocean. Analysis prior to the mission showed that limiting downrange distance would limit how long the spacecraft’s heat shield spent in the temperature range at which the Artemis I heat shield phenomenon occurred.  

Shortly after Artemis II splashdown on April 10, 2026, U.S. Navy divers captured underwater imagery of the Orion spacecraft’s heat shield.
US Navy

The spacecraft reentered with precision, entering within only 192 feet of its targeted entry interface, and successfully splashed down only 0.59 miles from the predicted landing site off the coast of San Diego. Initial inspections of the thermal protection system, including diver imagery of the spacecraft’s heat shield taken just after splashdown and further inspections on the recovery ship, found it performed as expected, with a significant reduction in the amount of cracks and char loss as compared to Artemis I.  

Upon the spacecraft’s return to NASA’s Kennedy Space Center in Florida after the Moon mission, thermal protection system experts began additional examination of the heat shield, made of 186 unique blocks of an ablative material called Avcoat. The heat shield was then transported to NASA’s Marshall Space Flight Center in Huntsville, Alabama, where work on sample extraction and internal x-ray scans began in August to provide further engineering insight into the system and behavior of the material.

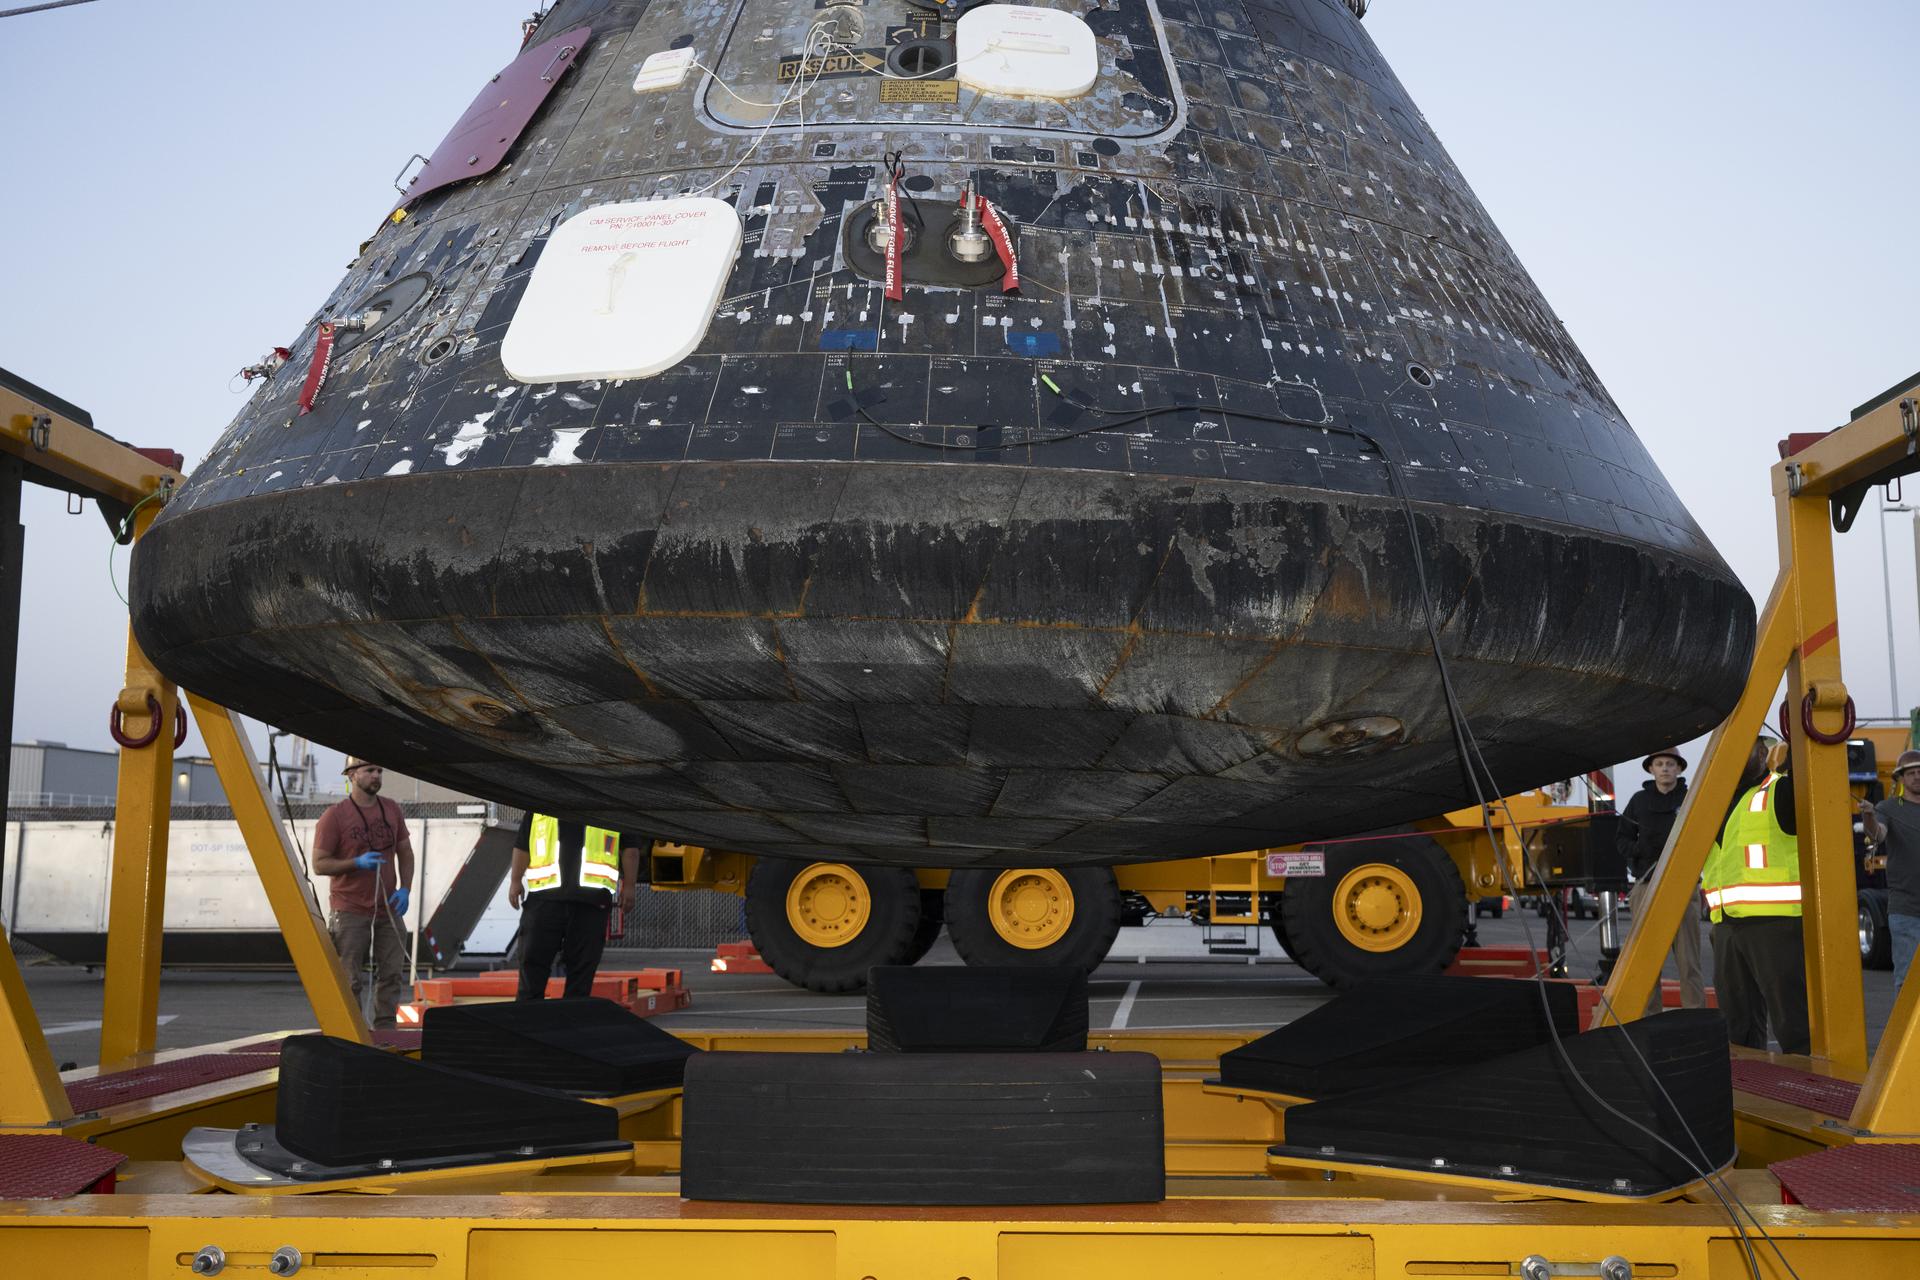
The Artemis II Orion crew module after being offloaded from the well deck of USS John P. Murtha at Naval Base San Diego and lifted from the Orion Recovery Cradle Assembly on April 18, 2026. The gray area, as seen on the edge where the spacecraft’s heat shield and the backshell meet, is from recovery operations.
NASA/Kevin Davis

A thorough post-flight assessment review found that Orion’s aerodynamic and aerothermal performance, including the heat shield and backshell thermal protection system, was in line with engineering predictions based on pre-flight analyses and ground testing. The shorter allowable down range during entry reduced the cracking and char loss experienced on the Artemis II heat shield relative to the Artemis I heat shield by a factor of ten, proving the effectiveness of the trajectory modification. Engineers found only nine spots of char loss of varying sizes on the Artemis II heat shield dish, compared to 103 during Artemis I. 

The analysis also showed that Orion’s robust heat shield design showed consistency from Artemis I to Artemis II, evident by the performance of system features such as the seams between the heat shield Avcoat blocks and the Avcoat surrounding the heat shield compression pad separation bolts. 

Post-flight inspection of Orion’s backshell, the protective cover on the sloped sides of the crew module made up of 1,300 ceramic tiles, showed expected performance across the crew module surface. Visual inspections indicated backshell features designed to seal and protect penetrations such as windows, vents, thrusters, and the side hatch also met expectations, with no signs of overheating observed. 

The team also performed post-flight laser scans of the heat shield surface and is comparing this data to pre-flight measurements to determine material recession, which will then be compared to analysis predictions. Engineers are continuing with heat shield sample extraction at NASA Marshall and subsequent material test and assessment and thermal analysis, to support long-term heat shield development, manufacturing efforts, and data capture. 

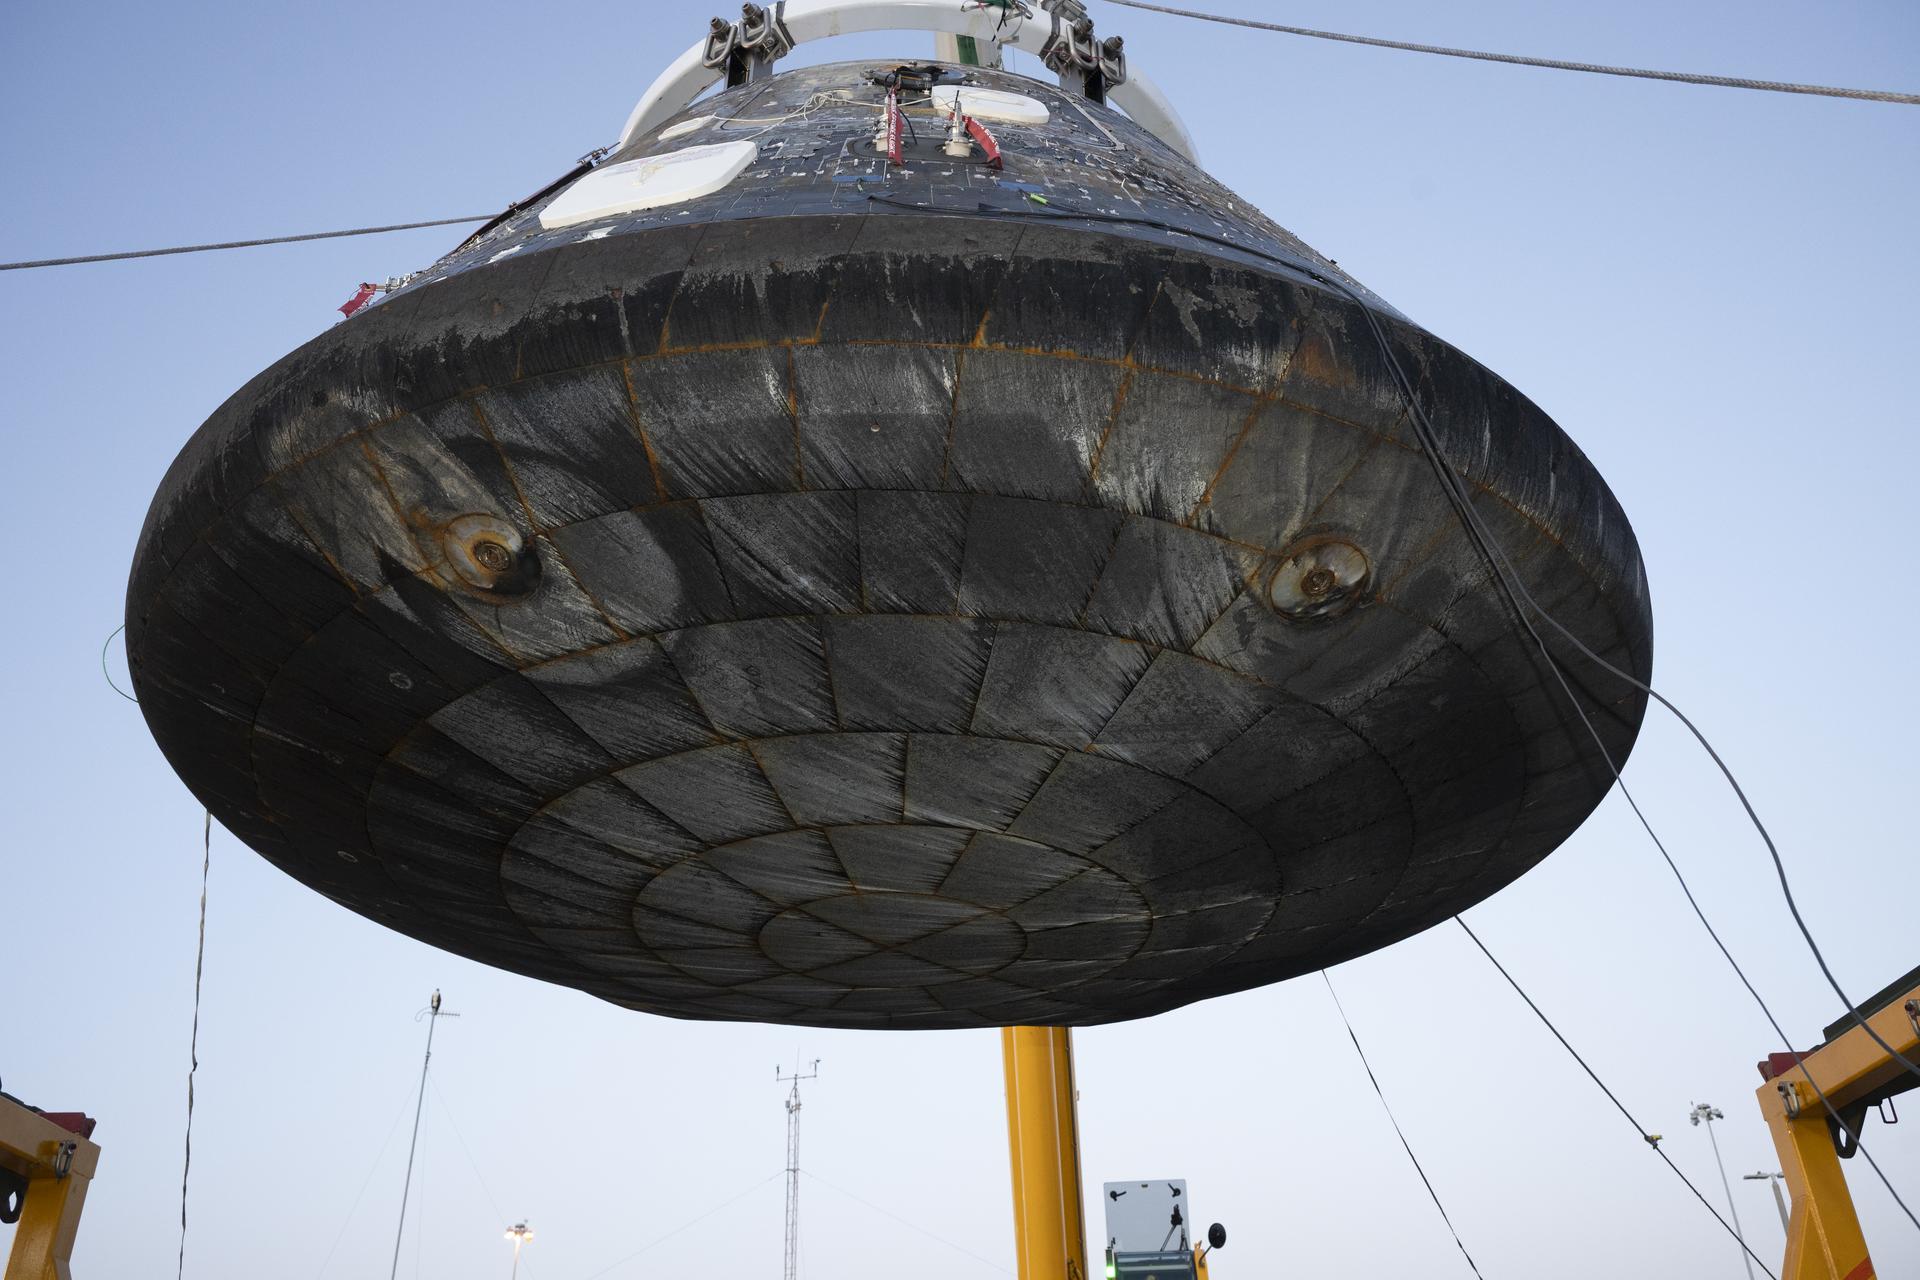
The Artemis II Orion crew module is lifted from its recovery fixture for inspection and engineering imagery after being offloaded from the USS John P. Murtha at Naval Base San Diego on April 18, 2026. The recessed areas, or smaller concentric circles, seen on the heat shield are associated with the separation bolts that connect the crew module with the service module. The larger circular patterns are formed due to compression pad material used within this location of the spacecraft, creating flow disturbances caused by extreme aerodynamic and thermal airflow during reentry. This causes increased heating locally and therefore Avcoat ablator thickness is increased in these areas by design.
NASA/Kevin Davis

Orion’s performance and the team’s analysis on Artemis II reflect system robustness, capability to support crew, and critical insights gathered that will enhance the Artemis III mission and beyond. Following the extensive Artemis I heat shield investigation, upgrades were made to the heat shield design for Artemis III to achieve uniformity and consistent permeability of the Avcoat blocks. Technicians attached the heat shield for the Artemis III Orion crew module at NASA Kennedy in early July, and the Orion crew and service modules were joined at the end of July. The spacecraft has since been successfully powered up for the first time, enabling engineers to check all connection lines between the two modules are working as planned.

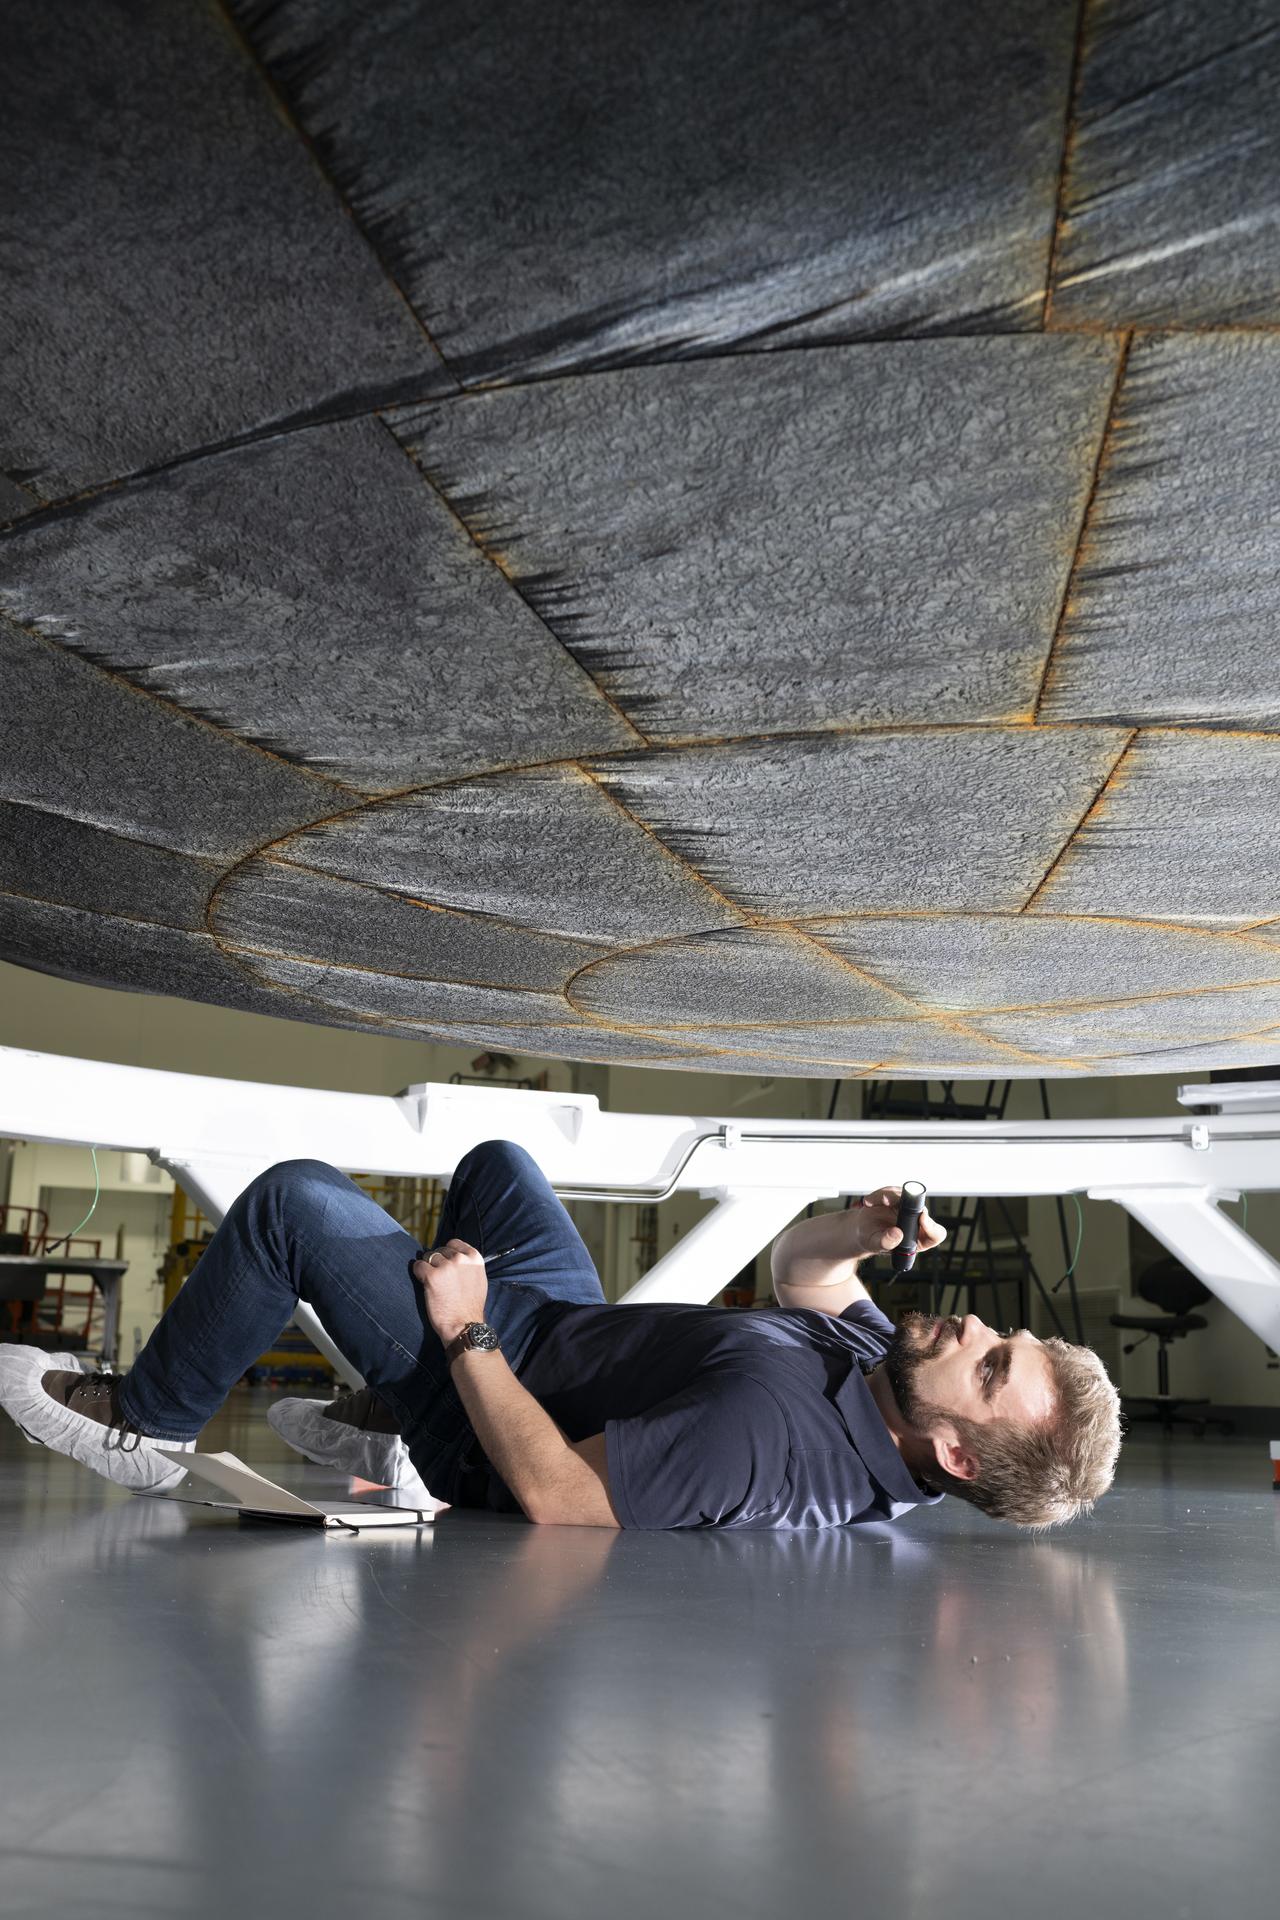
A person lies on the floor of a workshop, holding a flashlight to inspect the underside of a large, circular heat-shield-like structure suspended above them. The individual is positioned on their side beneath the hardware, with tools and equipment visible in the background.
An engineer from NASA’s Ames Research Center inspects the Artemis II Orion heat shield at NASA Kennedy’s Multi-Purpose Payload Facility on April 30, 2026, prior to its removal from the crew module. The orange tint seen between Avcoat tiles is an expected effect of the silicone used to fill the gaps between the blocks. The silicone gap filler contains iron oxide, which gives it a red appearance after enduring reentry. 
NASA/Kevin Davis

NASA continues to advance toward Artemis III as teams ready the Orion spacecraft for next year’s mission in low Earth orbit. NASA will launch the SLS (Space Launch System) rocket and Orion spacecraft with NASA astronauts Randy Bresnik, Frank Rubio, Andre Douglas, and ESA (European Space Agency) Luca Parmitano, to rendezvous with human lander test articles from Blue Origin and SpaceX to demonstrate critical systems and operations needed for future lunar landings, beginning with Artemis IV in 2028.

Powered by WPeMatico

Get The Details…
Elyna Niles-Carnes

Chandra Finds Possible Origin of ‘Treble Clef’ Waves

Chandra Finds Possible Origin of ‘Treble Clef’ Waves

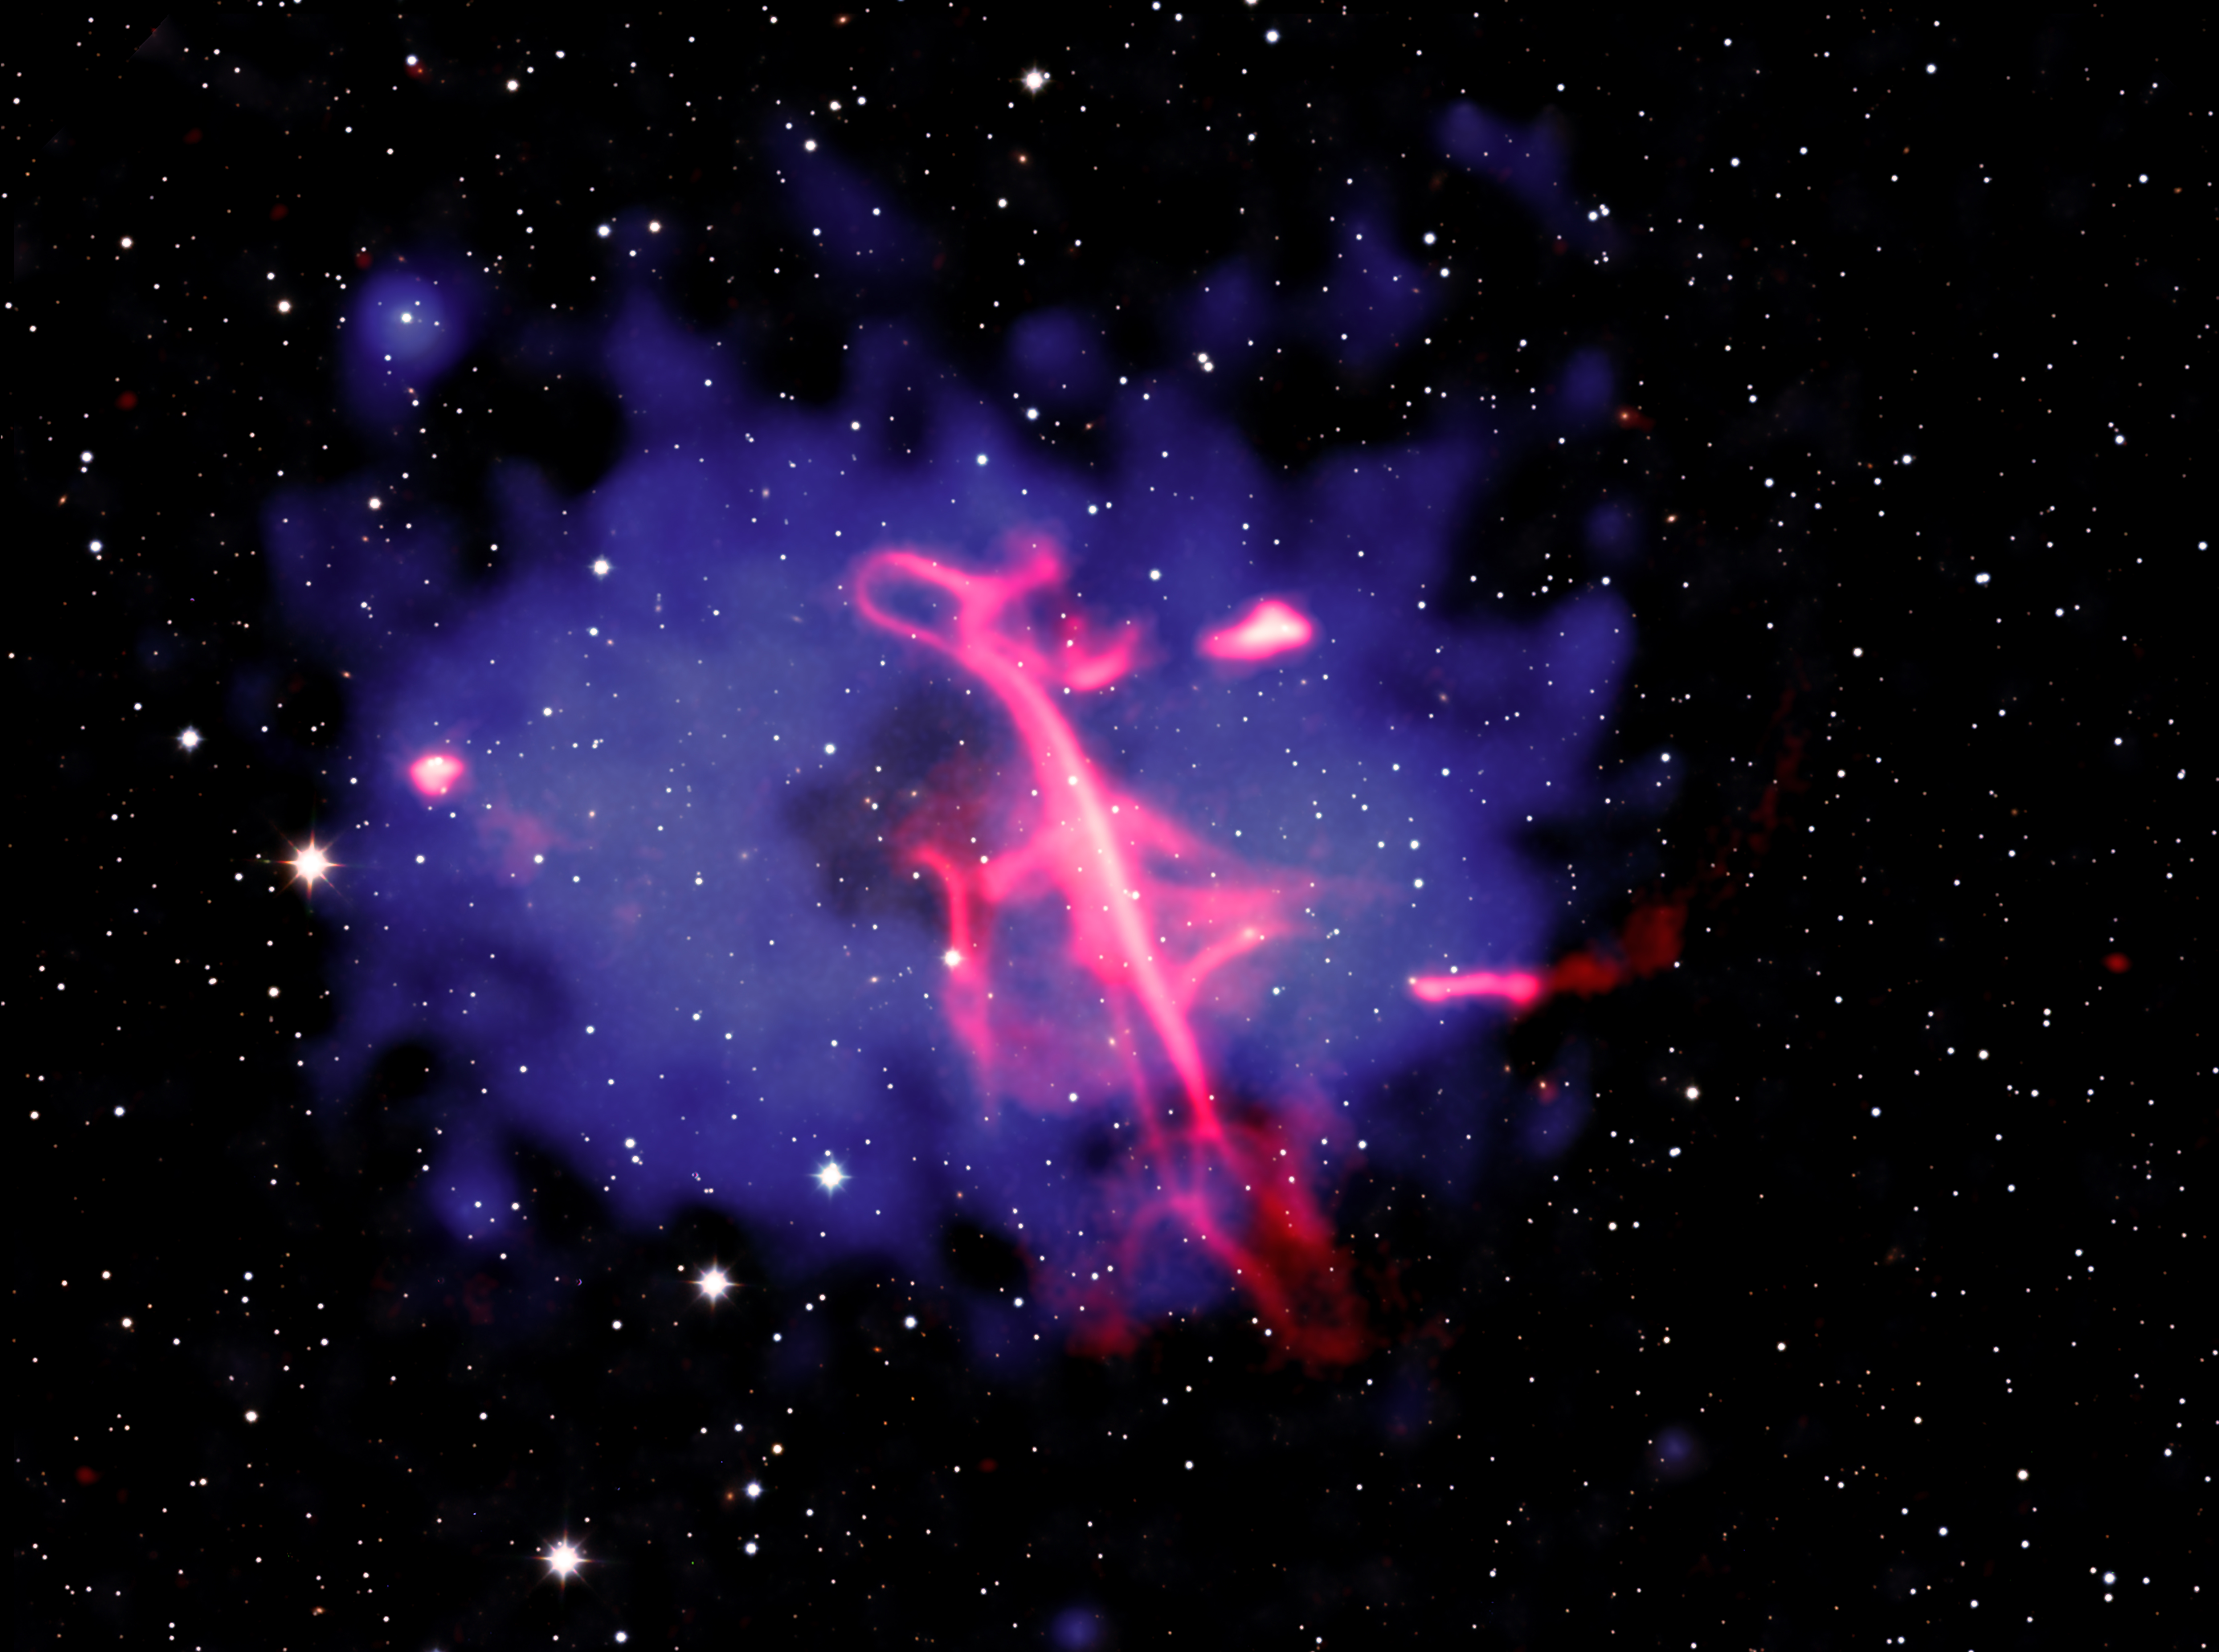
A composite image of a remarkable radio wave formation that strongly resembles a treble clef musical symbol, hovering in the midst of two colliding galaxy clusters. Here, galaxies in the galaxy clusters, plus foreground and background stars and galaxies, blanket the image with specks of light set against the blackness of space. At the center of the frame is a large, oval, blue-purple cloud with ragged edges. In the middle of the purple field, tilting slightly to our left, is what appears to be a giant treble clef, loosely drawn with a neon pink marker. Like the musical notation for which it's named, the formation has a strong vertical stroke with a continuous, fluid line swooping back and forth as it moves from top to bottom.
X-ray: NASA/CXC/INAF-IRA/A. Botteon et al.; Infrared: UKIDSS-GPS ; Radio: ASTRON/LOFAR; Image processing: NASA/CXC/SAO/N. Wolk

A formation of radio waves looks remarkably like a treble clef in this Oct. 14, 2026, image from NASA’s Chandra X-Ray Observatory. Researchers used Chandra to find that the Treble Clef is likely caused by an outburst from a supermassive black hole, followed by a collision of two galaxy clusters.

Read more about this discovery.

Image credit: X-ray: NASA/CXC/INAF-IRA/A. Botteon et al.; Infrared: UKIDSS-GPS ; Radio: ASTRON/LOFAR; Image processing: NASA/CXC/SAO/N. Wolk

Powered by WPeMatico

Get The Details…
HQ Web Team

APOD: 2026 October 15 – The Milky Way over Manhattan

APOD: 2026 October 15 – The Milky Way over Manhattan

APOD

Astronomy Picture of the Day

Discover the cosmos! Each day a different image or photograph of our fascinating universe is featured, along with a brief explanation written by a professional astronomer.

A black and white view of the Manhattan skyline merges into a night sky with stars and a visible, though faint, Milky Way. Please see explanation for more details.

The Milky Way over Manhattan

Explanation: The city lights outshine the stars in the City That Never Sleeps. Who would have thought that the Milky Way could be visible in this sky? This image was taken with a filter that blocks most visible light, capturing instead only light in the near-infrared region of the electromagnetic spectrum (with lower energy than visible light). The astrophotographer’s clever setup blocks most of the light pollution from the city: old incandescent light bulbs and some neon lights are still bright in the near-infrared, but fluorescent and LED light bulbs are not. Of course, stars are also bright in the near-infrared! This image is a reminder that we all live under the same sky, and astronomy allows all of us to learn more about humanity’s place in the Cosmos.

Tomorrow’s picture: Chasing the ISS

Date October 15, 2026
Credit & Copyright Jason Kurth, Ty Buckley
Authors & editors: Cecilia Chirenti, Robert Nemiroff, Jerry Bonnell, Keighley Rockcliffe
A service of: ASD at NASA / GSFC,
NASA Science Activation & Michigan Tech. U.

Powered by WPeMatico

Get The Details…

Fires Arrive in the Amazon Rainforest

Fires Arrive in the Amazon Rainforest

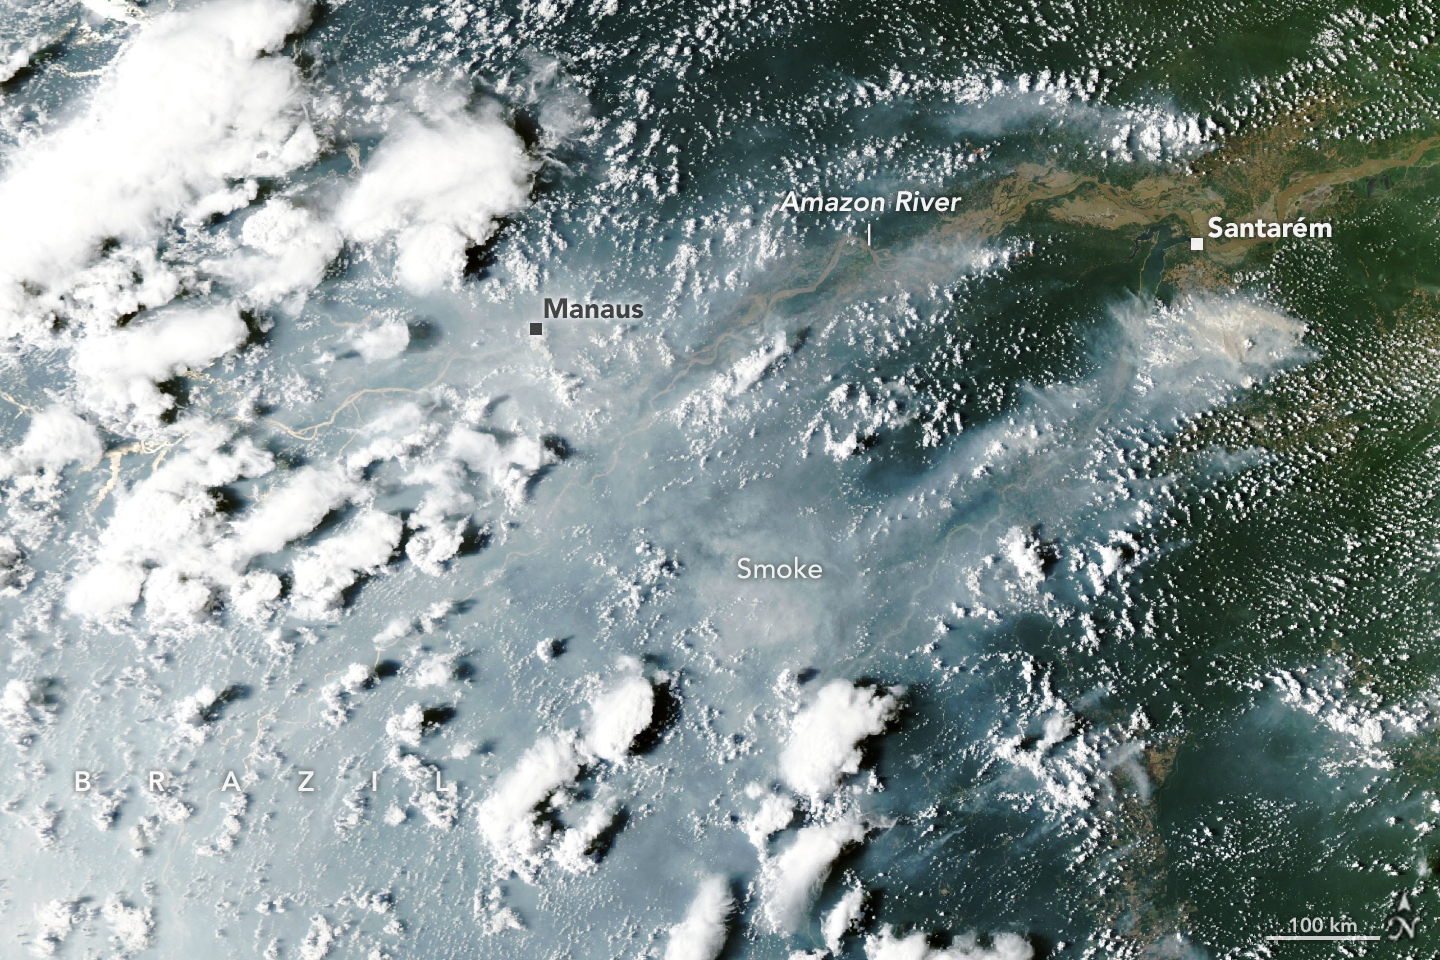
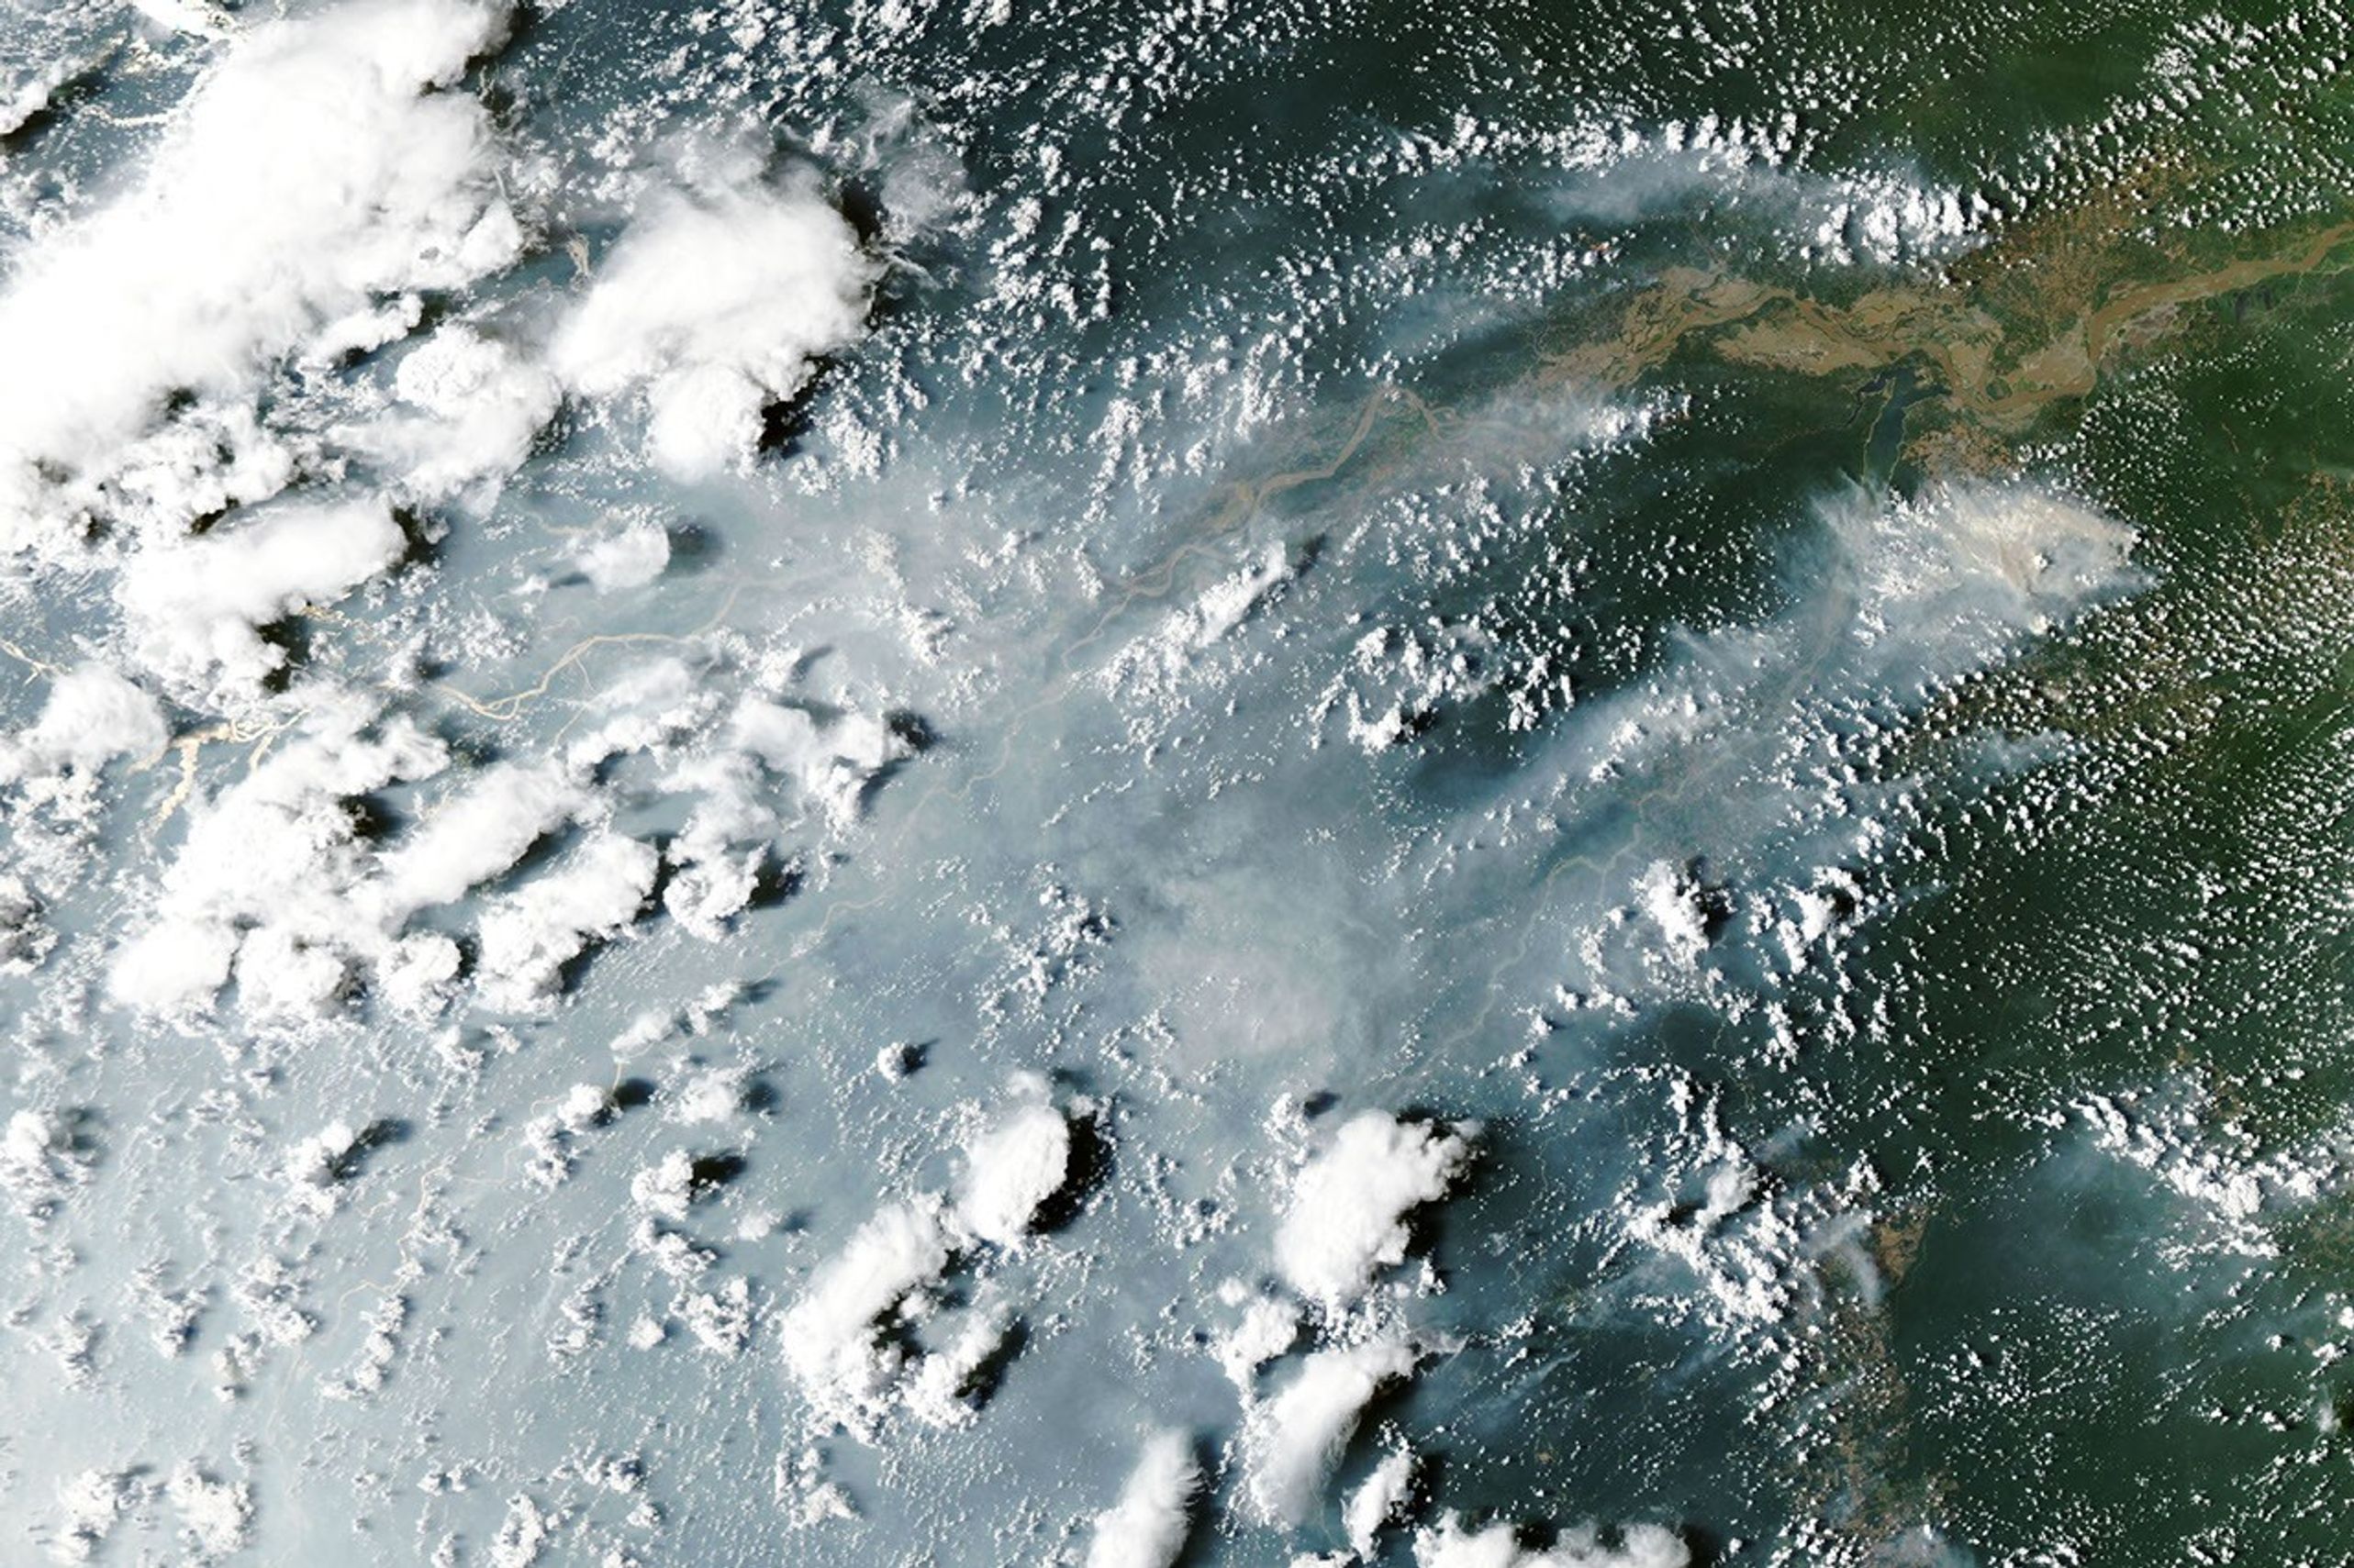
Thick gray smoke partially obscures the Amazon River and surrounding rainforest near the cities of Manaus and Santarém. Puffy white clouds rise above the smoke on the left side of the image.

Unlike a tornado or thunderstorm that can deliver destruction in minutes, El Niño exerts its influence over many months. This year, a drought accompanying El Niño has left the Amazon rainforest primed to burn, and scientists say the region has entered the early stages of what they think will be a long and severe fire season.

Starting in September 2026, satellites detected sharp increases in fire activity and smoke emissions in the central and eastern Amazon, visible in fire and emissions monitoring platforms including NASA’s Fire Information for Resource Management System (FIRMS), the Global Fire Emissions Database (GFED), and NASA Worldview. The region with elevated fire activity stretches from forests surrounding the commercial and transportation centers of Manaus and Santarém to the mouth of the Amazon River.

When the MODIS (Moderate Resolution Imaging Spectroradiometer) on NASA’s Aqua satellite captured this image of smoke streaming from fires on both sides of the Amazon River on October 12, 2026, heavy smoke socked in Manaus, the capital of the Brazilian state of Amazonas. That day, city officials reported extremely poor air quality, with fine particulate matter (PM2.5) values above 135 micrograms per cubic meter, the second-worst rating on a regional air quality index. The pall disrupted daily life in a city of more than 2 million people. Schools closed, and citywide events and children’s sports leagues were canceled as officials warned of hazardous air quality, according to news reports.

The burning around Santarém and Manaus is part of a “cascade” of fire in the tropics that accompanies the disrupted rainfall patterns of an El Niño, said Douglas Morton, an Earth system scientist based at NASA’s Goddard Space Flight Center. The pattern begins along the equator with drought and peat fires in Indonesia, followed by elevated fire activity in this part of the Amazon. Morton and colleagues from the University of California, Irvine; Vrije Universiteit Amsterdam; and the University of Maryland detailed the pattern in a 2017 study following the destructive fire season that accompanied the 2015–2016 El Niño. They also saw the pattern play out in 2023.

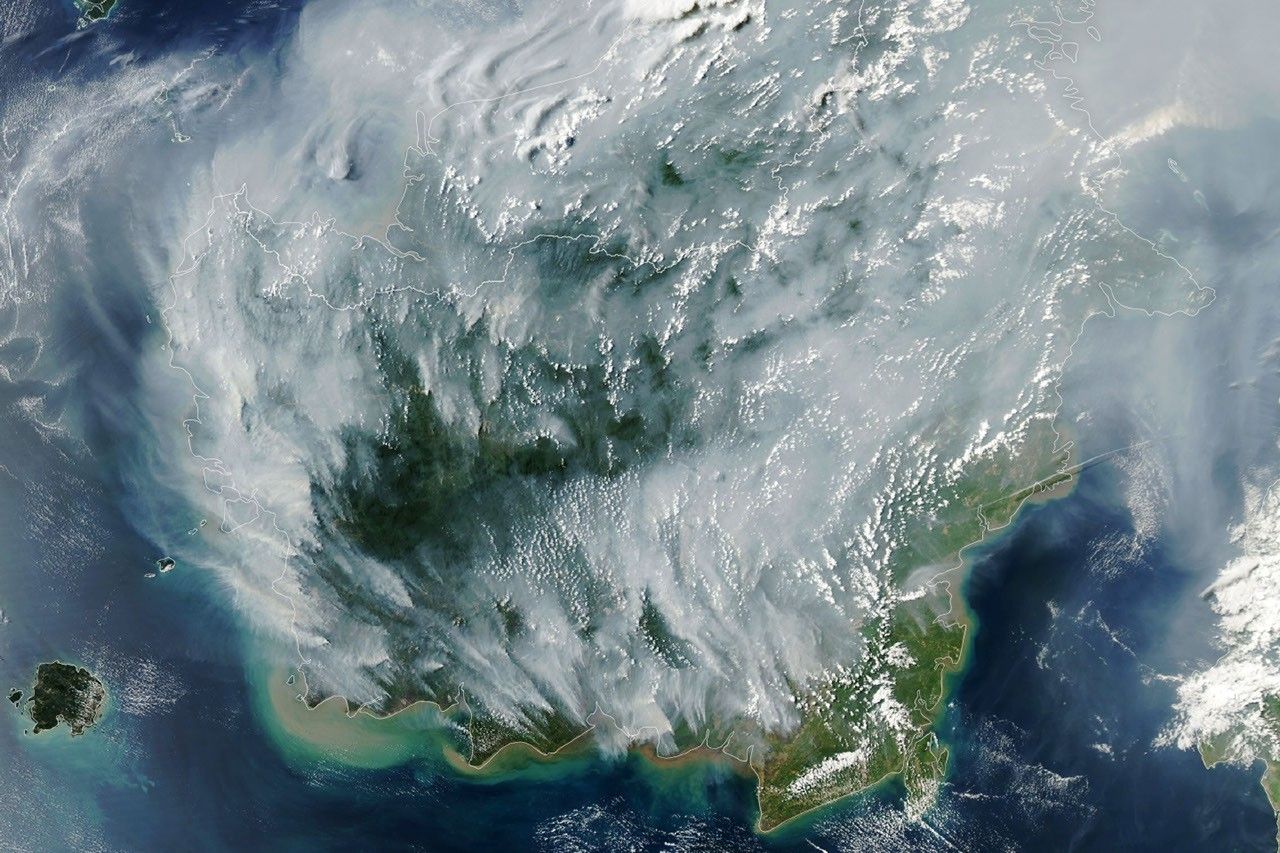
A swell of fire in the tropics riding the 2026 El Niño has followed the pattern. Drought, fire, and smoke have smothered parts of Indonesia since August, with hundreds of homes razed in October and thick smoke blanketing whole islands most days. “Now, in the Amazon, we’re seeing the second domino in the cascade fall,” Morton said, referring to the uptick in fires that has begun in Pará and Amazonas.

Morton and his colleagues expect the next wave of fire to hit farther north in November and December in the Brazilian states of Roraima, northern Pará, and Amapá, as well as parts of Venezuela, Guyana, and Suriname. Finally, around August and September 2027, he said, drought and fire risk will peak in the southern Amazon regions of Brazil and Paraguay.

“It’s so striking—and frustrating—that this is happening all over again,” said Morton, adding that many of the same forests that burned during the El Niño events in 2023 and 2015 are burning again. Forest fires in these rainforests are known to cause especially serious ecological damage because most species are not adapted to fire. It’s likely that some of the forest fires will burn even more intensely this time because the earlier fires partially charred trees, degrading the forest and making what remained more susceptible to burning, he added.

Morton expects the fires around Santarém and Manaus to continue burning until the rainy season arrives in December 2026 or January 2027. For the regions to the north and south, there is still time to prepare. “Given the intensity of this El Niño, this really is the year for people to avoid burning at all costs,” Morton said.

It’s so wet in the Brazilian Amazon that lightning ignites less than 1 percent of fires, so the vast majority of fires currently burning there were started by people, Morton said. But this year’s drought, worsened by El Niño, has been intense. Brazil’s National Institute of Meteorology reported that Manaus rainfall levels were 95 percent less than normal in August and 60 percent less than normal in September.

The large fires in this region began as management fires—clearing shrubs from pastures or crops from fields, for instance—but have escaped and are now burning freely through the parched understory of the rainforest, he added. Analysis of satellite observations indicates there are 50 to 70 uncontrolled fires burning in the Santarém region alone, said Shane Coffield, a University of Maryland assistant research scientist at NASA Goddard.

As part of a NASA Earth Action project, Coffield is mining fire observations from VIIRS (Visible Infrared Imaging Radiometer Suite) to identify fires that didn’t meet the threshold for inclusion in official data products distributed by FIRMS. He plans to share the locations of these “candidate fires” with scientists at MapBiomas, a multi-institutional network comprising universities, NGOs, and technology companies that maps fires and land-use change in the Amazon.

“For the area around Santarém, we’ve identified about 40 percent more fires than you’ll see in active fire counts from FIRMS,” said Coffield. Satellites often miss fires in circumstances like this due to dense smoke, clouds, and tree canopy cover, which can block the sensors from detecting the infrared signal of fires—especially lower-intensity fires spreading along the forest understory. “On some of the smokiest days, we have very few detections from MODIS and VIIRS, and we know that isn’t right.”

NASA Earth Observatory images by Lauren Dauphin, using MODIS data from NASA EOSDIS LANCE and GIBS/Worldview. Story by Adam Voiland.

References & Resources

You may also be interested in:

Stay up-to-date with the latest content from NASA as we explore the universe and discover more about our home planet.

Peatland Fires Darken Skies in Indonesia

6 min read

With Indonesia gripped by drought, fires are smoldering on the surface and underground.

Article

Fighting Fire With Fire

3 min read

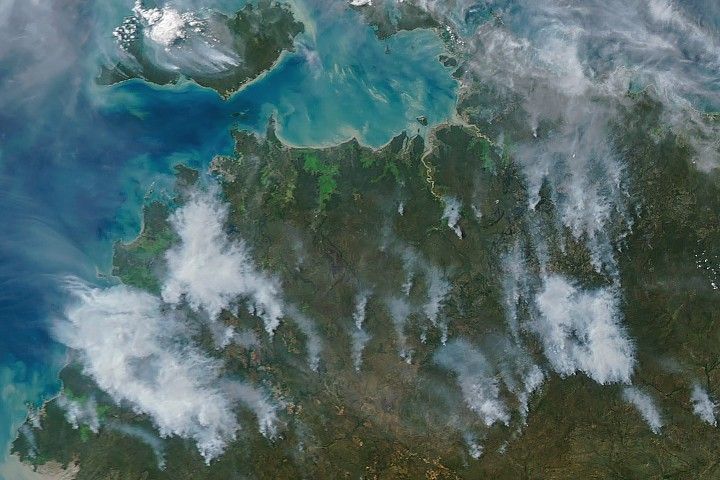
In fire-prone ecosystems in Australia’s Northern Territory, prescribed burns are lit to minimize the severity of fires later in the…

Article

Smoke Streams Across Eastern Washington

3 min read

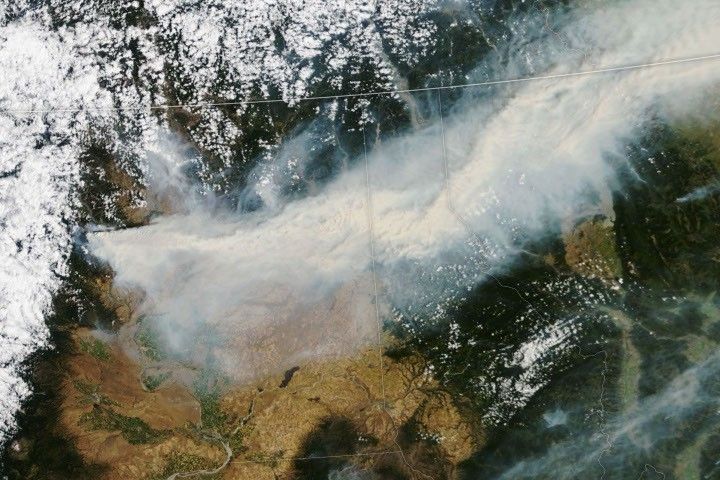
Wildland fires in early August 2026 pushed air quality to unhealthy levels, destroyed hundreds of structures, and triggered mandatory evacuations…

Article

Powered by WPeMatico

Get The Details…