Clouds Swimming over Lago Argentino

Clouds Swimming over Lago Argentino
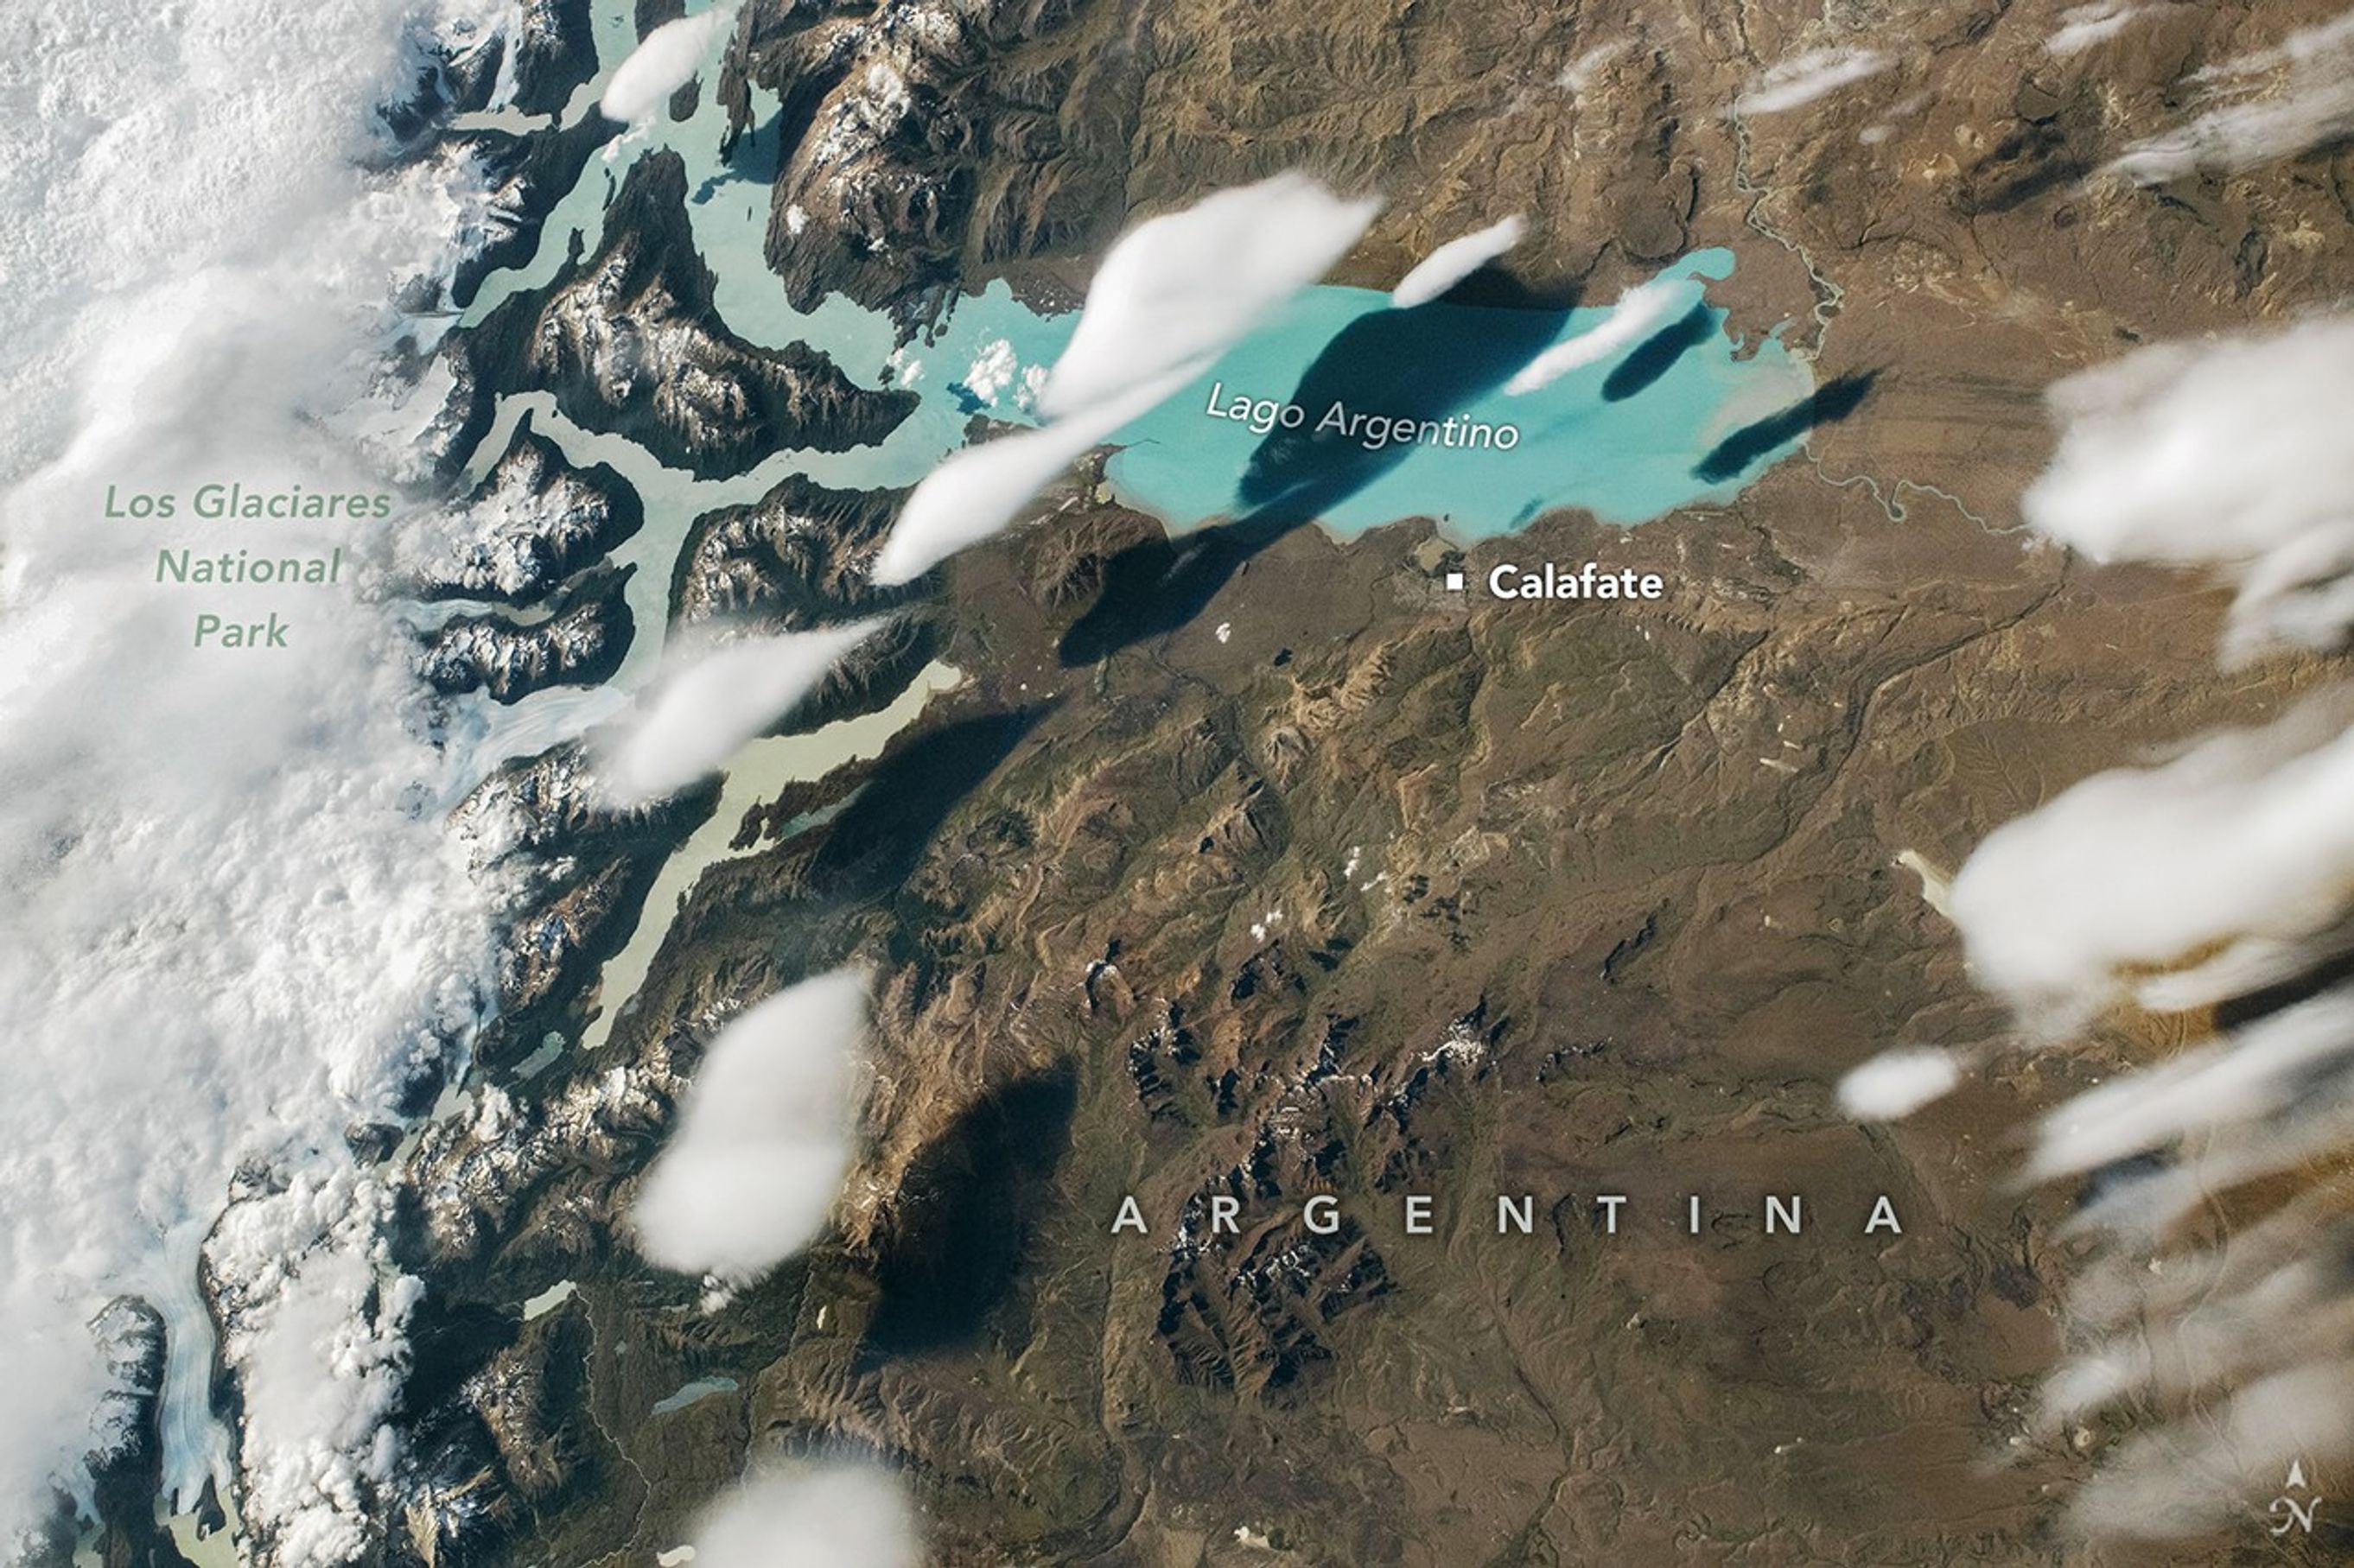
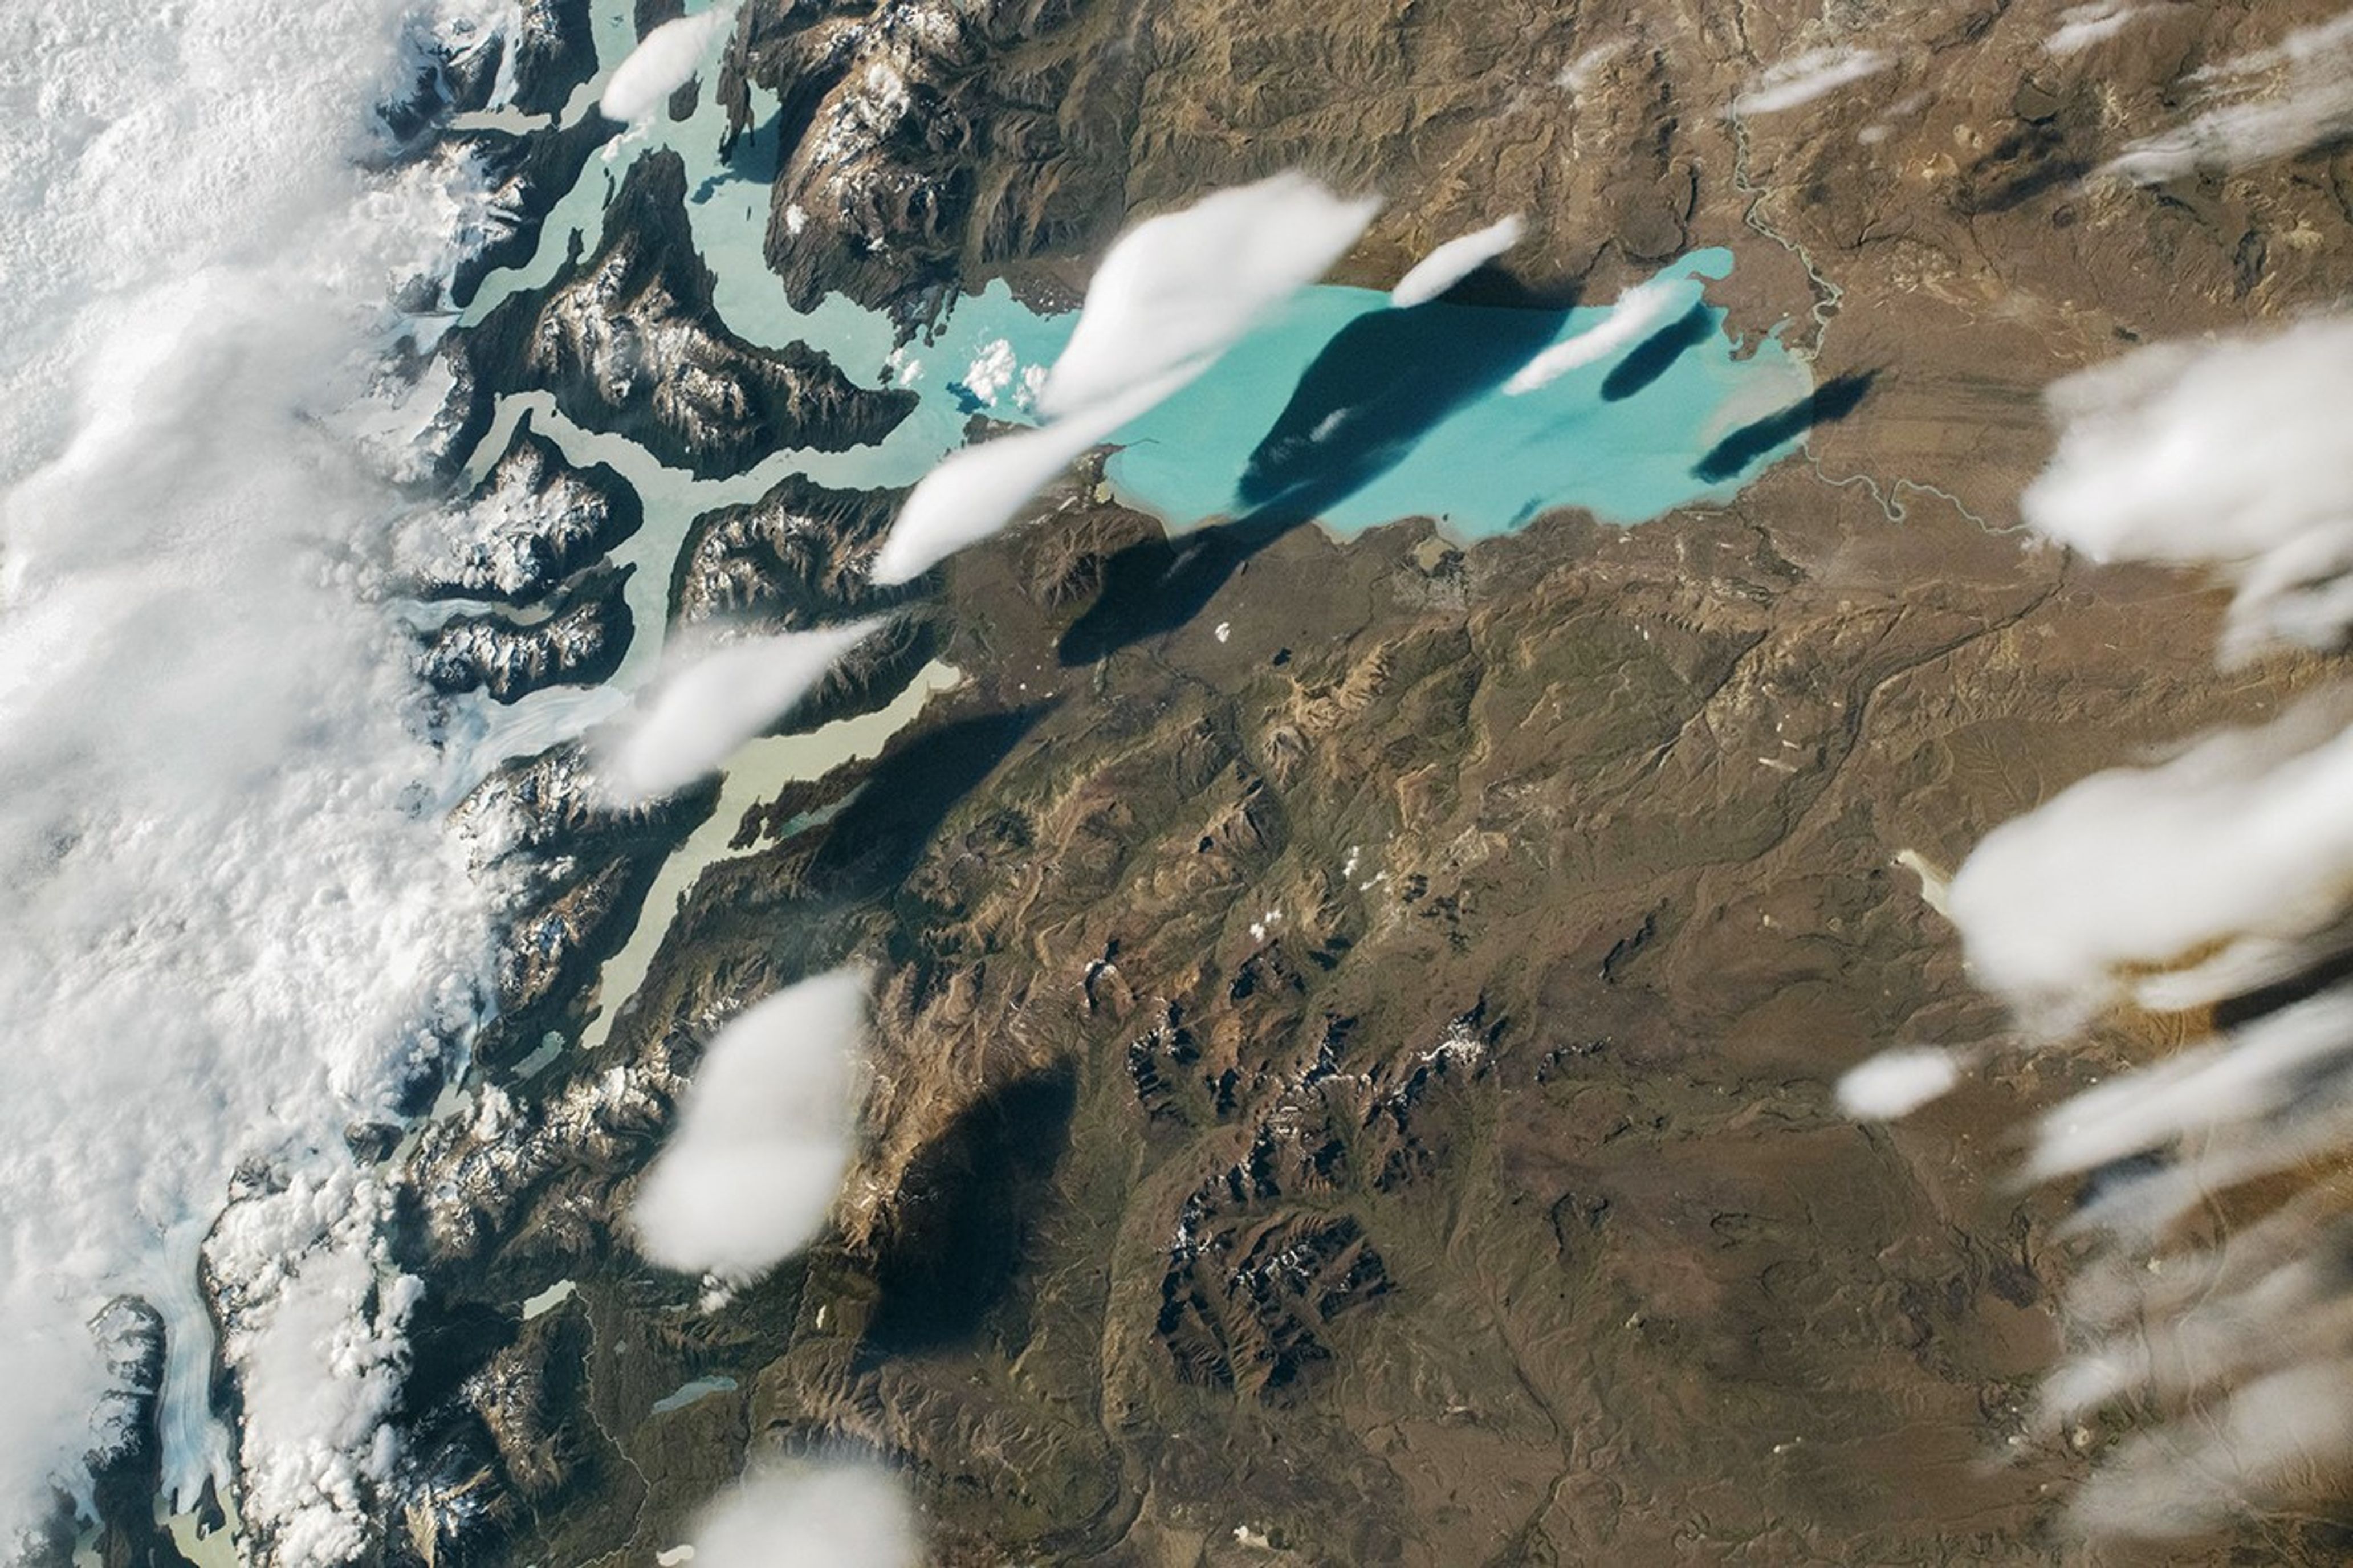
Several narrow, white clouds resembling fish are visible over the teal waters of Lago Argentino. The landscape surrounding the lake is brown and barren. The left side of the image includes a label for Los Glaciares National Park.
December 27, 2025

When an astronaut aboard the International Space Station snapped this photograph of Lago Argentino in Patagonia on December 27, 2025, a school of fish-shaped clouds lingered over the glacial lake’s teal waters. Determining the clouds’ type and origin from the photograph alone is challenging, but several NASA scientists and university researchers offered a theory after reviewing the image.

“The lens shape reminds me of lenticular clouds, which usually form near or over mountains,” said Maria Hakuba, a research scientist in the aerosols and clouds group at NASA’s Jet Propulsion Laboratory. “The edges of the cloud also look quite smooth rather than ‘fuzzy,’ which suggests they’re ice clouds that are relatively high up.”

Lenticular clouds form as a result of lee waves, which develop when prevailing winds are forced up and over a topographic barrier, often a mountain range, and when the overlying air is stable. Air expands and cools at the crest of the waves, causing vapor to condense and form cloud droplets. Conversely, air on the other side of the waves descends, warming the air and causing the cloud to evaporate. The result is a set of seemingly stationary clouds that hover in place downwind of mountains. Lenticular clouds are often eye-catching, sometimes described as having shapes like almonds, upside-down dinner plates, lentils, flying saucers, or stacks of pancakes.

Hazem Mahmoud, an atmospheric science lead at NASA’s Langley Research Center, agreed that the clouds were likely lenticular and offered additional insight. MODIS (Moderate Resolution Spectroradiometer) data suggest cloud-top altitudes near 9,200 meters (30,000 feet) and cloud-top temperatures around 220 Kelvin, along with relatively large particle sizes consistent with the presence of ice crystals, he said. “The high altitude and microphysical properties suggest Cirrocumulus lenticularis,” he said.  

Strong surface-level winds common in Patagonia likely swept across the glacial lakes of Los Glaciares National Park, forcing unusually moist air over the Andes, producing the lens-shaped clouds. Sublimation—the conversion of ice directly into water vapor—of glacial ice likely contributed to their formation by adding extra moisture into the air, he added.

Wind shear and turbulence may have caused the elongated, trailing appearance that made the clouds resemble a school of fish, Mahmoud explained. These forces stretched and organized the clouds horizontally above the lake, while shadows cast onto the landscape accentuated their forms. “Together these clouds tell a remarkable story of interaction between the lake’s moisture source, the Andes’ dynamic topography, and atmospheric circulation,” he said.

Santiago Gassó, an atmospheric scientist at NASA’s Goddard Space Flight Center, agreed they were likely lenticular clouds, citing the environmental context and Patagonia’s reputation as a hotspot for lenticular cloud formation.

“Very often the clouds here are stationary and trapped by lee waves on the downwind side of the mountains,” Gassó said. “They often don’t precipitate because most of the moisture gets left on the west side of the mountain.” The stereotypical image of lenticular clouds is that they sit stationary at the top of mountains, but in reality, they tend to drift away “depending on the turbulence and flow,” he added.       

All three scientists agreed that without analyzing more data, it’s hard to say definitively whether the cloud is lenticular or a type of cumulus. The challenge with a single astronaut photograph or satellite image is that we largely see the cloud-top properties, Mahmoud said. “If we also had lidar or cloud radar data, we could measure the vertical structure and thickness and more confidently differentiate a thin lenticular layer from a deep cumulonimbus column,” he said.  

Whether cumulus or lenticular, it’s a coincidence that “fish” is the name atmospheric scientists sometimes use to describe formations of a type of shallow convective cloud found over the ocean. It was one of the patterns, along with “sugar,” “gravel,” and “flowers,” identified by a team of researchers who analyzed decades of MODIS cloud observations.

Readers with a penchant for cloud classification can participate in GLOBE Clouds, a GLOBE citizen science project that makes it possible for students and members of the public to contribute to NASA research projects. As part of the project, participants have the opportunity to use Clouds Wizard, a feature that guides users through cloud identification with a series of interactive questions, animations, and photos.

Astronaut photograph ISS074-E-8940 was acquired on December 27, 2025, with a Nikon Z9 digital camera using a focal length of 116 millimeters. It is provided by the ISS Crew Earth Observations Facility and the Earth Science and Remote Sensing Unit at NASA Johnson Space Center. The image was taken by a member of the Expedition 74 crew. The image has been cropped and enhanced to improve contrast, and lens artifacts have been removed. The International Space Station Program supports the laboratory as part of the ISS National Lab to help astronauts take pictures of Earth that will be of the greatest value to scientists and the public, and to make those images freely available on the Internet. Additional images taken by astronauts and cosmonauts can be viewed at the NASA/JSC Gateway to Astronaut Photography of Earth. Story by Adam Voiland.

References & Resources

You may also be interested in:

Stay up-to-date with the latest content from NASA as we explore the universe and discover more about our home planet.
The Galaxy Next Door

3 min read

The Large Magellanic Cloud—one of our closest neighboring galaxies—is a hotbed of star formation that is visible to both astronauts…

Article

Kamchatka Peaks Pierce the Clouds

3 min read

The peninsula in eastern Siberia features rugged terrain with towering, snow-covered peaks and cloud-filled valleys stretching between the Pacific Ocean…
Article

Nighttime Over the Eastern Pacific

2 min read

A long-exposure photo taken from low Earth orbit captured the brilliant illumination coming from airglow, lightning, and stars.

Article

Powered by WPeMatico

Get The Details…

Coverage, Briefing Set for NASA’s Artemis II Moon Rocket Roll to Pad

Coverage, Briefing Set for NASA’s Artemis II Moon Rocket Roll to Pad

Photo of NASA's SLS (Space Launch System) rocket inside the Vehicle Assembly Building at Kennedy Space Center.
NASA’s SLS (Space Launch System) rocket is seen inside High Bay 3 of the Vehicle Assembly Building as teams await the arrival of Artemis II crewmembers to board their Orion spacecraft on top of the rocket as part of the Artemis II countdown demonstration test, Saturday, Dec. 20, 2025, at NASA’s Kennedy Space Center in Florida.
Credit: NASA/Joel Kowsky

NASA’s integrated SLS (Space Launch System) rocket and Orion spacecraft for the Artemis II mission is inching closer to launch – literally.

The agency is targeting no earlier than 7 a.m. EST, Saturday, Jan. 17, to begin the multi-hour trek from the Vehicle Assembly Building to Launch Pad 39B at NASA’s Kennedy Space Center in Florida.

A pre rollout mission news conference, live feed of rollout, and a media gaggle will stream on NASA’s YouTube channel. Individual streams for each of these events will be available from that page. Learn how to stream NASA content through a variety of online platforms, including social media.

The time of rollout is subject to change if additional time is needed for technical preparations or weather.

All times are Eastern. Events are as follows:

Friday, Jan. 16:

12 p.m.: Artemis II Rollout, Mission Overview News Conference

  • John Honeycutt, Artemis II mission management team chair
  • Charlie Blackwell-Thompson, Artemis launch director, Exploration Ground Systems
  • Jeff Radigan, Artemis II lead flight director, Flight Operations Directorate
  • Lili Villarreal, landing and recovery director, Exploration Ground Systems
  • Jacob Bleacher, chief exploration scientist, Exploration Systems Development Mission Directorate

Saturday, Jan. 17:

7 a.m.: Rollout, Artemis II Live Views from Kennedy Space Center feed begins

9 a.m.: Artemis II Crew Rollout Media Event

  • NASA Administrator Jared Isaacman and the Artemis II crew, including NASA astronauts Reid Wiseman, Victor Glover, and Christina Koch, and CSA (Canadian Space Agency) astronaut Jeremy Hansen, will answer questions about their preparations and the mission for media in-person at the countdown clock.

NASA’s crawler-transporter 2 will carry the 11-million-pound stack at about one mile per hour along the four-mile route from the Vehicle Assembly Building to Launch Pad 39B, on a journey that will take up to 12 hours.

To participate in the news conference by telephone, media must RSVP no later than two hours before the start to: ksc-newsroom@mail.nasa.gov. 

These events will be open in-person only to media previously credentialed for launch. The deadline has passed for in-person accreditation for Artemis II events at Kennedy.

Rollout to the pad marks another milestone leading up to the Artemis II mission. In the coming weeks, NASA will complete final preparations of the rocket and, if needed, rollback SLS and Orion to the Vehicle Assembly Building for additional work. While the Artemis II launch window opens as early as Friday, Feb. 6, the mission management team will assess flight readiness after the wet dress rehearsal across the spacecraft, launch infrastructure, and the crew and operations teams before selecting a launch date.

Follow NASA’s Artemis blog for mission updates.

Through Artemis, NASA will send astronauts to explore the Moon for scientific discovery, economic benefits, and to build the foundation for the first crewed missions to Mars.

Learn more about Artemis at:

https://www.nasa.gov/artemis

-end-

Rachel Kraft / Lauren Low
Headquarters, Washington
202-358-1600
rachel.h.kraft@nasa.gov / lauren.e.low@nasa.gov

Tiffany Fairley
Kennedy Space Center, Fla.
321-867-2468
tiffany.l.fairley@nasa.gov

Share

Details

Last Updated

Jan 14, 2026

Editor
Jennifer M. Dooren

Powered by WPeMatico

Get The Details…
Jennifer M. Dooren

New York–Newark–Jersey City Metropolitan Area

New York–Newark–Jersey City Metropolitan Area

The New York–Newark–Jersey City Metropolitan Area at night. City lights illuminate most of the image.
NASA

The New York–Newark–Jersey City Metropolitan Statistical Area, which spans 23 counties across New York, New Jersey, and Connecticut and has a population of about 19.9 million, is pictured at approximately 3:29 a.m. local time Dec. 20, 2025, from the International Space Station as it orbited 262 miles above the Atlantic coast.

Crew members aboard the orbital lab have produced hundreds of thousands of images of the land, oceans, and atmosphere of Earth, and even of the Moon through Crew Earth Observations. Their photographs of Earth record how the planet changes over time due to human activity and natural events. This allows scientists to monitor disasters and direct response on the ground and study a number of phenomena, from the movement of glaciers to urban wildlife.

Image credit: NASA

Powered by WPeMatico

Get The Details…
Monika Luabeya

La NASA publica datos de la temperatura global

La NASA publica datos de la temperatura global

Credit: NASA

Read this press release in English here.

La temperatura global de la superficie terrestre en 2025 fue un poco más cálida que en 2023 pero, dentro de los márgenes de error, ambos años está prácticamente empatados, según un análisis realizado por científicos de la NASA. Desde que comenzaron los registros en 1880, 2024 sigue siendo el año más caluroso.

Las temperaturas globales en 2025 fueron más frías que en 2024, con temperaturas promedio de 1,19° Celsius (2,14° Fahrenheit) por encima del promedio para el período de 1951 a 1980.

El análisis del Instituto Goddard de Estudios Espaciales de la NASA incluye datos de la temperatura del aire obtenidos por más de 25.000 estaciones meteorológicas en todo el mundo, así como por instrumentos a bordo de barcos y boyas que miden la temperatura de la superficie del mar, y estaciones de investigación en la Antártida. Los datos son analizados utilizando métodos que toman en cuenta la distribución cambiante de las estaciones de medición de temperatura y los efectos del calentamiento urbano que podrían sesgar los cálculos.

Además, análisis independientes realizados por la Administración Nacional Oceánica y Atmosférica (NOAA, por sus siglas en inglés), la plataforma Berkeley Earth, el Centro Hadley (que forma parte del servicio meteorológico nacional del Reino Unido) y los Servicios Climáticos Copernicus de Europa han concluido que la temperatura global de la superficie para 2025 ha sido la tercera más calurosa que se haya registrado. Estos científicos utilizan gran parte de los mismos datos de temperatura en sus análisis, pero emplean diferentes metodologías y modelos; todos ellos muestran la misma tendencia al calentamiento continuo.

El conjunto completo de datos de la NASA sobre las temperaturas de la superficie global, así como los detalles de cómo los científicos de la NASA llevaron a cabo el análisis, están disponibles públicamente en línea (en inglés).

Para obtener más información sobre los programas de ciencias de la Tierra de la NASA, visita el sitio web:

https://ciencia.nasa.gov/tierra

-fin-

Liz Vlock / María José Viñas
Sede central, Washington
202-358-1600
elizabeth.a.vlock@nasa.gov / maria-jose.vinasgarcia@nasa.gov

Peter Jacobs
Centro de Vuelo Espacial Goddard, Greenbelt, MD
301-286-0535
peter.jacobs@nasa.gov

Share

Details

Last Updated

Jan 14, 2026

Editor
Jessica Taveau

Powered by WPeMatico

Get The Details…
Jessica Taveau

NASA Releases Global Temperature Data

NASA Releases Global Temperature Data

Credit: NASA

Lee este comunicado de prensa en español aquí.

Earth’s global surface temperature in 2025 was slightly warmer than 2023 – but within the margin of error the two years are effectively tied according to an analysis by NASA scientists. Since record-keeping began in 1880, the hottest year on record remains 2024. 

Global temperatures in 2025 were cooler than 2024, with average temperatures of 2.14 degrees Fahrenheit (1.19 degrees Celsius) above the 1951 to 1980 average.

The analysis from NASA’s Goddard Institute for Space Studies includes air temperature data acquired by more than 25,000 meteorological stations around the world, from ship- and buoy-based instruments measuring sea surface temperature, and Antarctic research stations. The data are analyzed using methods that account for the changing distribution of temperature stations and for urban heating effects that could skew the calculations.

Additionally, independent analyses by the National Oceanic and Atmospheric Administration, Berkeley Earth, the Hadley Centre (part of the United Kingdom’s weather forecasting Met Office), and Copernicus Climate Services in Europe have concluded the global surface temperature for 2025 was the third warmest on record. These scientists use much of the same temperature data in their analyses but employ different methodologies and models, which exhibit the same ongoing warming trend.

NASA’s full dataset of global surface temperatures, as well as details of how agency scientists conducted the analysis are available online.

For more information about NASA’s Earth science programs, visit:

https://science.nasa.gov/earth

-end-

Liz Vlock
Headquarters, Washington
202-358-1600
elizabeth.a.vlock@nasa.gov

Peter Jacobs
Goddard Space Flight Center, Greenbelt, Md.
301-286-3308
peter.jacobs@nasa.gov

Powered by WPeMatico

Get The Details…
Jessica Taveau