Summer Heat Hits Southeastern Australia

Summer Heat Hits Southeastern Australia

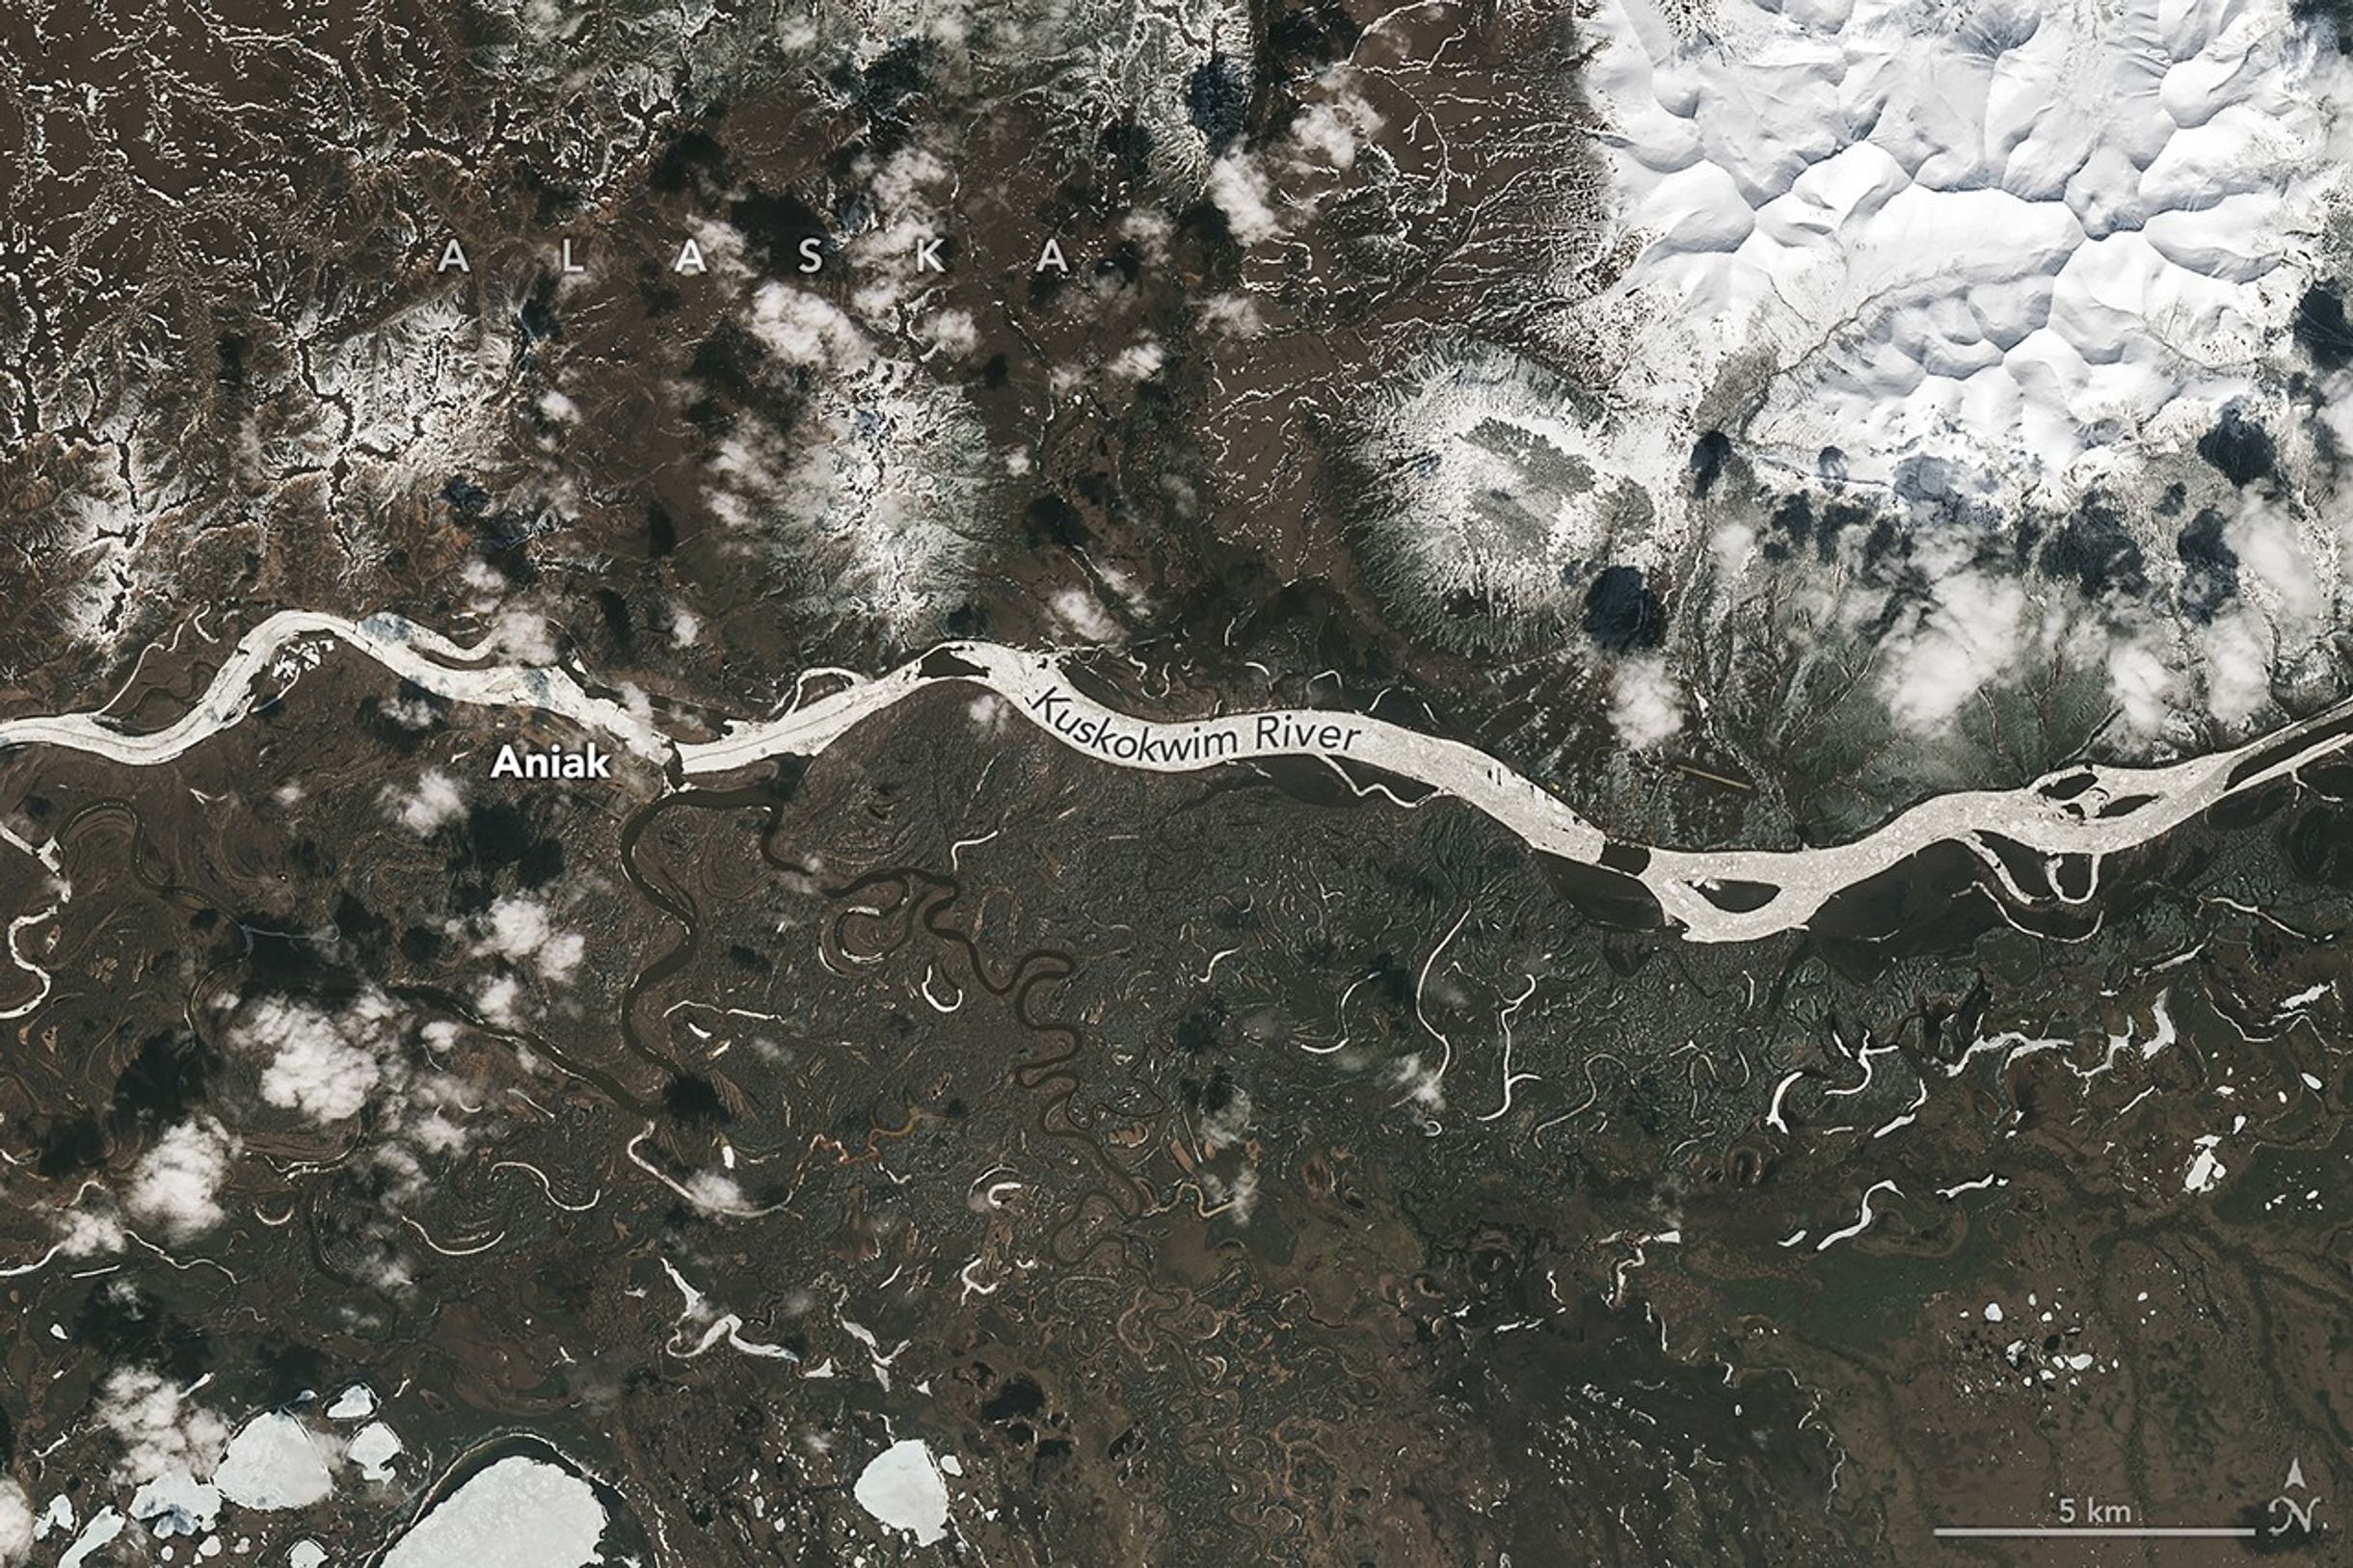
A map of Australia depicts near-surface air temperatures, where most of the country is warm, shown as orange to red. Extreme heat is concentrated over the southeast, and a small cooler blue area appears in Western Australia.
January 29, 2026

While a part of the United States braved extreme winter cold, January 2026 brought sweltering summer conditions to many parts of Australia.

Australia’s area-averaged mean temperature was 1.90 degrees Celsius (3.42 degrees Fahrenheit) above the 1961–1990 average, making it the fourth-warmest January since the start of observations in 1910, according to the Bureau of Meteorology (BoM). Contributing to this was a late-month heatwave in the country’s southeast that was especially intense between January 26 and January 30. During that period, numerous weather stations in South Australia, New South Wales, and Victoria recorded record-high daily temperatures.

The heatwave’s intensity and extent are evident in this map, which shows air temperatures at 03:00 Universal Time (2 p.m. local time in Victoria) on January 29, modeled at 2 meters (6.5 feet) above the ground. It was produced with a version of the GEOS (Goddard Earth Observing System) model, which integrates meteorological observations with mathematical equations that represent physical processes in the atmosphere. The darkest reds are where the model indicates temperatures reaching or exceeding 45°C (113°F).                                                                                                                                                                

According to BoM, the hottest temperatures of January 2026 were measured in two places in South Australia: in the town of Andamooka on the 29th and at the Port Augusta airport on the 30th, where temperatures reached 50.0°C (122.0°F). In both New South Wales and Victoria, the month’s hottest day was on the 27th, when temperatures reached 49.7°C (121.5°F) at a station in Pooncarie and 48.9°C (120.0°F) at stations in Walpeup and Hopetoun.

The heatwave brought significant human and public-health effects, including the increased risk of heat-related illness. Organizers of the Australian Open tennis tournament in Melbourne, Victoria, suspended play on some courts and closed roofs to provide shade as part of an “extreme heat policy” to protect players and spectators, according to news reports.

The recent warmth followed another bout of heat earlier in the month that, combined with strong winds and dry conditions, created dangerous fire conditions. Numerous bushfires were burning across Victoria on January 9 as officials urged people to evacuate. By mid-month, news reports indicated that the fires had destroyed hundreds of structures and killed tens of thousands of livestock.

NASA Earth Observatory image by Lauren Dauphin, using GEOS data from the Global Modeling and Assimilation Office at NASA GSFC. Story by Kathryn Hansen.

References & Resources

You may also be interested in:

Stay up-to-date with the latest content from NASA as we explore the universe and discover more about our home planet.

Extreme January Cold

3 min read

Following a significant winter storm, frigid temperatures lingered in late January 2026 across a vast swath of the U.S.

Article

Summer Heat Lingers in the West

3 min read

A prolonged high-pressure weather system brought unusually warm September temperatures to British Columbia and the Pacific Northwest.

Article

Fires Erupt in South-Central Chile 

2 min read

Tens of thousands of people fled to safety as blazes spread throughout the country’s Biobío and Ñuble regions.

Article

Powered by WPeMatico

Get The Details…

Curiosity Blog, Sols 4798-4803: Back for More Science

Curiosity Blog, Sols 4798-4803: Back for More Science

2 min read

Curiosity Blog, Sols 4798-4803: Back for More Science

An overhead color photo of the Martian surface shows pale orange-tan, flat, rocky terrain, with the surface a mixture of jagged-edged slabs with fine soil leveling the gaps between them, and small rocks of various sizes scattered around the surface. Near the image center and at lower-right are two drill holes in the rock, each with mounded soil around the opening that had been extracted from the holes during drilling.
NASA’s Mars rover Curiosity acquired this image showing the side-by-side drill holes “Nevado Sajama” (right) and “Nevado Sajama2” (left). Curiosity used its Mast Camera (Mastcam) to capture the image on Jan. 31, 2026 — Sol 4795, or Martian day 4,795 of the Mars Science Laboratory mission — at 22:55:27 UTC.
NASA/JPL-Caltech/MSSS

Written by Michelle Minitti, MAHLI Deputy Principal Investigator

Earth planning date: Friday, Feb. 6, 2026

The results from our first visit to the “Nevado Sajama” drill location were intriguing enough to motivate our return to do a deeper dive into the minerals and compounds locked in this rock with SAM (the Sample Analysis at Mars instrument suite). As explained in the last blog, that deeper dive involves using the second of two vials of a chemical reagent, tetramethylammonium hydroxide (TMAH), that helps makes molecules detectable to SAM that would otherwise be undetectable. This week was focused on completing the many carefully-coordinated steps to apply the TMAH reagent to the rock powder from a drill hole and then analyze the treated sample. As you can see in the image above, we know the drilling necessary to collect the sample was successful, as was delivery of the sample to SAM. We are awaiting word about the first part of the SAM analysis, and are running the second part in the weekend plan. 

As you can imagine, running a mass spectrometer and chemistry experiment remotely on another planet takes a lot of energy, but throughout the week, the team took advantage of whatever spare power there was to include additional science observations. ChemCam planned two attempts at targeting the Nevado Sajama2 drill-hole interior, analyzed “Tiquipaya,” one of the family of rocks broken by the rover wheels that expose bright white material, and measured the chemistry of the atmosphere with a passive sky observation. They also planned an RMI mosaic of layers near the base of the “Mishe Mokwa” butte to our east. MAHLI and APXS paired up to image and analyze the ground-up tailings around the drill hole for the most direct measure of chemistry of what SAM analyzes. As Mastcam acquired a full 360-degree mosaic the first time we were at Nevado Sajama, they did not have many rock observations to plan. Instead, they turned their eyes toward the sky to measure the amount of dust in the atmosphere. Navcam made complementary measurements of atmospheric dust and planned movies and imaging surveys of clouds and dust devils. Ever watchful, RAD and REMS made their regular measurements of the Martian environment while DAN regularly monitored the Martian subsurface. 

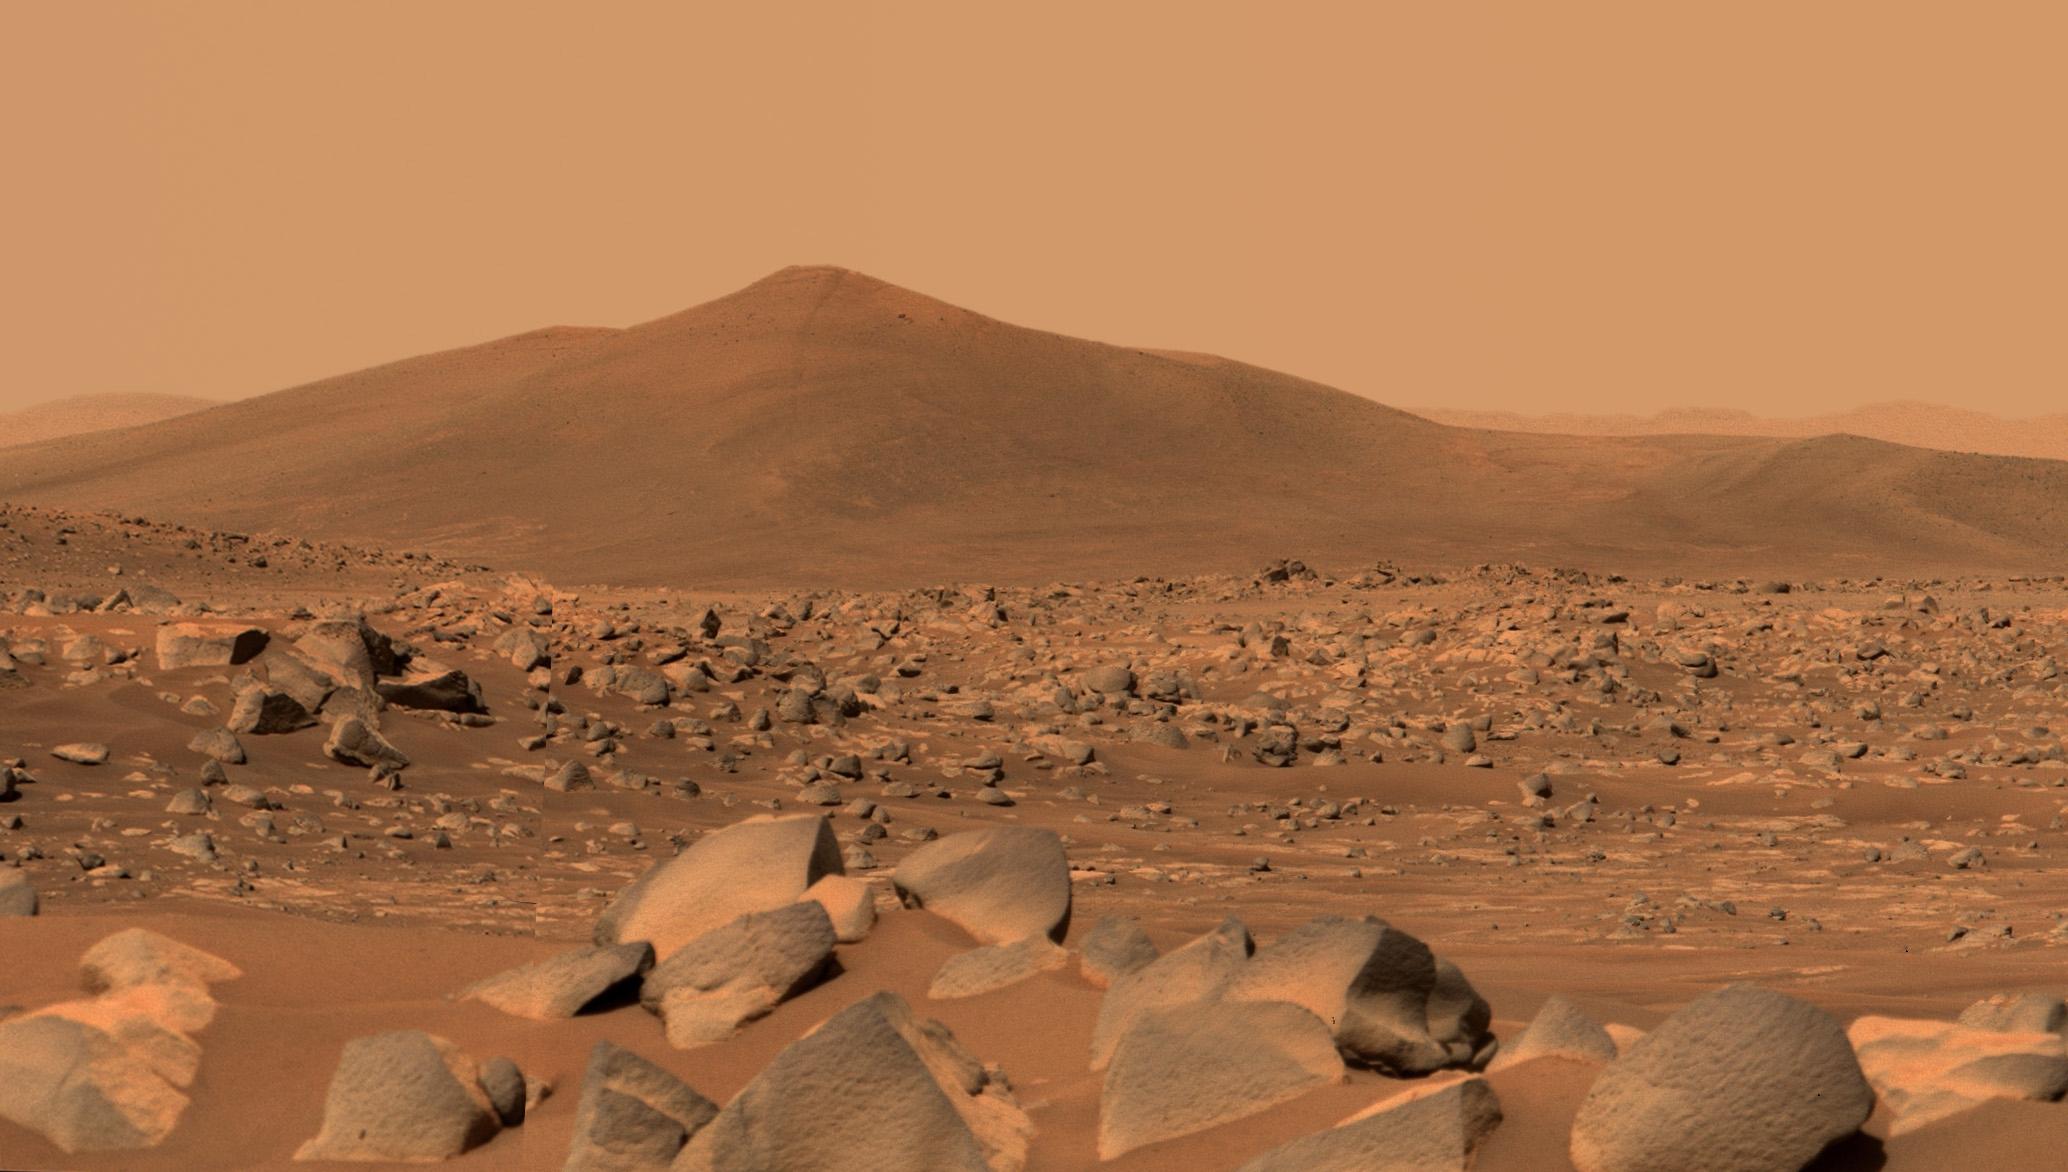
A rover sits on the hilly, orange Martian surface beneath a flat grey sky, surrounded by chunks of rock.
NASA’s Mars rover Curiosity at the base of Mount Sharp
NASA/JPL-Caltech/MSSS

Share

Details

Last Updated
Feb 10, 2026

Related Terms

Powered by WPeMatico

Get The Details…

CubeSats’ Missions Begin

CubeSats’ Missions Begin

Two CubeSats, one silver and one with a red face, are ejected from the International Space Station (bottom left) into the blackness of space.
NASA/Chris Williams

NASA astronaut Chris Williams pointed a camera out a window on the cupola as a set of CubeSats were deployed outside the Kibo laboratory module by a small satellite orbital deployer into Earth orbit. Students from Mexico, Italy, ThailandMalaysia, and Japan designed the shoe-boxed satellites for a series of Earth observations and technology demonstrations.

CubeSats are a class of nanosatellites – small spacecraft weighing 1-10 kilograms – that use a standard size and form factor. The development of CubeSats has advanced into its own industry with government, industry and academia collaborating for ever increasing capabilities.  CubeSats now provide a cost-effective platform for science investigations, new technology demonstrations and advanced mission concepts.

Image credit: NASA/Chris Williams

Powered by WPeMatico

Get The Details…
Monika Luabeya

NASA’s Hubble Captures Light Show Around Rapidly Dying Star

NASA’s Hubble Captures Light Show Around Rapidly Dying Star

4 Min Read

NASA’s Hubble Captures Light Show Around Rapidly Dying Star

In the image center, an opaque oval cloud of gray gas aligned from 1 o’clock to 7 o’clock hides a star. Two strong beams of light from the star emerge from large holes in both sides of the cloud, forming narrow cones extending toward 10 o’clock and 4 o’clock. The central cloud is surrounded by concentric, wispy shells of gas illuminated by the star’s light. The shells reflect extra light where they’re hit by the twin beams. A crowd of smaller stars with cross-shaped spikes over them surrounds the nebula on a black background.
NASA’s Hubble Space Telescope reveals the clearest view yet of the Egg Nebula.
Credits:
NASA, ESA, Bruce Balick (UWashington)

This stunning image from NASA’s Hubble Space Telescope reveals a dramatic interplay of light and shadow in the Egg Nebula, sculpted by freshly ejected stardust. Located approximately 1,000 light-years away in the constellation Cygnus, the Egg Nebula features a central star obscured by a dense cloud of dust — like a “yolk” nestled within a dark, opaque “egg white.” Only Hubble’s sharpness can unveil the intricate details that hint at the processes shaping this enigmatic structure.

It is the first, youngest, and closest pre-planetary nebula ever discovered. (A pre-planetary nebula is a precursor stage of a planetary nebula, which is a structure of gas and dust formed from the ejected layers of a dying, Sun-like star. The term is a misnomer, as planetary nebulae are not related to planets.) 

In the image center, an opaque oval cloud of gray gas aligned from 1 ou2019clock to 7 ou2019clock hides a star. Two strong beams of light from the star emerge from large holes in both sides of the cloud, forming narrow cones extending toward 10 ou2019clock and 4 ou2019clock. The central cloud is surrounded by concentric, wispy shells of gas illuminated by the staru2019s light. The shells reflect extra light where theyu2019re hit by the twin beams. A crowd of smaller stars with cross-shaped spikes over them surrounds the nebula on a black background.
NASA’s Hubble Space Telescope reveals the clearest view yet of the Egg Nebula. This structure of gas and dust was created by a dying, Sun-like star. These newest observations were taken with Hubble’s Wide Field Camera 3.
NASA, ESA, Bruce Balick (UWashington)

The Egg Nebula offers a rare opportunity to test theories of late-stage stellar evolution. At this early phase, the nebula shines by reflecting light from its central star, which escapes through a polar “eye” in the surrounding dust. This light emerges from a dusty disk expelled from the star’s surface just a few hundred years ago.

Twin beams from the dying star illuminate fast-moving polar lobes that pierce a slower, older series of concentric arcs. Their shapes and motions suggest gravitational interactions with one or more hidden companion stars, all buried deep within the thick disk of stardust.

Stars like our Sun shed their outer layers as they exhaust their hydrogen and helium fuel. The exposed core becomes so hot that it ionizes surrounding gas, creating the glowing shells seen in planetary nebulae such as the Helix, Stingray, and Butterfly nebulae. However, the compact Egg Nebula is still in a brief transitional phase — known as the pre-planetary stage — that lasts only a few thousand years. This makes it an ideal time to study the ejection process while the forensic evidence remains fresh.

The symmetrical patterns captured by Hubble are too orderly to result from a violent explosion like a supernova. Instead, the arcs, lobes, and central dust cloud likely stem from a coordinated series of poorly understood sputtering events in the carbon-enriched core of the dying star. Aged stars like these forged and released the dust that eventually seeded future star systems, such as our own solar system, which coalesced into Earth and other rocky planets 4.5 billion years ago.

Hubble has turned its gaze towards the Egg Nebula before. A first visible-light image from the telescope’s WFPC2 (Wide Field and Planetary Camera 2) was complemented in 1997 by a near-infrared NICMOS (Near Infrared Camera and Multi-Object Spectrometer) image, giving a closer look at the light given off by the nebula. In 2003, Hubble’s ACS (Advanced Camera for Surveys) yielded a new view of the Egg, showing the full extent of the ripples of dust around it. A further image from WFC3 (Wide Field Camera 3) in 2012 zoomed in on the central dust cloud and dramatic gas outflows. This new image combines the data used to create the 2012 image with additional observations from the same program to deliver the clearest look yet at this intricate cosmic egg.

The Hubble Space Telescope has been operating for over three decades and continues to make ground-breaking discoveries that shape our fundamental understanding of the universe. Hubble is a project of international cooperation between NASA and ESA (European Space Agency). NASA’s Goddard Space Flight Center in Greenbelt, Maryland, manages the telescope and mission operations. Lockheed Martin Space, based in Denver, also supports mission operations at Goddard. The Space Telescope Science Institute in Baltimore, which is operated by the Association of Universities for Research in Astronomy, conducts Hubble science operations for NASA.

Share

Details

Last Updated
Feb 10, 2026
Editor
Andrea Gianopoulos
Contact
Media

Claire Andreoli
NASA’s Goddard Space Flight Center
Greenbelt, Maryland
claire.andreoli@nasa.gov

Ann Jenkins, Christine Pulliam
Space Telescope Science Institute
Baltimore, Maryland

Powered by WPeMatico

Get The Details…

Core Survey by NASA’s Roman Mission Will Unveil Universe’s Dark Side

Core Survey by NASA’s Roman Mission Will Unveil Universe’s Dark Side

The broadest planned survey by NASA’s upcoming Nancy Grace Roman Space Telescope will reveal hundreds of millions of galaxies scattered across the cosmos. After Roman launches as soon as this fall, scientists will use these sparkly beacons to study the universe’s shadowy underpinnings: dark matter and dark energy.

“We set out to build the ultimate wide-area infrared survey, and I think we accomplished that,” said Ryan Hickox, a professor at Dartmouth College in Hanover, New Hampshire, and co-chair of the committee that shaped the survey’s design. “We’ll use Roman’s enormous, deep 3D images to explore the fundamental nature of the universe, including its dark side.”

An infographic of Roman's High-Latitude Wide-Area Survey
This infographic describes the High-Latitude Wide-Area Survey that will be conducted by NASA’s Nancy Grace Roman Space Telescope. This observation program will cover more than 5,000 square degrees (about 12 percent of the sky) in just under a year and a half. Scientists will use the survey to analyze hundreds of millions of galaxies scattered across the cosmos that reveal clues about the universe’s shadowy underpinnings — dark matter and dark energy — as well as a wealth of other science topics.
NASA’s Goddard Space Flight Center

Roman’s High-Latitude Wide-Area Survey is one of the mission’s three core observation programs. It will cover more than 5,000 square degrees (about 12 percent of the sky) in just under a year and a half. Roman will look far from the dusty plane of our Milky Way galaxy (that’s what the “high-latitude” part of the survey name means), looking up and out of the galaxy rather than through it to get the clearest view of the distant cosmos.

“This survey is going to be a spectacular map of the cosmos, the first time we have Hubble-quality imaging over a large area of the sky,” said David Weinberg, an astronomy professor at Ohio State University in Columbus, who played a major role in devising the survey. “Even a single pointing with Roman needs a whole wall of 4K televisions to display at full resolution. Displaying the whole high-latitude survey at once would take half a million 4K TVs, enough to cover 200 football fields or the cliff face of El Capitan.”

The survey will combine the powers of imaging and spectroscopy to unveil a goldmine of galaxies strewn across cosmic time. Astronomers will use the survey’s data to explore invisible dark matter, detectable only via its gravitational effects on other objects, and the nature of dark energy — a pressure that seems to be speeding up the universe’s expansion.

“Cosmic acceleration is the biggest mystery in cosmology and maybe in all of physics,” Weinberg said. “Somehow, when we get to scales of billions of light years, gravity pushes rather than pulls. The Roman wide area survey will provide critical new clues to help us solve this mystery, because it allows us to measure the history of cosmic structure and the early expansion rate much more accurately than we can today.”

Weighing shadows

Anything that has mass warps space-time, the underlying fabric of the universe. Extremely massive things like clusters of galaxies warp space-time so much that they distort the appearance of background objects — a phenomenon called gravitational lensing.

“It’s like looking through a cosmic funhouse mirror,” Hickox said. “It can smear or duplicate distant galaxies, or if the alignment is just right, it can magnify them like a natural telescope.”

Gravitational lensing animation
This simulation shows the type of science astronomers will be able to do with future observations from NASA’s Nancy Grace Roman Space Telescope. The sequence demonstrates how the gravity of intervening galaxy clusters and dark matter can distort the light from farther objects, warping their appearance. More intervening material creates stronger distortions. By analyzing these features, astronomers can study elusive dark matter, which can only be measured indirectly through its gravitational effects on visible matter. As a bonus, the distortion acts like a telescope, enabling observations of extremely distant galaxies. Simulations like this one help astronomers understand what Roman’s future observations could tell us about the universe, and provide useful data to validate data analysis techniques.
Caltech/IPAC/R. Hurt

Roman’s view will be large and sharp enough to study this lensing effect on a small scale to see how clumps of dark matter warp the appearance of distant galaxies. Astronomers will create a detailed map of the large-scale distribution of matter — both seen and unseen — throughout the universe and fill in more of the gaps in our understanding of dark matter. Studying how structures grow over time will also help astronomers explore dark energy’s strength at various cosmic stages.

“The data analysis standards required to measure weak gravitational lensing are such that the astronomy community as a whole will benefit from very high-quality data over the full survey area, which will undoubtedly lead to unexpected discoveries,” said Olivier Doré, a senior research scientist at NASA’s Jet Propulsion Laboratory in Southern California, who leads a team focused on Roman imaging cosmology with the High-Latitude Wide-Area Survey. “This survey will accomplish much more than just revealing dark energy!”

While NASA’s Hubble and James Webb space telescopes both also study gravitational lensing, the breakthrough with Roman is its large field of view.

“Weak lensing distorts galaxy shapes too subtly to see in any single galaxy — it’s invisible until you do a statistical analysis,” Hickox said. “Roman will see more than a billion galaxies in this survey, and we estimate about 600 million of them will be detailed enough for Roman to study these effects. So Roman will trace the growth of structure in the universe in 3D from shortly after the big bang to today, mapping dark matter more precisely than we’ve ever done before.”

Sounding out dark energy

Roman’s wide-area survey will also gather spectra from around 20 million galaxies. Analyzing spectra helps show how the universe expanded during different cosmic eras because when an object recedes, all of the light waves we receive from it are stretched out and shifted toward redder wavelengths — a phenomenon called redshift.

By determining how quickly galaxies are receding from us, carried by the relentless expansion of space, astronomers can find out how far away they are — the more a galaxy’s spectrum is redshifted, the farther away it is. Astronomers will use this phenomenon to make a 3D map of all the galaxies measured within the survey area out to about 11.5 billion light-years away.

That will reveal frozen echoes of ancient sound waves that once rippled through the primordial cosmic sea. For most of the universe’s first half-million years, the cosmos was a dense, almost uniform sea of plasma (charged particles).

Rare, tiny clumps attracted more matter toward themselves gravitationally. But it was too hot for the material to stick together, so it rebounded. This push and pull created waves of pressure—sound — that propagated through the plasma.

A gif of chladni plate footage
This animation illustrates how small particles (in this case, sand) behave when exposed to different sound frequencies. In the very early universe, a cosmic “hum” created ripples in the primordial soup that filled space. Since the ripples were places where more matter was collected, like the rings of sand shown here, slightly more galaxies formed along them than elsewhere. As the universe expanded over billions of years, so did these structures. By comparing their size during different cosmic epochs, astronomers can trace the universe’s expansion.
Nigel Stanford (used with permission)

Over time, the universe cooled and the waves ceased, essentially freezing the ripples (called baryon acoustic oscillations) in place. Since the ripples were places where more matter was collected, slightly more galaxies formed along them than elsewhere. As the universe expanded over billions of years, so did these structures.

These rings act like a ruler for the universe. Today, they are about 500 million light-years wide. Roman will precisely measure their size across cosmic time, revealing how dark energy may have evolved.

Recent results from other telescopes hint that dark energy may be shifting in strength over cosmic time. “Roman will be able to make high precision tests that should tell us whether these hints are real deviations from our current standard model or not,” said Risa Wechsler, director of Stanford University’s KIPAC (Kavli Institute for Particle Astrophysics and Cosmology) in California and co-chair of the committee that shaped the survey’s design. “Roman’s imaging survey combined with its redshift survey give us new information about the evolution of the universe — both how it expands and how structures grow with time — that will help us understand what dark energy and gravity are doing at unprecedented precision.”

Altogether, Roman will help us understand the effects of dark energy 10 times more precisely than current measurements, helping discern between the leading theories that attempt to explain why the expansion of the universe is speeding up.

Because of the way Roman will survey the universe, it will reveal everything from small, rocky objects in our outer solar system and individual stars in nearby galaxies to galaxy mergers and black holes at the cosmic frontier over 13 billion years ago.

“Roman is exciting because it covers such a wide area with the image quality only available in space,” Wechsler said. “This enables a broad range of science, from things we can anticipate studying to discoveries that we haven’t thought of yet.” 

The Nancy Grace Roman Space Telescope is managed at NASA’s Goddard Space Flight Center in Greenbelt, Maryland, with participation by NASA’s Jet Propulsion Laboratory in Southern California; Caltech/IPAC in Pasadena, California; the Space Telescope Science Institute in Baltimore; and a science team comprising scientists from various research institutions. The primary industrial partners are BAE Systems Inc. in Boulder, Colorado; L3Harris Technologies in Rochester, New York; and Teledyne Scientific & Imaging in Thousand Oaks, California.

By Ashley Balzer
NASA’s Goddard Space Flight Center, Greenbelt, Md.

Media contact:

Claire Andreoli
NASA’s Goddard Space Flight Center, Greenbelt, Md.
301-286-1940

Share

Details

Last Updated

Feb 10, 2026

Editor
Ashley Balzer
Contact
Ashley Balzer
Location
Goddard Space Flight Center

Powered by WPeMatico

Get The Details…
Ashley Balzer