Restless Kīlauea Launches Lava and Ash
Kīlauea has entered its second year of episodic activity after reawakening in December 2024. Since then, the Hawaiian volcano has gone through dozens of bouts of lava fountaining, each lasting several hours to several days.
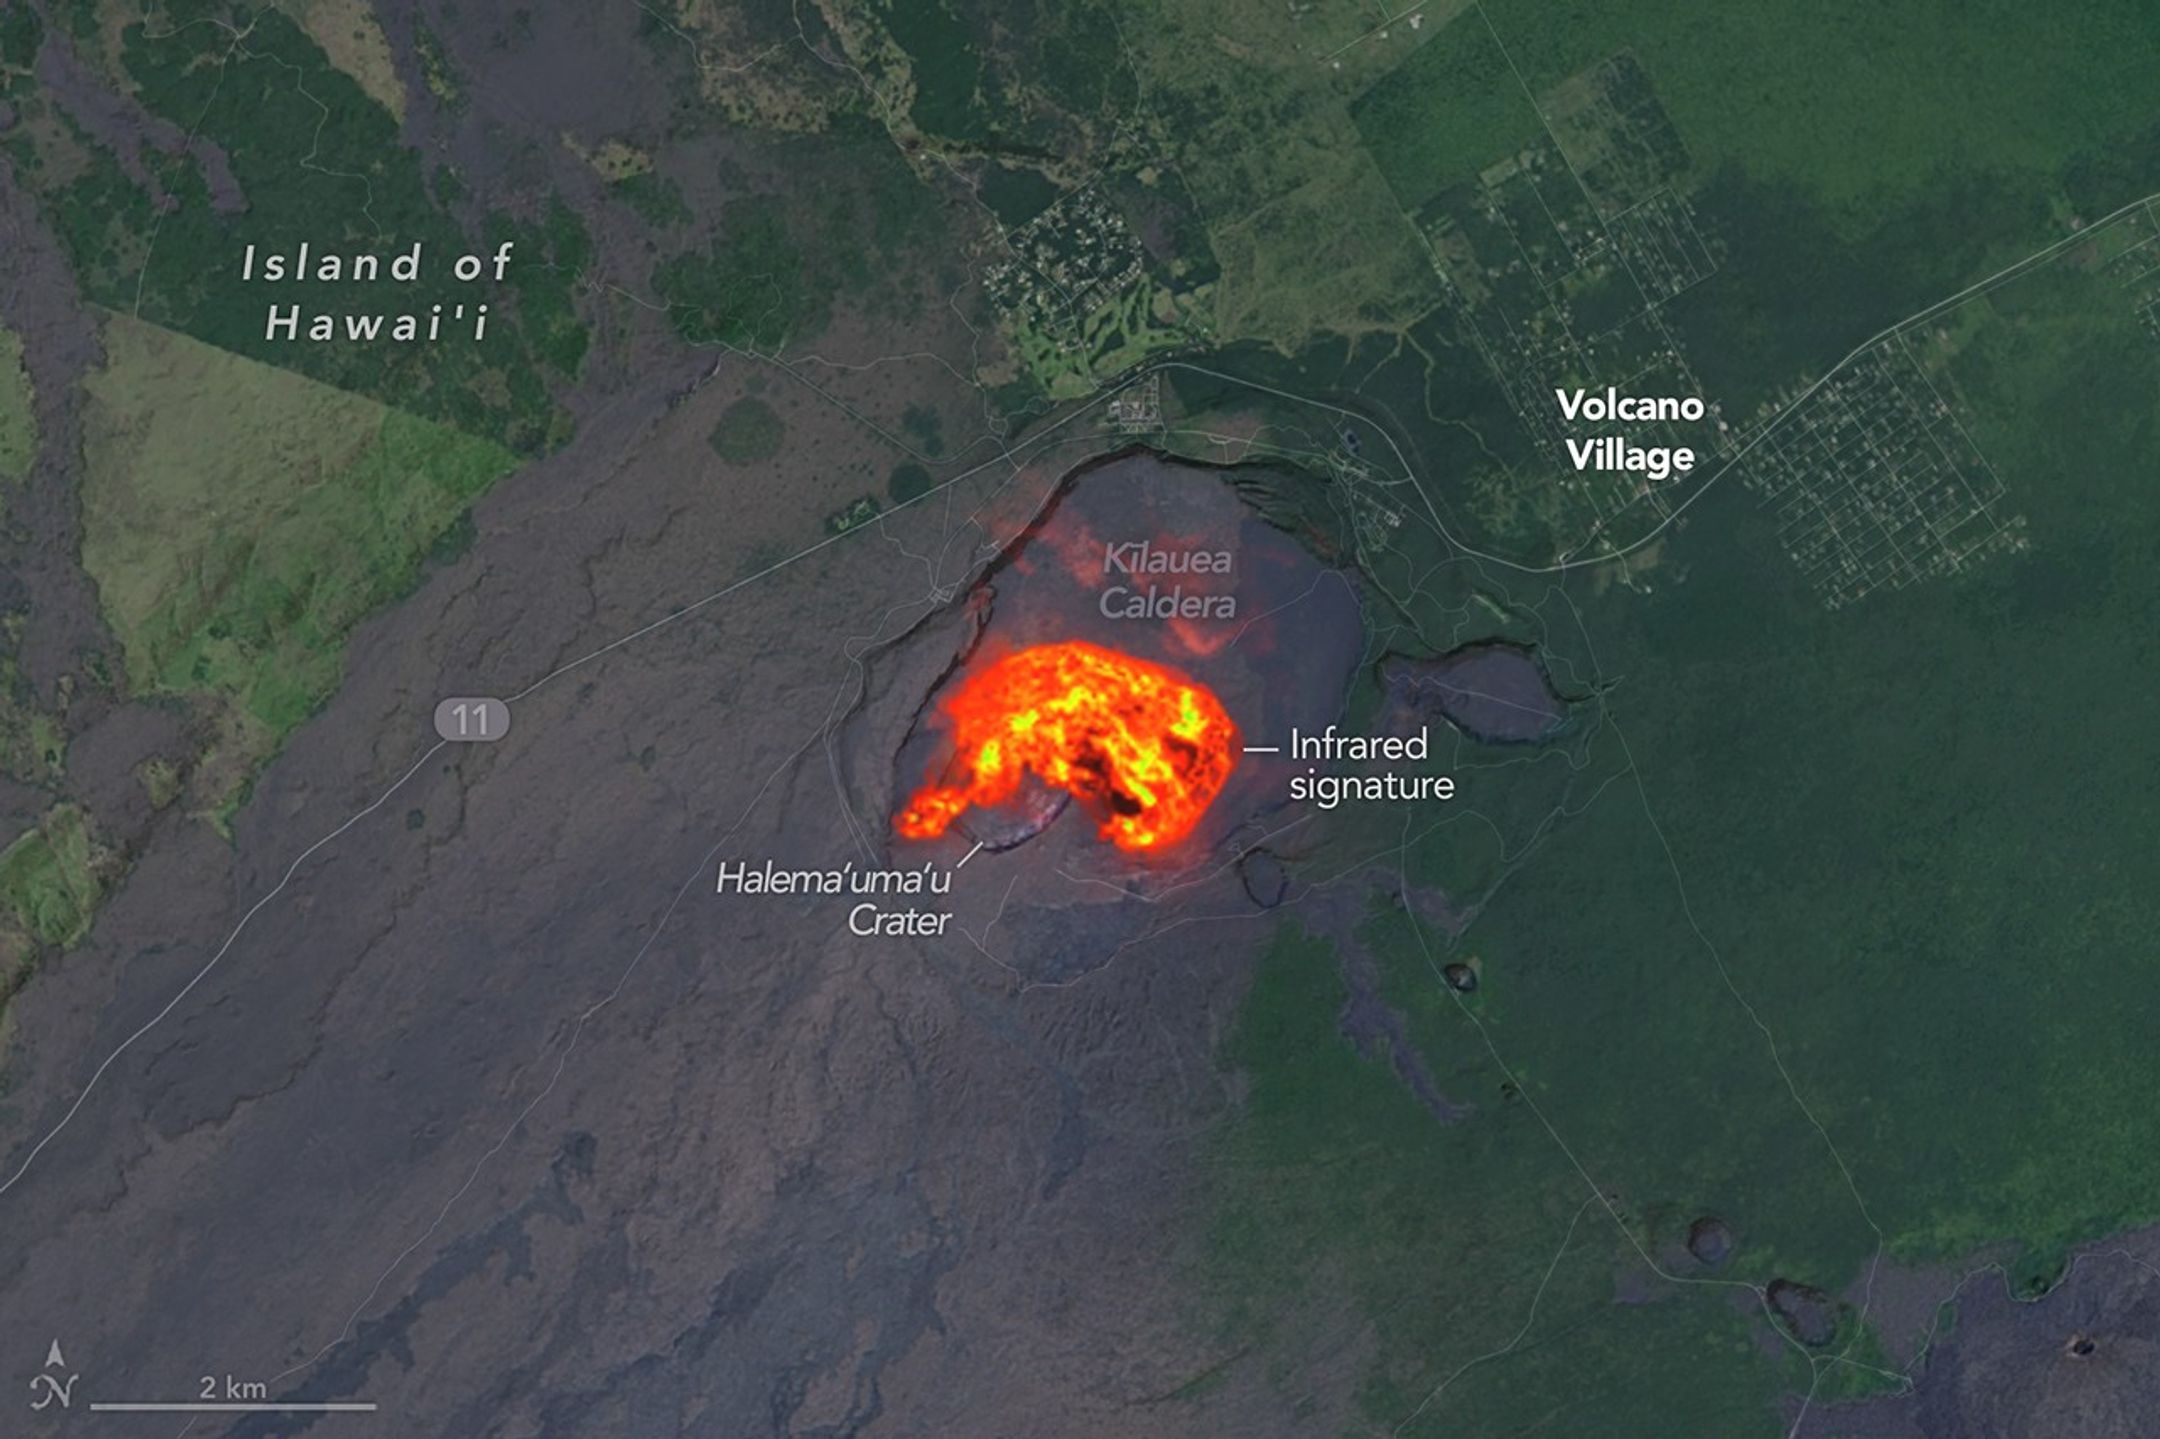
Activity ramped up once again on March 10, 2026, for episode 43 of the eruption. From approximately 9 a.m. to 6 p.m. local time that day, lava spewed from two active vents on the southwest side of Halema‘uma‘u Crater, adding to the ever-thickening layer of fresh basaltic rock in the summit caldera. The flareup also featured the highest lava fountains of the current eruption, estimated at 1,770 feet (540 meters). Meanwhile, ash and other airborne debris fell on communities up to 50 miles (80 kilometers) away.
About 4 hours after fountaining subsided, the Landsat 9 satellite passed over the Island of Hawai‘i. This image shows shortwave infrared and near-infrared data, acquired with the satellite’s OLI (Operational Land Imager) at 10:20 p.m. local time on March 10 (08:20 Universal Time on March 11), revealing heat emanating from the still-sizzling lava. That information is layered over a composite of daytime Landsat images and a digital elevation model.
An estimated 16 million cubic yards (12 million cubic meters) of lava erupted during the episode, according to the Hawaiian Volcano Observatory (HVO), bringing the total volume erupted across all episodes since December 2024 to close to 325 million cubic yards (250 million cubic meters). Over the same period, the depth of lava in the crater has increased by about 300 feet (90 meters).
While lava remained confined to the summit area, other erupted material traveled much farther. Images captured by satellites orbiting over the area during the daytime showed a volcanic plume drifting northeast from the vents. Volcanic gas and ash reached a maximum height in the atmosphere of more than 30,000 feet (9,100 meters) above sea level, the HVO said. The aviation color code was elevated to red during the eruption, and several flights at the airport in Hilo were canceled, according to news reports.
Volcanic fragments up to several inches in diameter fell along the north rim of the caldera and in adjacent communities. The hazards and accumulation of debris caused the temporary closure of Highway 11 and the evacuation of visitors from parts of Hawaiʻi Volcanoes National Park. Smaller particles were carried farther: people reported ash and Pele’s hair falling tens of miles to the north and east of Kīlauea, including in Hilo, Keaʻau, and other communities on the coast. Volcanic debris is an eye, skin, and respiratory irritant, the HVO warned, and it may affect water quality for those using rainwater catchment systems.
NASA Earth Observatory image by Michala Garrison, using Landsat data from the U.S. Geological Survey. Story by Lindsey Doermann.

References & Resources
- NASA Earth Observatory (2025, December 9) A Hot and Fiery Decade for Kīlauea. Accessed March 19, 2026.
- NASA Earthdata (2026, March 13) Eruption of Hawaii’s Kilauea. Accessed March 19, 2026.
- U.S. Geological Survey (2026, March 12) Volcano Watch – Episode 43, new fountain height record and tephra fallout on communities. Accessed March 19, 2026.
- U.S. Geological Survey (2026, March 11) Hawaiian Volcano Observatory Status Report. Accessed March 19, 2026.
- U.S. Geological Survey (2026) Kīlauea Eruption Information. Accessed March 19, 2026.
You may also be interested in:
Stay up-to-date with the latest content from NASA as we explore the universe and discover more about our home planet.

The volcano on Russia’s Kamchatka Peninsula continues to erupt after centuries of quiescence.
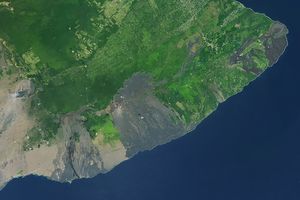
The volcano in Hawaii is one of the most active in the world, and NASA tech makes it easier for…
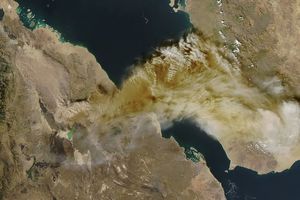
In its first documented eruption, the Ethiopian volcano sent a plume of gas and ash drifting across continents.


Powered by WPeMatico