Helium Conservation by Diffusion Limited Purging of Liquid Hydrogen Tanks

Helium Conservation by Diffusion Limited Purging of Liquid Hydrogen Tanks

This article is from the 2024 Technical Update.

The NASA Engineering and Safety Center (NESC) has developed an analytical model that predicts diffusion between two gases during piston purging of liquid hydrogen (LH2) tanks. This model helps explain dramatic helium savings seen in a recent Kennedy Space Center (KSC) purge, shows that undesired turbulent mixing occurred in Space Shuttle External Tank purges, and is applicable to future helium purges of the Space Launch System Core Stage LH2 tanks.

Background
In 2023, work was completed on a new 1.3-million-gallon (174,000 standard cubic feet (scf)) liquid hydrogen tank at KSC in support of the Space Launch System[1], see Figure 1. Per contract, the vendor delivered this tank filled with gaseous nitrogen, leaving KSC ground operations the task of replacing the nitrogen with helium: a necessary step prior to introducing liquid hydrogen, which would freeze the nitrogen. Prior helium/nitrogen purges on the Apollo/Space Shuttle era 850,000-gallon (114000 scf) LH2 tanks were performed by pumping
out the nitrogen, introducing helium, drawing samples, and then repeating if necessary. However, the new tank did not have a vacuum port, so instead, it was decided to introduce the helium from the top of the tank and push the nitrogen out of the bottom. Two million scf of helium was obtained and made ready for fear the two gases would mix, resulting in a long and expensive purge. Surprisingly, this top-down, or piston purge, resulted in a rapid replacement of the nitrogen with helium, using only 406,000 scf of helium, about 1.6 million scf less than planned (at $1/scf this is a $1.6 million dollar savings). To better understand this remarkable result, the NESC was asked to address the questions; why did this work so well and can it be improved further?

The new 1.3 million-gallon LH2 tank.
Figure 1: The new 1.3-million-gallon LH2 tank

Upon realizing that the purge was diffusion limited and could be modelled, variations were studied, leading to three important conclusions. The flow rate should be increased until the onset of turbulent mixing; once started, the purge should not be stopped because this allows additional diffusion to occur; and trying to improve the purge by varying temperature or pressure has little benefit. Purging of the huge LH2 spheres is rare, but purging of flight tanks is common. In 2008, purge data from three Space Shuttle External Tanks was measured using a mass spectrometer and the NESC was asked to apply the diffusion model to this data. Doing this showed
evidence that turbulent mixing occurred indicating that the flow rates needed to be decreased. Having such a model has provided insight into the use of piston-type helium purges at KSC, with the goal of saving helium and manpower. This work is now directly applicable to purging the LH2 tank on the Space Launch System Core Stage.

The Binary Gas Sensor
During past purges, gas samples were taken to a lab to indicate the status of the purge but doing that for a piston purge would introduce time delays, allowing unwanted diffusion to take place. Fortuitously, an independent NESC assessment[4] was evaluating a binary gas sensor, with an excellent combination of cost, size, power, and weight to implement in the field, providing rapid real-time monitoring of the purge gas ratio. Using this sensor made the piston purging of the new LH2 tank successful.

References

  1. Fesmire, J.; Swanger, A.; Jacobson, J; and Notardonato, W.: “Energy efficient
    large-scale storage of liquid hydrogen,” In IOP Conference Series: Materials
    Science and Engineering, vol. 1240, no. 1, p. 012088. IOP Publishing, 2022.
  2. Youngquist, R.; Arkin C.; Nurge, M.; Captain, J.; Johnson, R.; and Singh, U.:
    Helium Conservation by Diffusion Limited Purging of Liquid Hydrogen Tanks,
    NASA/TM-20240007062, June 2024.
  3. Singh, U.: Evaluation and Testing of Anaerobic Hydrogen Sensors for the
    Exploration Ground Systems Program, NASA/TM-20240012664, Sept. 2024.

Powered by WPeMatico

Get The Details…
Meagan Chappell

Considerations for Using Autonomous Flight Termination Softwarein Crewed Launch Vehicles

Considerations for Using Autonomous Flight Termination Softwarein Crewed Launch Vehicles

This article is from the 2024 Technical Update

Autonomous flight termination systems (AFTS) are being progressively employed onboard launch vehicles to replace ground personnel and infrastructure needed to terminate flight or destruct the vehicle should an anomaly occur. This automation uses on-board real-time data and encoded logic to determine if the flight should be self-terminated. For uncrewed launch vehicles, FTS systems are required to protect the public and governed by the United States Space Force (USSF). For crewed missions, NASA must augment range AFTS requirements for crew safety and certify each flight according to human rating standards, thus adding unique requirements for reuse of software originally intended for uncrewed missions. This bulletin summarizes new information relating to AFTS to raise awareness of key distinctions, summarize considerations and outline best practices for incorporating AFTS into human-rated systems.

Key Distinctions – Crewed v. Uncrewed
There are inherent behavioral differences between uncrewed and crewed AFTS related to design philosophy and fault tolerance. Uncrewed AFTS generally favor fault tolerance against failure-to-destruct over failing silent
in the presence of faults. This tenet permeates the design, even downto the software unit level. Uncrewed AFTS become zero-fault-to-destruct tolerant to many unrecoverable AFTS errors, whereas general single fault
tolerance against vehicle destruct is required for crewed missions. Additionally, unique needs to delay destruction for crew escape, provide abort options and special rules, and assess human-in-the-loop insight, command, and/or override throughout a launch sequence must be considered and introduces additional requirements and integration complexities.

AFTS Software Architecture Components and Best-Practice Use Guidelines
A detailed study of the sole AFTS currently approved by USSF and utilized/planned for several launch vehicles was conducted to understand its characteristics, and any unique risk and mitigation techniques for effective human-rating reuse. While alternate software systems may be designed in the future, this summary focuses on an architecture employing the Core Autonomous Safety Software (CASS). Considerations herein are intended for extrapolation to future systems. Components of the AFTS software architecture are shown, consisting of the CASS, “Wrapper”, and Mission Data Load (MDL) along with key characteristics and use guidelines. A more comprehensive description of each and recommendations for developmental use is found in Ref. 1.

Mission Data Load (MDL) along with key characteristics and use guidelines
TB 24-02 AFTS Software Architecture Components

Best Practices Certifying AFTS Software
Below are non-exhaustive guidelines to help achieve a human-rating
certification for an AFTS.

non-exhaustive guidelines to help achieve a human-rating certification for an AFTS.

References

  1. NASA/TP-20240009981: Best Practices and Considerations for Using
    Autonomous Flight Termination Software In Crewed Launch Vehicles
    https://ntrs.nasa.gov/citations/20240009981
  2. “Launch Safety,” 14 C.F.R., § 417 (2024).
  3. NPR 8705.2C, Human-Rating Requirements for Space Systems, Jul 2017,
    nodis3.gsfc.nasa.gov/
  4. NASA Software Engineering Requirements, NPR 7150.2D, Mar 2022,
    nodis3.gsfc.nasa.gov/
  5. RCC 319-19 Flight Termination Systems Commonality Standard, White
    Sands, NM, June 2019.
  6. “Considerations for Software Fault Prevention and Tolerance”, NESC
    Technical Bulletin No. 23-06 https://ntrs.nasa.gov/citations/20230013383
  7. “Safety Considerations when Repurposing Commercially Available Flight
    Termination Systems from Uncrewed to Crewed Launch Vehicles”, NESC
    Technical Bulletin No. 23-02 https://ntrs.nasa.gov/citations/20230001890

Powered by WPeMatico

Get The Details…
Meagan Chappell

Material Compatibility of Common Aerospace Metals in MMH/MON-3

Material Compatibility of Common Aerospace Metals in MMH/MON-3

This article is from the 2024 Technical Update.

The NESC evaluated material compatibility of some common aerospace metals in monomethylhydrazine (MMH) and nitrogen tetroxide (MON-3). Previous work had identified a lack of quantitative compatibility data for nickel alloy 718, 300 series stainless steel, and titanium Ti-6Al-4V in MMH and MON-3 to support the use of zero-failure-tolerant, thin-walled pressure barriers in these propellants. Static (i.e., not flowing) general corrosion and electrochemistry testing was conducted, evaluating varied processing forms and heat treatment of the metals, water content of propellant, and exposure duration. Corrosion-rate data for all tested product forms, fluids, and durations were on the order of 1 x 10⁻⁶ inch per year rather than the previously documented “less than 1 x 10⁻³ inch per year”. The majority of the corrosion products were seen in the first 20 days of exposure, with an overall corrosion rate decreasing with time due to the increased divisor (time). It is therefore recommended that corrosion testing be performed at multiple short-term durations to inform the need for longer-duration testing.

Background
Nickel alloy 718, 300 series stainless steel, and Ti-6Al-4V are commonly used in storable propulsion systems (i.e., MMH/MON-3), but a concern was raised regarding what quantitative compatibility data were available for proposed zero-failure-tolerant, thin-walled (~0.005 to 0.010 inch thickness) pressure barrier designs. A literature search found that limited and conflicting data were available for commonly used aerospace metals in MMH and MON-3. For example, corrosion behavior was listed qualitatively (e.g., “A” rating), data on materials and fluids tested were imprecise, fluids were identified as contaminated without describing how they were contaminated, no compatibility data were found on relevant geometry specimens (i.e., very thin-walled or convoluted), and limited data were available to quantify differences between tested materials and flight components. When corrosion data were quantified, documented sensitivity was “1 x 10⁻³ inch per year or less”, which is insufficient for assessing long-duration, thin-walled, flight-weight applications.

Discussion
General corrosion testing was performed with a static/non-flowing configuration based on NASA-STD-6001, Test 15 [1]. Design of experiments methods were used to develop a test matrix varying material, propellant, propellant water content, and tested duration. Materials tested were nickel alloy 718 (solution annealed sheet, aged sheet, aged/welded sheet, and hydroformed bellows), 300 series stainless steel (low carbon sheet, titanium stabilized sheet, and hydroformed bellows), and Ti 6Al-4V sheet. Samples were tested in sealed test tubes in MMH and MON-3 with water content ranging from as-received (“dry”) up to specification allowable limits [2,3]. Tested durations ranged from 20 to 365 days. Measurements included inductively coupled plasma mass spectrometry (ICPMS) to identify corrosion products and their concentrations in test fluid, gravimetric (i.e., scale) measurements pre- and post-exposure, and visual inspection. Bimetallic pairs (titanium stabilized 300 series stainless steel: Ti 6Al-4V and nickel alloy 718: Ti 6Al-4V) were tested for up to 65 days in both MMH and MON-3. The test setup incorporated important features of the test standard (e.g., electrode spacing and finish) and adapted the configuration for MMH/MON-3 operation. Measurements included potential difference and current flow between samples. Figure 1 shows images of the general corrosion and bimetallic pair test setups.

TB24-01

Test Results
For all tested materials and product forms, corrosion rates were on the order of 1 x 10⁻⁶ inch per year in MMH or MON-3, three orders of magnitude lower than historically reported. Corrosion products were generated in the first 20 days of exposure, and corrosion rate decreased with time due to the increase in divisor (i.e., time). Corrosion products increased as the water content of the propellants increased but remained in the same order of magnitude between the as-received dry propellant and propellant containing the maximum water content allowed by specification. Figure 2 illustrates test results for corrosion rate, mass loss with duration, and mass loss with water content. It is important to note that water has been demonstrated to contribute to flow decay even when water is within the specification allowable limit, and previous NASA-STD-6001 Test 15 data have demonstrated susceptibility of some nickel alloys to crevice-type corrosion attack [4]. Therefore, these results do not reduce the importance of considering the system impact of water content and evaluating for crevice corrosion behavior. Finally, in the bimetallic pair testing, tested materials did not measurably corrode in MON-3 and MMH within specification-allowable water content, as evidenced by no visual indications of corrosion and very low electrical interaction (i.e., corrosion rates derived to be less than 1 microinch per year from electrical interaction).

TB 24-01

Recommendations
It is recommended that corrosion testing be performed at multiple shortterm durations to inform the need for longer-duration testing.

References

  1. NASA-STD-6001 Flammability, Odor, Offgassing, and Compatibility Requirements
    and Test Procedures for Materials In Environments that Support Combustion
  2. MIL-PRF-27404 Performance Specification: Propellant, Monomethylhydrazine
  3. MIL-PRF-26539 Performance Specification: Propellants, Dinitrogen Tetroxide
  4. WSTF Test 15 Report 12-45708 and WSTF Test 15 Report 13-46207

Powered by WPeMatico

Get The Details…
Meagan Chappell

NASA’s Juno Mission Uncovers Heart of Jovian Moon’s Volcanic Rage

NASA’s Juno Mission Uncovers Heart of Jovian Moon’s Volcanic Rage

5 min read

Preparations for Next Moonwalk Simulations Underway (and Underwater)

The north polar region of Jupiter’s volcanic moon Io
The north polar region of Jupiter’s volcanic moon Io was captured by NASA’s Juno during spacecraft’s the 57th close pass of the gas giant on Dec. 30, 2023. Data from recent flybys is helping scientists understand Io’s interior.
Image data: NASA/JPL-Caltech/SwRI/MSSS
Image processing by Gerald Eichstädt

A new study points to why, and how, Io became the most volcanic body in the solar system.

Scientists with NASA’s Juno mission to Jupiter have discovered that the volcanoes on Jupiter’s moon Io are each likely powered by their own chamber of roiling hot magma rather than an ocean of magma. The finding solves a 44-year-old mystery about the subsurface origins of the moon’s most demonstrative geologic features.

A paper on the source of Io’s volcanism was published on Thursday, Dec. 12, in the journal Nature, and the findings, as well as other Io science results, were discussed during a media briefing in Washington at the American Geophysical Union’s annual meeting, the country’s largest gathering of Earth and space scientists.

About the size of Earth’s Moon, Io is known as the most volcanically active body in our solar system. The moon is home to an estimated 400 volcanoes, which blast lava and plumes in seemingly continuous eruptions that contribute to the coating on its surface. 

This animated tour of Jupiter’s fiery moon Io, based on data collected by NASA’s Juno mission, shows volcanic plumes, a view of lava on the surface, and the moon’s internal structure. NASA/JPL-Caltech/SwRI/Koji Kuramura/Gerald Eichstädt

Although the moon was discovered by Galileo Galilei on Jan. 8, 1610, volcanic activity there wasn’t discovered until 1979, when imaging scientist Linda Morabito of NASA’s Jet Propulsion Laboratory in Southern California first identified a volcanic plume in an image from the agency’s Voyager 1 spacecraft.

“Since Morabito’s discovery, planetary scientists have wondered how the volcanoes were fed from the lava underneath the surface,” said Scott Bolton, Juno principal investigator from the Southwest Research Institute in San Antonio. “Was there a shallow ocean of white-hot magma fueling the volcanoes, or was their source more localized? We knew data from Juno’s two very close flybys could give us some insights on how this tortured moon actually worked.”

The Juno spacecraft made extremely close flybys of Io in December 2023 and February 2024, getting within about 930 miles (1,500 kilometers) of its pizza-faced surface. During the close approaches, Juno communicated with NASA’s Deep Space Network, acquiring high-precision, dual-frequency Doppler data, which was used to measure Io’s gravity by tracking how it affected the spacecraft’s acceleration. What the mission learned about the moon’s gravity from those flybys led to the new paper by revealing more details about the effects of a phenomenon called tidal flexing.

This sequence shows a giant plume erupting from Io’s Tvashtar volcano
This five-frame sequence shows a giant plume erupting from Io’s Tvashtar volcano, extending 200 miles (330 kilometers) above the fiery moon’s surface. It was captured over an eight-minute period by NASA’s New Horizons mission as the spacecraft flew by Jupiter in 2007.
NASA/Johns Hopkins APL/SwRI

Prince of Jovian Tides

Io is extremely close to mammoth Jupiter, and its elliptical orbit whips it around the gas giant once every 42.5 hours. As the distance varies, so does Jupiter’s gravitational pull, which leads to the moon being relentlessly squeezed. The result: an extreme case of tidal flexing — friction from tidal forces that generates internal heat.

“This constant flexing creates immense energy, which literally melts portions of Io’s interior,” said Bolton. “If Io has a global magma ocean, we knew the signature of its tidal deformation would be much larger than a more rigid, mostly solid interior. Thus, depending on the results from Juno’s probing of Io’s gravity field, we would be able to tell if a global magma ocean was hiding beneath its surface.”

The Juno team compared Doppler data from their two flybys with observations from the agency’s previous missions to the Jovian system and from ground telescopes. They found tidal deformation consistent with Io not having a shallow global magma ocean.

“Juno’s discovery that tidal forces do not always create global magma oceans does more than prompt us to rethink what we know about Io’s interior,” said lead author Ryan Park, a Juno co-investigator and supervisor of the Solar System Dynamics Group at JPL. “It has implications for our understanding of other moons, such as Enceladus and Europa, and even exoplanets and super-Earths. Our new findings provide an opportunity to rethink what we know about planetary formation and evolution.”

There’s more science on the horizon. The spacecraft made its 66th science flyby over Jupiter’s mysterious cloud tops on Nov. 24. Its next close approach to the gas giant will occur 12:22 a.m. EST, Dec. 27. At the time of perijove, when Juno’s orbit is closest to the planet’s center, the spacecraft will be about 2,175 miles (3,500 kilometers) above Jupiter’s cloud tops and will have logged 645.7 million miles (1.039 billion kilometers) since entering the gas giant’s orbit in 2016.

More About Juno

JPL, a division of Caltech in Pasadena, California, manages the Juno mission for the principal investigator, Scott Bolton, of the Southwest Research Institute in San Antonio. Juno is part of NASA’s New Frontiers Program, which is managed at NASA’s Marshall Space Flight Center in Huntsville, Alabama, for the agency’s Science Mission Directorate in Washington. The Italian Space Agency (ASI) funded the Jovian InfraRed Auroral Mapper. Lockheed Martin Space in Denver built and operates the spacecraft. Various other institutions around the U.S. provided several of the other scientific instruments on Juno.

More information about Juno is available at:

https://science.nasa.gov/mission/juno

News Media Contacts

DC Agle
Jet Propulsion Laboratory, Pasadena, Calif.
818-393-9011
agle@jpl.nasa.gov

Karen Fox / Erin Morton
NASA Headquarters, Washington
202-385-1287 / 202-805-9393
karen.c.fox@nasa.gov / erin.morton@nasa.gov

Deb Schmid
Southwest Research Institute, San Antonio
210-522-2254
dschmid@swri.org

2024-173

Share

Details

Last Updated

Dec 12, 2024

Powered by WPeMatico

Get The Details…
Anthony Greicius

NASA Successfully Integrates Roman Mission’s Telescope, Instruments

NASA Successfully Integrates Roman Mission’s Telescope, Instruments

Roman Integrated Payload Assembly
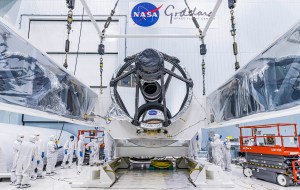
The telescope and instruments for NASA’s Nancy Grace Roman Space Telescope were recently integrated together on the observatory’s instrument carrier at the agency’s Goddard Space Flight Center in Greenbelt, Md. Next, the entire system will be joined to the Roman spacecraft.
NASA/Chris Gunn

NASA’s Nancy Grace Roman Space Telescope team has successfully integrated the mission’s telescope and two instruments onto the instrument carrier, marking the completion of the Roman payload. Now the team at NASA’s Goddard Space Flight Center in Greenbelt, Maryland, will begin joining the payload to the spacecraft.

“We’re in the middle of an exciting stage of mission preparation,” said Jody Dawson, a Roman systems engineer at NASA Goddard. “All the components are now here at Goddard, and they’re coming together in quick succession. We expect to integrate the telescope and instruments with the spacecraft before the year is up.”

Engineers first integrated the Coronagraph Instrument, a technology demonstration designed to image exoplanets — worlds outside our solar system — by using a complex suite of masks and active mirrors to obscure the glare of the planets’ host stars.

Then the team integrated the Optical Telescope Assembly, which includes a 7.9-foot (2.4-meter) primary mirror, nine additional mirrors, and their supporting structures and electronics. The telescope will focus cosmic light and send it to Roman’s instruments, revealing billions of objects strewn throughout space and time. Roman will be the most stable large telescope ever built, at least 10 times more so than NASA’s James Webb Space Telescope and 100 times more than the agency’s Hubble Space Telescope. This will allow scientists to make measurements at levels of precision that can answer important questions about dark energy, dark matter, and worlds beyond our solar system.

Roman Wide Field Instrument installation
Technicians install the primary instrument for NASA’s Nancy Grace Roman Space Telescope, called the Wide Field Instrument (at left), in the biggest clean room at the agency’s Goddard Space Flight Center in Greenbelt, Md. This marked the final step to complete the Roman payload, which also includes a Coronagraph instrument and the Optical Telescope Assembly.
NASA/Chris Gunn

With those components in place, the team then added Roman’s primary instrument. Called the Wide Field Instrument, this 300-megapixel infrared camera will give Roman a deep, panoramic view of the universe. Through the Wide Field Instrument’s surveys, scientists will be able to explore distant exoplanets, stars, galaxies, black holes, dark energy, dark matter, and more. Thanks to this instrument and the observatory’s efficiency, Roman will be able to image large areas of the sky 1,000 times faster than Hubble with the same sharp, sensitive image quality.

“It would be quicker to list the astronomy topics Roman won’t be able to address than those it will,” said Julie McEnery, the Roman senior project scientist at NASA Goddard. “We’ve never had a tool like this before. Roman will revolutionize the way we do astronomy.”

The telescope and instruments were mounted to Roman’s instrument carrier and precisely aligned in the largest clean room at Goddard, where the observatory is being assembled. Now, the whole assembly is being attached to the Roman spacecraft, which will deliver the observatory to its orbit and enable it to function once there.

At the same time, the mission’s deployable aperture cover — a visor that will shield the telescope from unwanted light — is being joined to the outer barrel assembly, which serves as the telescope’s exoskeleton.

“We’ve had an incredible year, and we’re looking forward to another one!” said Bear Witherspoon, a Roman systems engineer at NASA Goddard. “While the payload and spacecraft undergo a smattering of testing together, the team will work toward integrating the solar panels onto the outer barrel assembly.”

That keeps the observatory on track for completion by fall 2026 and launch no later than May 2027.

To virtually tour an interactive version of the telescope, visit:

https://roman.gsfc.nasa.gov/interactive

The Nancy Grace Roman Space Telescope is managed at NASA’s Goddard Space Flight Center in Greenbelt, Maryland, with participation by NASA’s Jet Propulsion Laboratory and Caltech/IPAC in Southern California, the Space Telescope Science Institute in Baltimore, and a science team comprising scientists from various research institutions. The primary industrial partners are BAE Systems Inc. in Boulder, Colorado; L3Harris Technologies in Rochester, New York; and Teledyne Scientific & Imaging in Thousand Oaks, California.

By Ashley Balzer
NASA’s Goddard Space Flight Center, Greenbelt, Md.

​​Media Contact:

Claire Andreoli
NASA’s Goddard Space Flight Center
301-286-1940

Powered by WPeMatico

Get The Details…
Ashley Balzer