

Keeping Up with PACE: Summary of the 2025 PAC3 Meeting

12 min read
Keeping Up with PACE: Summary of the 2025 PAC3 Meeting
Introduction
Launched in Feb. 2024, NASA’s Plankton, Aerosol, Cloud, ocean Ecosystem (PACE) mission is a cornerstone of Earth system science designed to deepen our understanding of how these environmental and biological components come together to influence our climate, carbon cycle, and ecosystems. PACE has funded three supporting components: the PACE Postlaunch Airborne eXperiment (PACE–PAX), the third PACE Science and Applications Team (SAT3), and the PACE Validation Science Team (PVST). Each group serves distinct but interdependent roles in advancing the scientific objectives of the mission through product development and rigorous assessment of data quality.
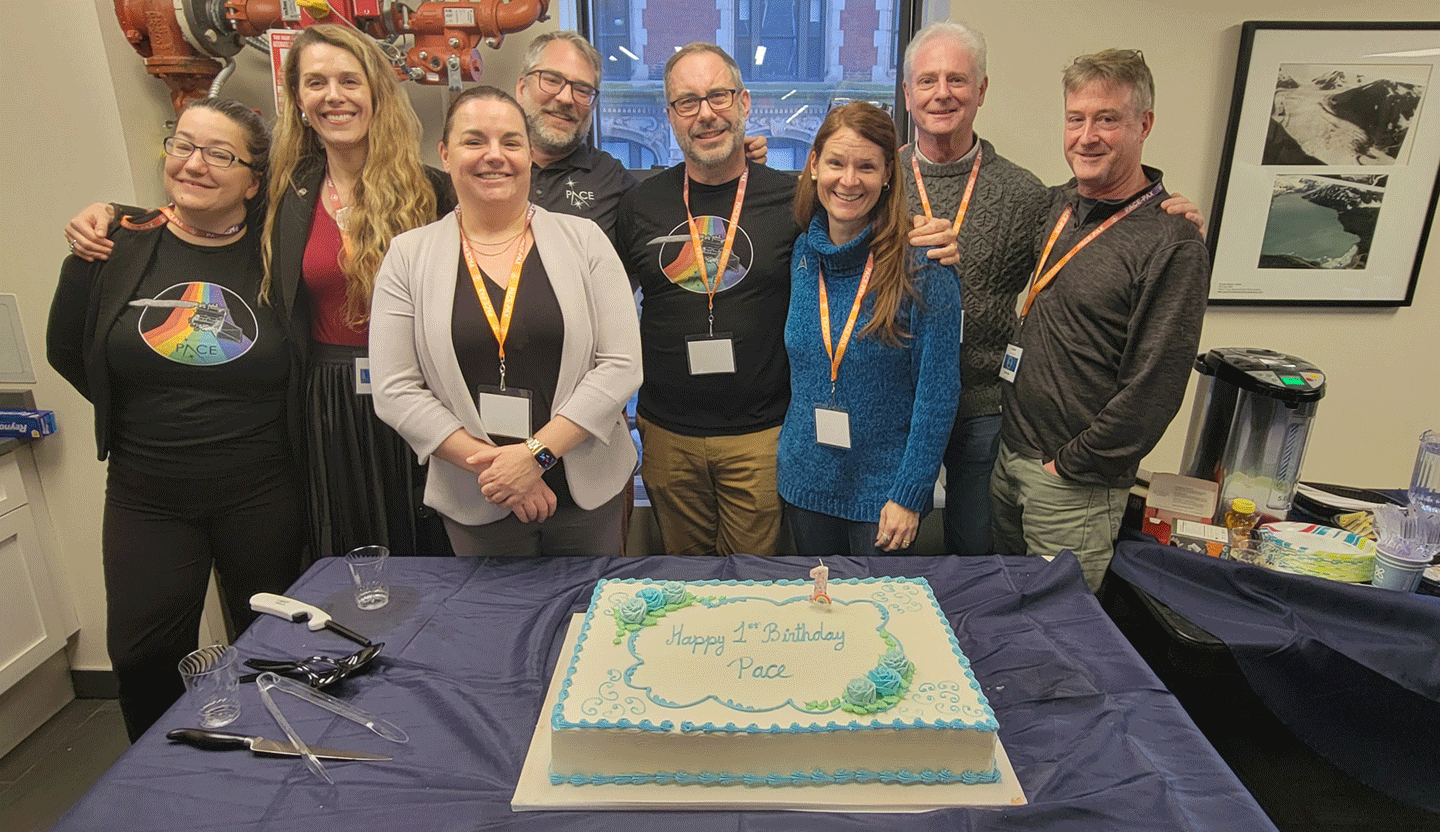
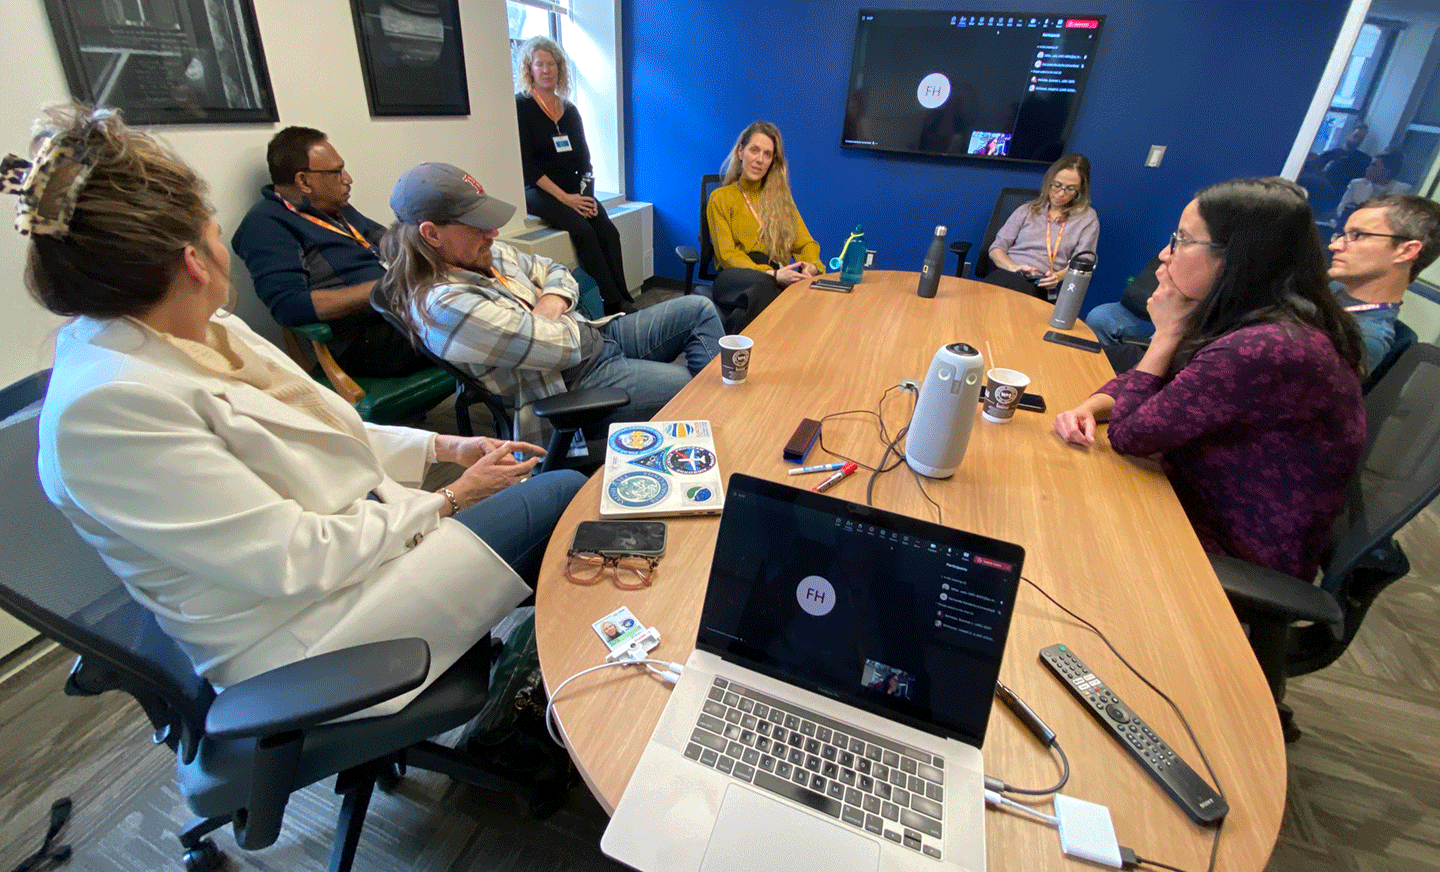
Recognizing the interconnected focus areas among these groups, the organizers consolidated this year’s separate gatherings into one comprehensive event – the “PAC3” meeting. The combined meeting took place from Feb. 18–21, 2025 at NASA’s Goddard Institute for Space Studies (GISS) in New York City, just 10 days after the first anniversary of the PACE launch – see Photo 1 and Photo 2.

The PACE Mission and Payload
PACE’s long-term objectives focus on understanding ocean and terrestrial ecosystem productivity, detecting harmful algal blooms, exploring relationships between aerosols and clouds, and integrating these insights into Earth system science to enhance both research and decision-making capacities. These goals are accomplished by the advanced suite of three complementary instruments.
The Ocean Color Instrument (OCI) is a hyperspectral radiometer that measures ocean ecosystems’ biological, biogeochemical, and physical dynamics by capturing light over hundreds of narrow wavelengths from the deep ultraviolet to the infrared. Additionally, the broad spectral range and spectral resolution of the measurements allow the research community to characterize aerosols, clouds, land surfaces, and trace gases.
The Hyper-Angular Rainbow Polarimeter #2 (HARP2) is a multiangle polarimeter with a wide swath, four visible–near infrared (VIS–NIR) spectral channels, and between 10 and 60 viewing angles (i.e., the hyperangular capability) in each spectral channel. HARP2 is designed for retrieval of cloud and aerosol properties.
The Spectropolarimeter for Planetary Exploration (SPEXone) is also a multiangle polarimeter with different and complementary properties to HARP2. SPEXone has a narrow swath and five viewing angles with a spectral sensitivity of 100 bands from the ultraviolet to the near infrared. It is optimized for the retrieval of aerosol properties.
More details about the PACE mission can be found at its website.
PACE Mission Updates
The PAC3 meeting included a review of the PACE mission’s status and recent developments. This overview included meeting status updates on OCI, SPEXone, and HARP2 from their respective instrument scientists: Gerhard Meister [NASA’s Goddard Space Flight Center (GSFC)], Otto Hasekamp [Space Research Organization, Netherlands (SRON)], and Vanderlei Martins [University of Maryland, Baltimore County (UMBC)]. This section of the meeting covered updates on the early mission data availability and accessibility, including a review of the PACE data website. These details are summarized on the PACE data availability website and the ‘help hub’.
OCI
Meister reported that OCI has exceeded radiometric performance requirements, delivering highly accurate hyperspectral data. He noted that, with the release of Version 3 (V3) data reprocessing, OCI calibration now uses only on-orbit solar diffuser measurements to improve temporal stability. Key improvements of V3 include enhanced corrections for atmospheric absorbing gas effects and updated bidirectional reflectance distribution function (BRDF) parameters. Meister said that analysis of temporal trends has revealed solar diffuser degradation in the ultraviolet range, with ongoing corrections being made. For example, he cited how the team is using the solar diffuser that is only exposed once a month to correct the observations of the solar diffuser that is exposed daily. He also discussed other anomalies, including striping around 10° scan angle, reduced accuracy in the 590–610 nm region and implementation of crosstalk correction to compensate for reduced accuracy of wavelength measurements in the ultraviolet (i.e., for wavelengths shorter than 340 nm).
SPEXone
Hasekamp reported that SPEXone is delivering quality radiometric and polarimetric data. The team has developed the Remote Sensing of Trace Gases and Aerosol Products (RemoTAP) algorithm, an advanced aerosol retrieval algorithm that determines the total atmospheric column of aerosols, aerosol size distribution information, energy absorbed by aerosols, and vertical extent of the aerosol layer. Hasekamp showed that observations demonstrate minimal bias in size distribution retrievals across low aerosol optical depth (AOD) environments and these observations have good agreement with observations from ground-based Sun photometers that are part of the Aerosol Robotic Network (AERONET). He added that future updates will address radiometric calibration discrepancies with OCI.
HARP2
Martins reported that HARP2 continues to perform well and is delivering polarization-sensitive observations of aerosols and clouds. He noted that plans include making continued geolocation and calibration refinements, as well as cross-calibration with OCI and SPEXone to harmonize all the PACE radiometric data products.
PACE Data Access and Website Resources
Several presentations outlined the tools and platforms available to make data from the PACE mission accessible to the broader scientific community.
Alicia Scott [GSFC/Science Applications International Corporation (SAIC)] described capabilities provided by the Ocean Biology Distributed Active Archive Center (OB.DAAC). The OB.DAAC stores and processes data from all PACE instruments using tools, such as Earthdata Search and earthaccess Python libraries that enable user-friendly data retrieval pipelines. Training resources and tutorials are available to streamline usage.
Carina Poulin [GSFC/Science Systems and Applications, Inc (SSAI)] provided an overview of the PACE Data Website, which serves as a central hub for accessing datasets, reprocessing information, and product tutorials. The V3 landing page provides details on calibration updates, validation results, and pathways for integrating PACE data into user workflows.
EarthCARE Mission Updates
Many of PACE’s science objectives dovetail with that of the Earth Clouds, Aerosols, and Radiation Explorer (EarthCARE), a joint venture by the European Space Agency (ESA) and Japan Aerospace Exploration Agency (JAXA). Hence, the PAC3 meeting included participation from the EarthCARE teams. The EarthCARE observatory has four advanced instruments: a high spectral resolution ATmospheric LIDar (ATLID), a doppler capable Cloud Profiling Radar (CPR), a Multi-Spectral Imager (MSI), and a Broad-Band Radiometer (BBR). The measurements from EarthCARE complement those of PACE and enable cross validation, enriching scientific knowledge of complex Earth system processes. The synergistic nature of these missions also means that validation activities for one are well suited to both. For example, the Plankton, Aerosol, Cloud, ocean Ecosystem Postlaunch Airborne eXperiment (PACE-PAX) field campaign (discussed later in this article) incorporated validation activities for EarthCARE, and EarthCARE funded campaigns have made observations during PACE overpasses.
Rob Koopman [ESA] outlined progress on EarthCARE, including preparation for validation activities as part of ESA and JAXA’s joint efforts. He reported that the mission’s ATLID lidar data products are in excellent alignment with airborne High Spectral Resolution Lidar (HSRL) datasets (flown during PACE-PAX). Koopman showed preliminary results from underflights with NASA aircraft that demonstrate high accuracy for cloud and aerosol retrieval, albeit with some calibration challenges that will require further refinement. He also said that several EarthCARE–PACE mutual validation campaigns are planned to ensure inter-mission consistency across critical science products.
PACE–PAX Sessions
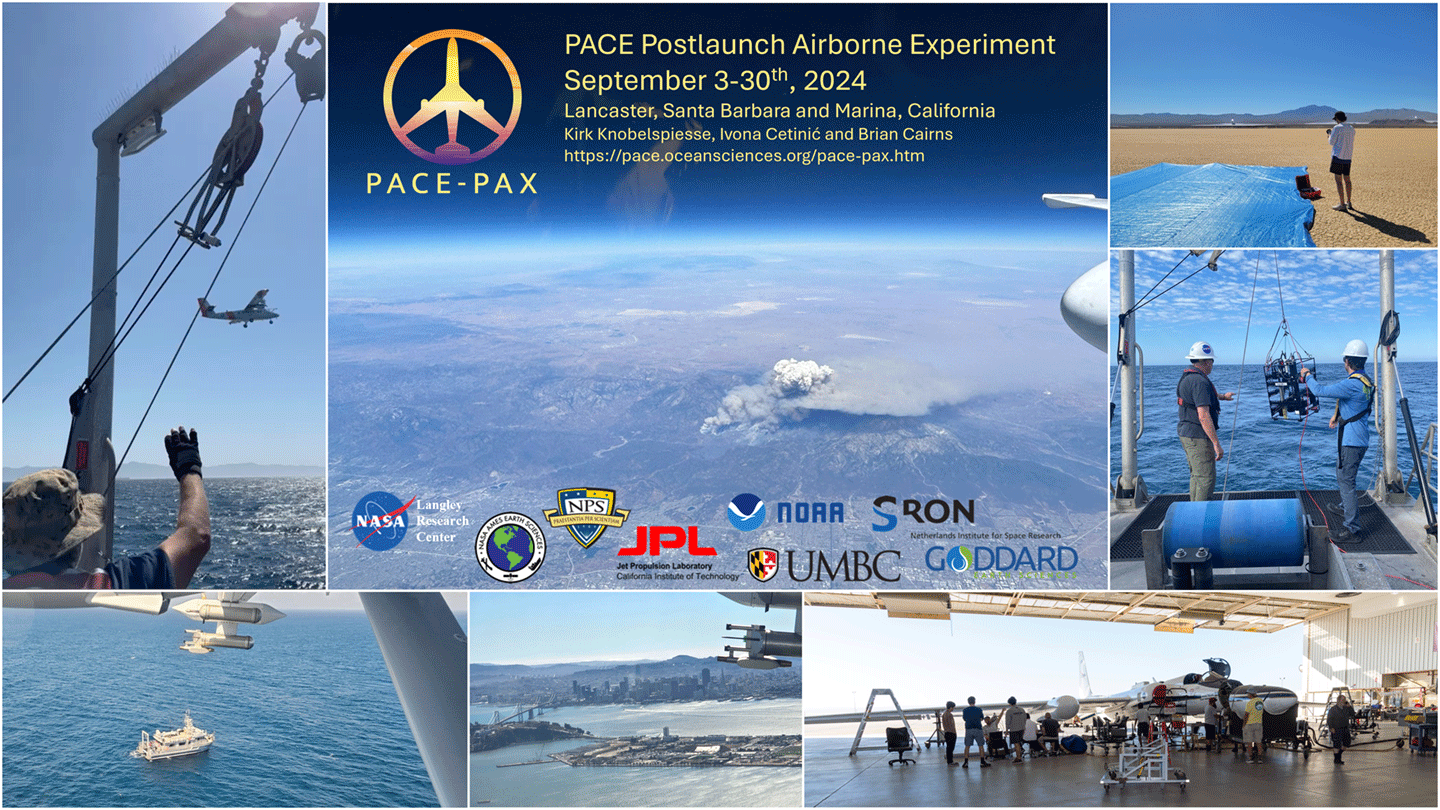
The first component of the PAC3 meeting focused on PACE–PAX, a field campaign conducted in California and adjacent coastal regions during Sept. 2024 – see Figure 1. Kirk Knobelspiesse [GSFC, OEL—PACE Polarimeter Lead, PACE-PAX Mission Scientist], Ivona Cetinić [NASA’s Goddard Space Flight Center (GSFC)/Morgan State University, Ocean Ecology Laboratory (OEL)—PACE Validation Science Team lead, PACE-PAX Deputy Mission Scientist], and Brian Cairns [NASA Goddard Institute for Space Studies (GISS)—PACE Deputy Project Scientist, PACE-PAX Deputy Mission Scientist] led the campaign, which, in addition to personnel from most NASA Centers, had participation from academia (e.g., University of Maryland, Baltimore County), other government agencies (e.g., Naval Postgraduate School and National Oceanic and Atmospheric Administration), and international space agencies (e.g., Space Research Organization, Netherlands).
Campaign Overview
The PACE–PAX mission supported the PACE Science Data Product Validation Plan. This included validation of new PACE and EarthCARE products, data collection during instrument overpasses, verification of radiometric and polarimetric measurements, and targeted investigation of region-specific phenomena (e.g., multilayer aerosols and phytoplankton blooms).
Operational Highlights
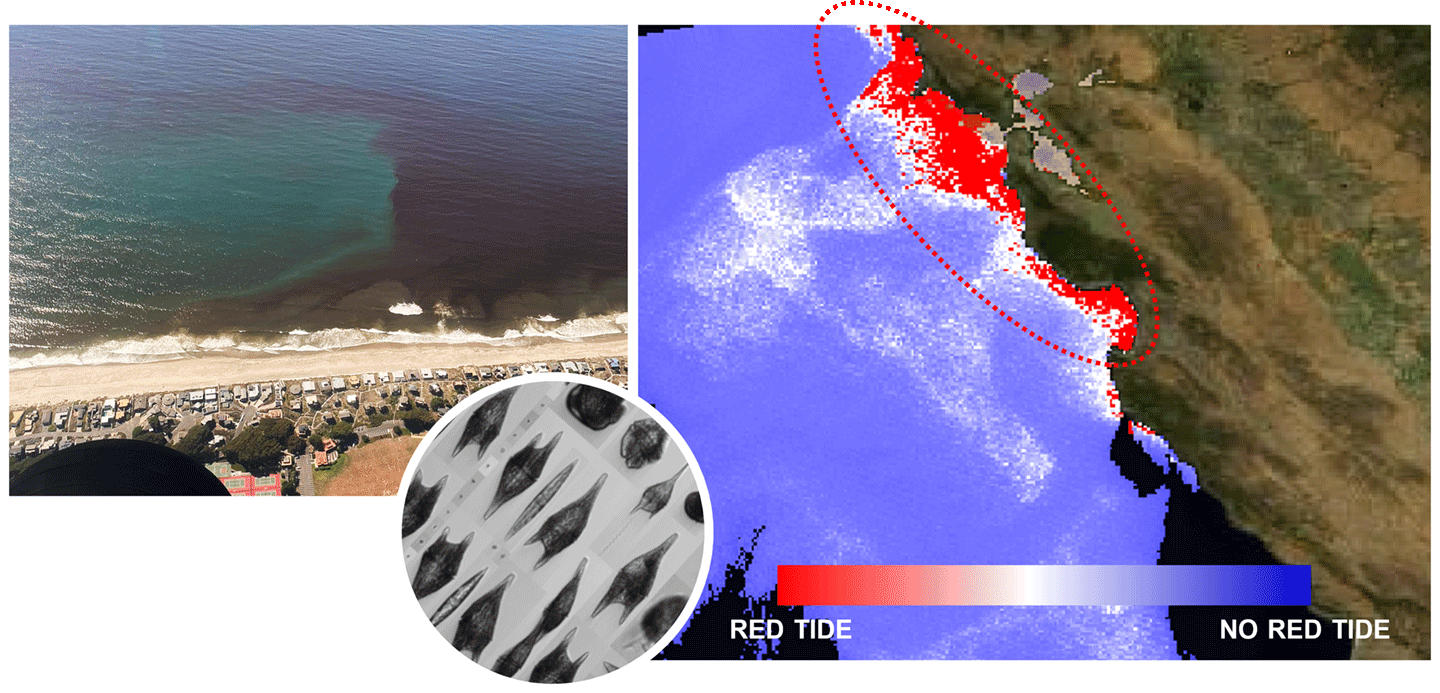
PACE–PAX used a diverse array of platforms to collect atmospheric and oceanic data, including aircraft [e.g., NASA Earth Resources-2 (ER-2) and the Naval Postgraduate School’s Center for Interdisciplinary Remotely Piloted Aircraft Studies (CIRPAS) Twin Otter], research vessels (NOAA’s R/V Shearwater and the 30-foot sailboat R/V Blissfully), and ground-based instruments such as Sun photometers and lidars. Key achievements include 13 ER-2 and 17 Twin Otter science flights, 15 RV Shearwater and 9 R/V Blissfully day cruises. These flights and ocean surveys supported 16 days of observations during a PACE overpass, six days of observations during an EarthCARE overpass, ground vicarious calibration at Ivanpah Playa, CA, numerous overflights of AERONET ground sites. Beyond validation, several unique events were observed that may be of interest for scientific purposes. Intense wildfires (e.g., the Bridge, Airport, and Line fires in 2024) were observed in Southern California in mid-September, while a red tide outbreak was observed later in the month along the Northern California coast – see Figure 2. Additionally, elements of the PVST coordinated their own validation efforts with the PACE–PAX campaign.
Preliminary Findings
Highlights of the PACE-PAX sessions demonstrated:
- validation of EarthCARE and PACE aerosol and cloud products using the HSRL2 on NASA ER-2,
- validation of PACE cloud products using polarimeters operating on the NASA ER-2 and in situ sensors on the CIRPAS Twin Otter,
- numerous successful matchups of hyperspectral data from OCI on PACE with field measurements of chlorophyll-a captured during ship campaigns, and
- observations of diverse phenomena (e.g., marine stratocumulus clouds and transported wildfire aerosols over clouds), which supported the testing of new retrieval algorithms.
The early results show the critical role that validation activities, such as PACE–PAX, play in creating a bridge between orbital science and ground truth.
PACE Science and Application Team (SAT3) Session
SAT3, with a focus on both science and applications, offered a compelling second component of the PAC3 meeting. The Earth Observer has previously reported on PACE applications, most recently in the 2023 article, Preparing for Launch and Assessing User Readiness: The 2023 PACE Applications Workshop [Nov–Dec 2023, 35:6, 25–32]. The SAT3 team convened during PAC3 to explore how PACE data could enhance research in diverse scientific fields and support applied uses for societal benefit. Dedicated sessions provided updates on ongoing NASA-funded projects to retrieve new geophysical variables, improve data assimilation, and refine product development pipelines.
SAT3 teams presented early results including studies that use PACE’s OCI to make pigment-specific absorption measurements, study diatom biomass retrieval, and gather chlorophyll concentration estimation. These studies emphasized new tools for tracking individual phytoplankton groups, such as diatoms and cyanobacteria that are vital for ecosystem research and understanding phytoplankton dynamics. Participants also showcased efforts to develop predictive models for the detection of harmful algal blooms (HABs) and improvement of early warning systems to mitigate public health impacts and economic consequences in both coastal regions and the Great Lakes. Several presentations highlighted new aerosol absorption and scattering measurements that are using polarimetry (i.e., SPEXone and HARP2) and how these findings are being incorporated into models of aerosol–cloud radiative forcing. Presenters also described how machine learning tools can integrate PACE measurements into Earth system models, through innovations in data assimilation, with promising results for global climate monitoring.
The SAT3 discussions highlighted PACE’s potential to impact disciplines ranging from oceanography to climate science.
PACE Validation Science Team Sessions
Sessions dedicated to the PACE PVST emphasized the ongoing role of PVST initiatives in confirming the reliability, accuracy, and long-term stability of PACE data products. Topics of focus for the PVST group included algorithm development and validation, cross-mission synergies, field-based campaign integration, and cloud products.
Some of the presenters shared updates on validation pipelines for radiometric and polarimetric products, with an emphasis on comparing against well-characterized datasets from AERONET Sun photometers, HSRL, and the Pan-and-Tilt Hyperspectral Radiometer (PANTHR) developed by Vlaams Instituut voor de Zee (VLIZ), or the Flanders Marine Institute, Belgium – see Photo 3. This radiometer was installed on a 30-m (~98-ft) tower in the Chesapeake Bay in May 2024 and is part of WATERHYPERNET network, which seeks to provide time series of hyperspectral water reflectance data from oceanic, coastal, and inland waters for the validation of satellite data at all wavelengths in the range 400–900 nm.
Reports from PVST members highlighted how data from PACE–PAX campaigns and satellite overpasses are contributing to the validation of error budgets developed prelaunch and refined uncertainty characterization. Other presentations highlighted the development of validation strategies for PACE-derived cloud properties, including cloud optical thickness, top height, and droplet size distributions with significant contributions from EarthCARE observations. Ocean observation validation was represented as well, with presentations from many groups that are focusing on retrieval of not only oceanic optical properties but biological components. This data offers crucial validation for the advanced phytoplankton composition and general ocean productivity products from PACE.
The PVST’s work continues to provide the foundation for confidence in PACE data products. Their accuracy ensures broad usability of those products across global science applications.
Conclusion
The PAC3 meeting, held at NASA’s GISS, highlighted the collective efforts of the PACE mission’s diverse teams to address a broad range of Earth system science challenges. By combining the meetings for PACE–PAX, SAT3, and PVST, participants were able to strengthen collaborations, align ongoing efforts, and lay the groundwork for future research and validation activities.
Roundtable discussions and team updates also revealed the critical role of PACE in addressing long-standing Earth system science questions, such as understanding the influence of aerosols on cloud formation and characterizing the impacts of oceanic changes on global biogeochemical cycles at a global scale. The meeting concluded with participants compiling action items for further exploration. Topics identified for future efforts included strategies for ensuring long-term data calibration, improving data delivery pipelines, and refining algorithm development processes.
This meeting was one of the last significant events hosted at GISS before the facility’s closure at the end of May 2025. The findings and outcomes from PAC3 continue to inform and inspire PACE mission science, further enhancing its importance in advancing our understanding of the Earth system.
Kirk Knobelspiesse
NASA’s Goddard Space Flight Center
kirk.d.knobelspiesse@nasa.gov
Cecile S. Rousseaux
NASA’s Goddard Space Flight Center
cecile.s.rousseaux@nasa.gov
Ivona Cetinić
NASA’s Goddard Space Flight Center/Morgan State University
ivona.cetinic@nasa.gov
Andrew Sayer
NASA’s Goddard Space Flight Center
andrew.sayer@nasa.gov
Share
Details
Related Terms
Powered by WPeMatico