NASA’s Hubble Identifies One of Darkest Known Galaxies

NASA’s Hubble Identifies One of Darkest Known Galaxies

3 min read

NASA’s Hubble Identifies One of Darkest Known Galaxies
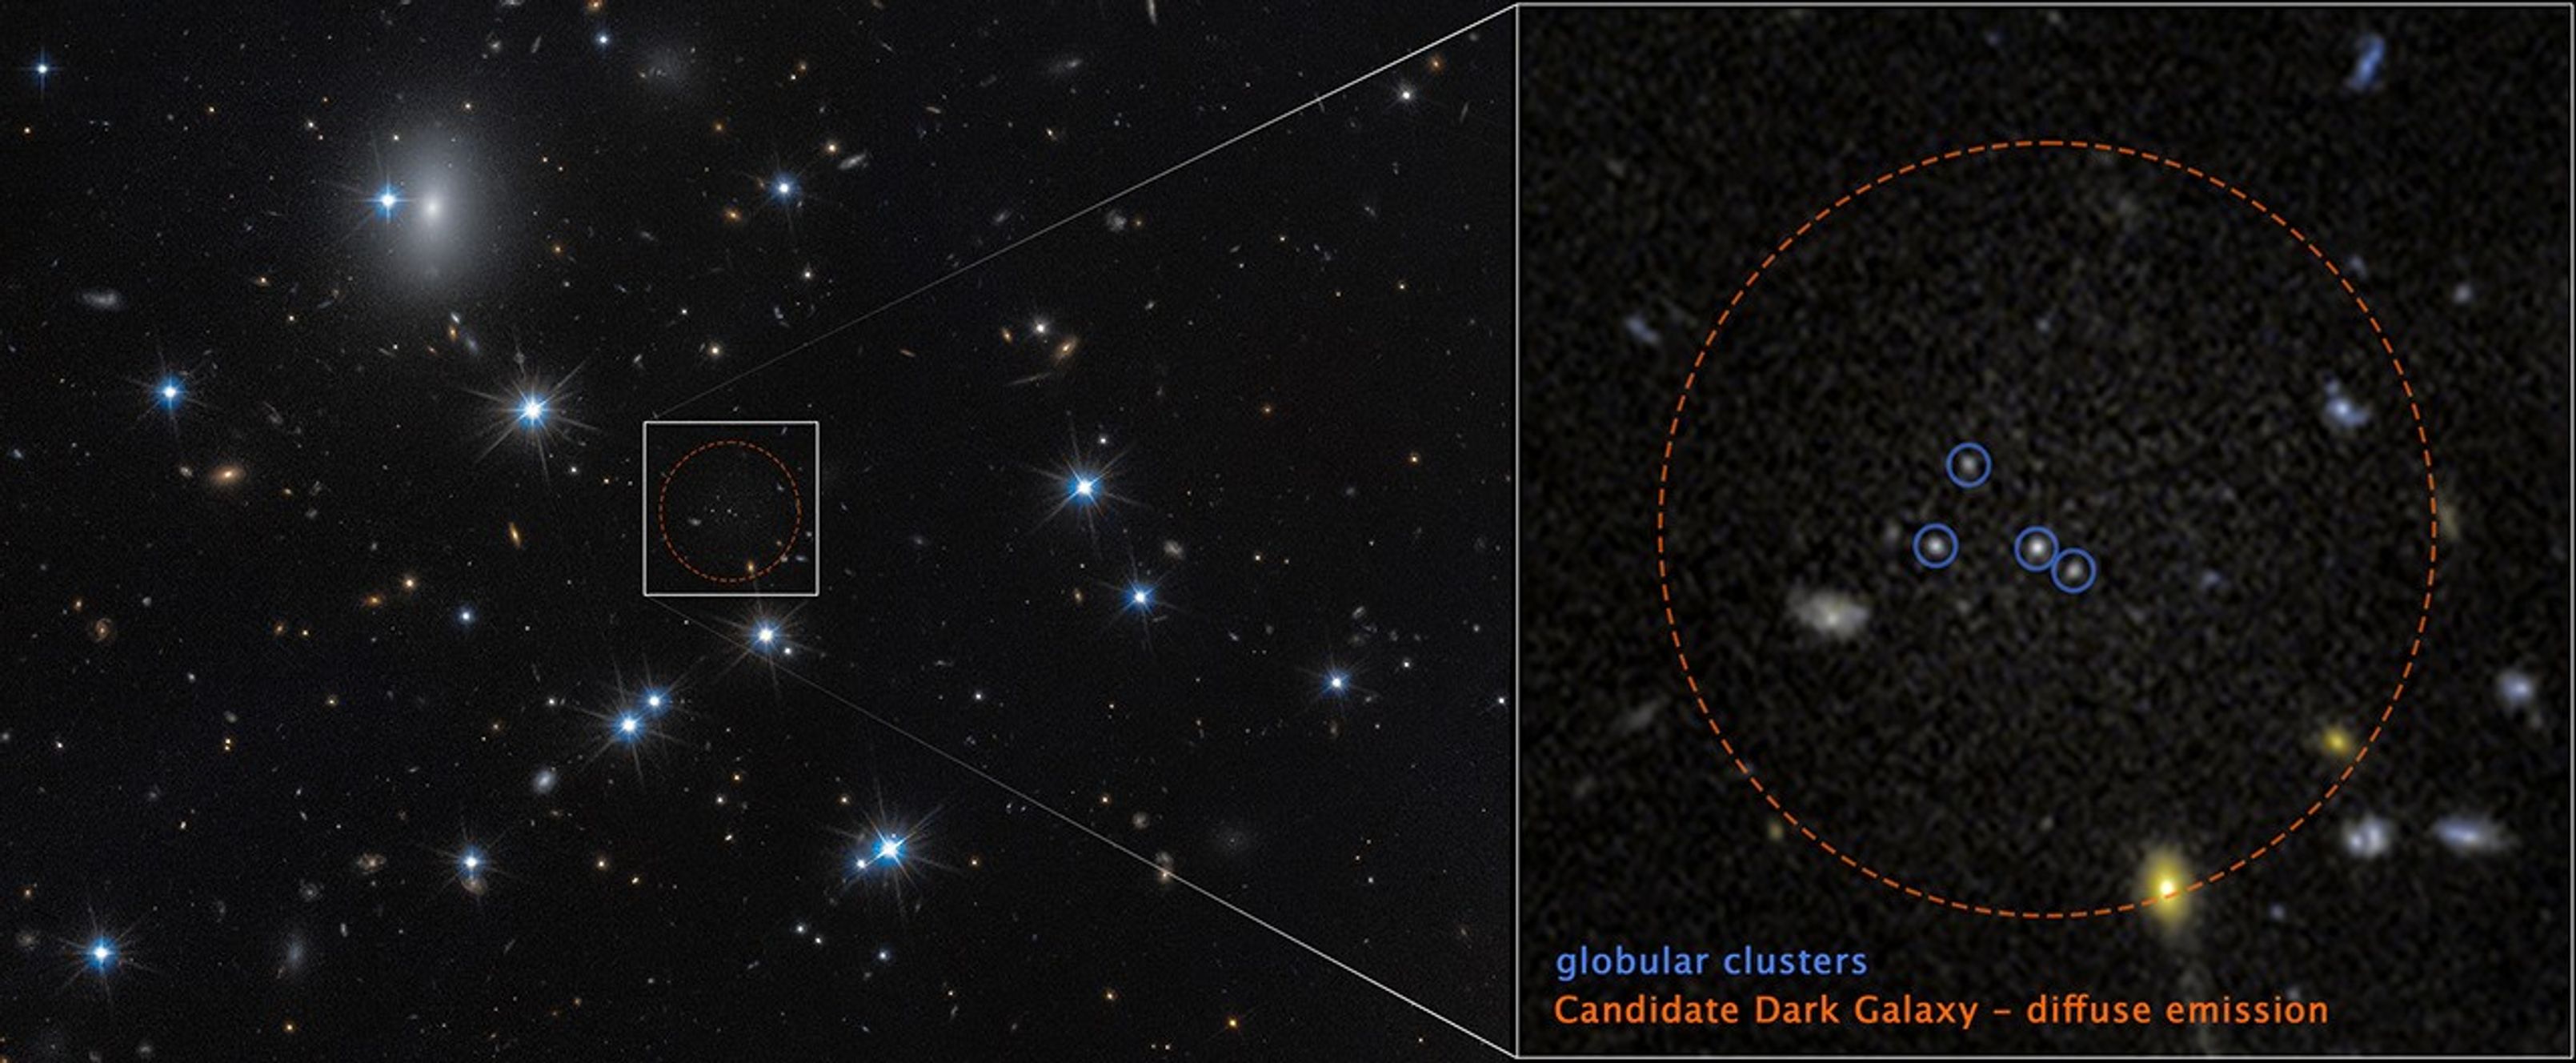
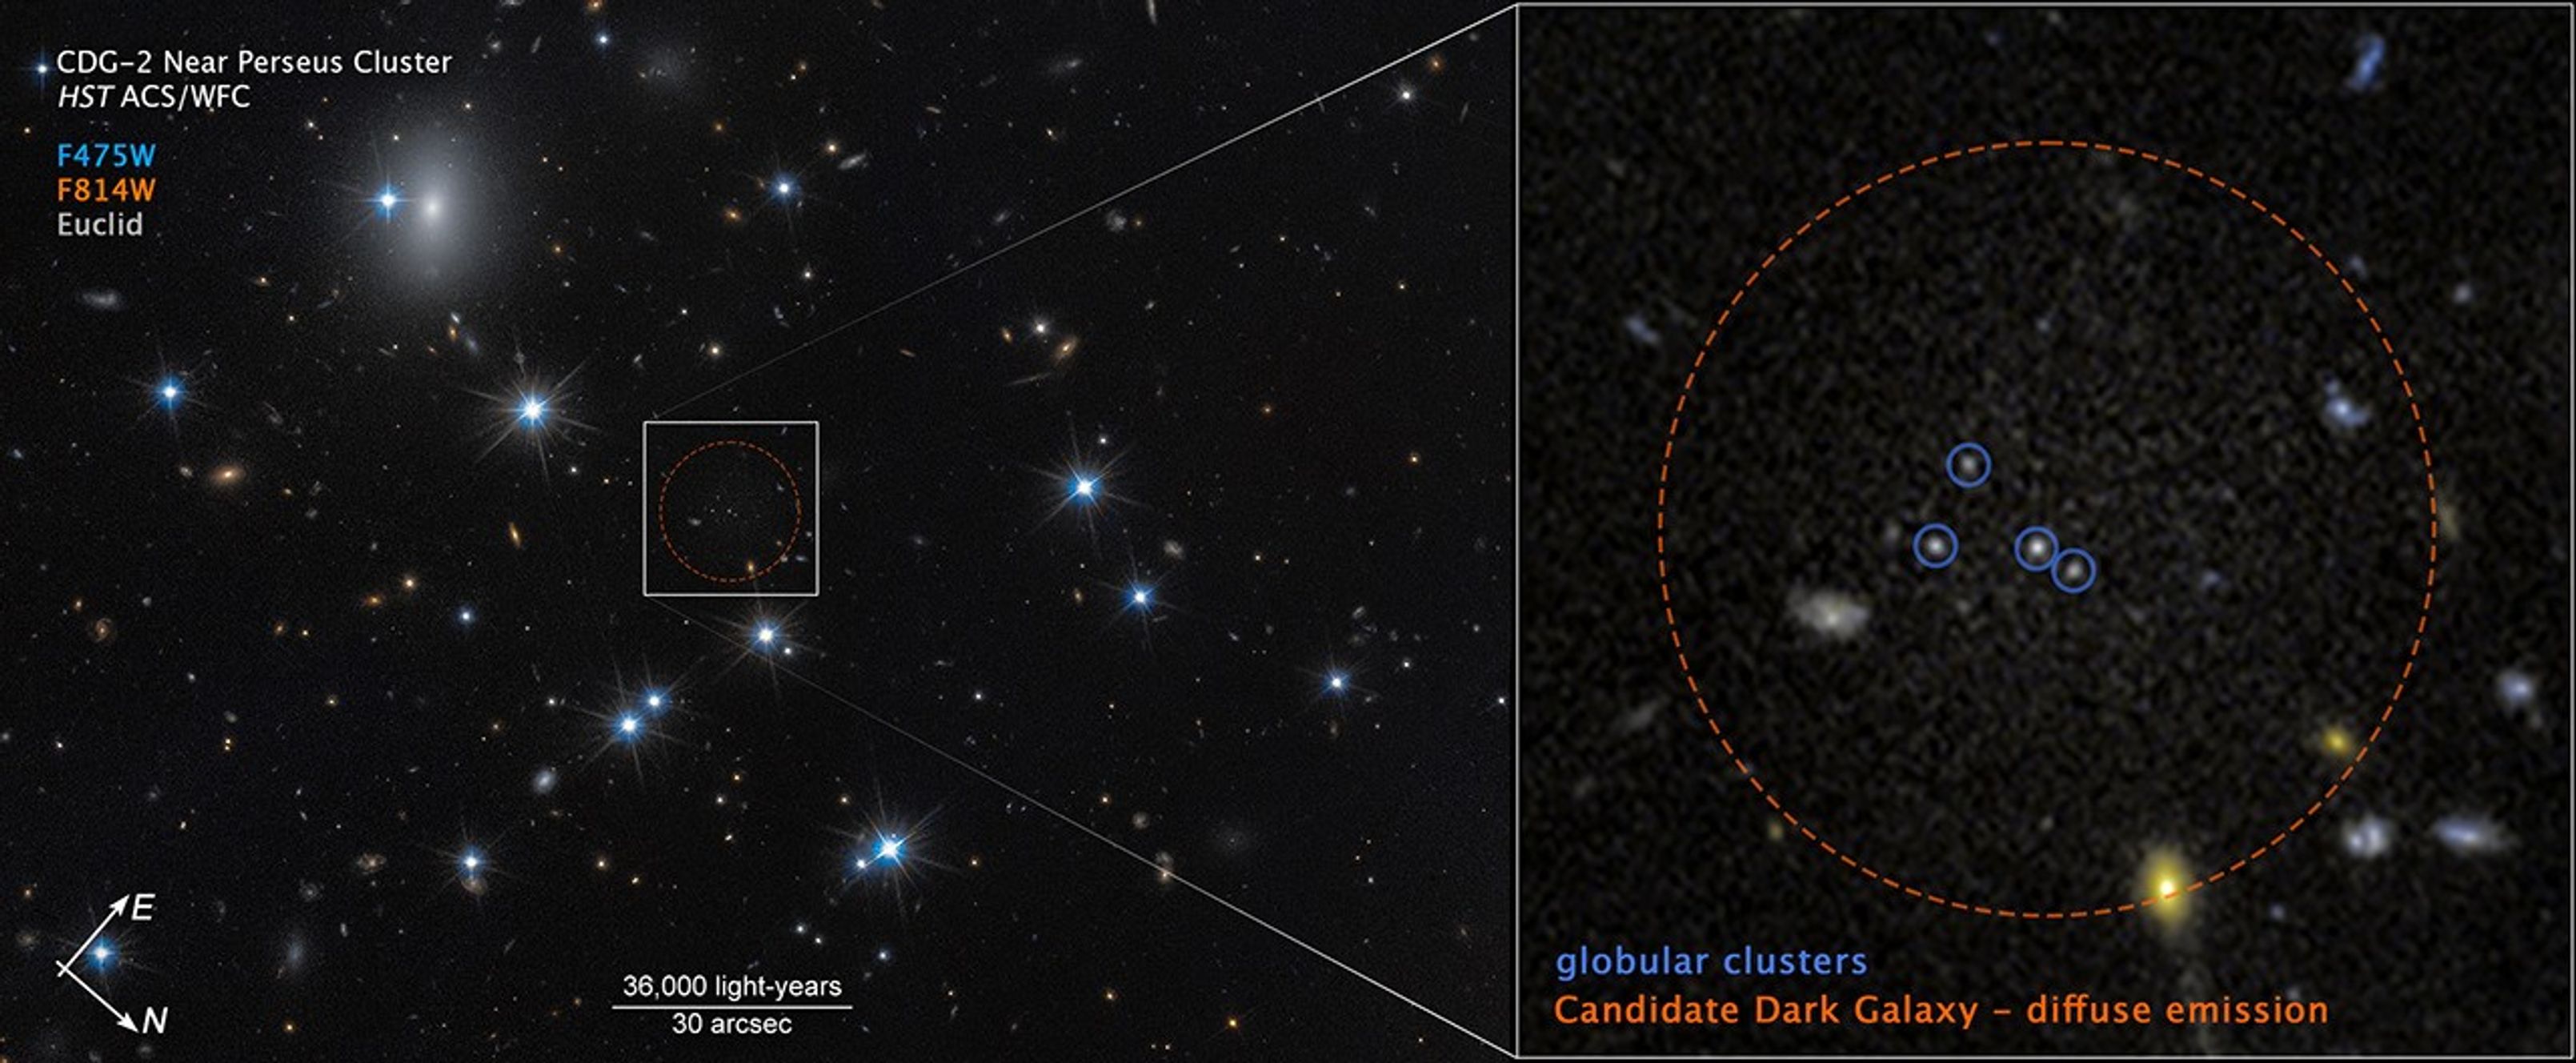
At left, a field of space with a dozen white foreground stars and a number of small, yellow background galaxies. An unremarkable area at center is outlined with a dashed red circle surrounded by a white box. Lines extend from the box to a pullout at right containing faint, grainy white light surrounded by a red circle labeled u201cCandidate dark galaxy u2013 diffuse emission.u201d Four white dots are circled in blue and labeled globular clusters.
The low-surface-brightness galaxy CDG-2, within the dashed red circle at right, is dominated by dark matter and contains only a sparse scattering of stars. The full image from NASA’s Hubble Space Telescope is at left.
NASA, ESA, Dayi Li (UToronto); Image Processing: Joseph DePasquale (STScI)

In the vast tapestry of the universe, most galaxies shine brightly across cosmic time and space. Yet a rare class of galaxies remains nearly invisible — low-surface-brightness galaxies dominated by dark matter and containing only a sparse scattering of faint stars.

One such elusive object, dubbed CDG-2, may be among the most heavily dark matter-dominated galaxies ever discovered. (Dark matter is an invisible form of matter that does not reflect, emit, or absorb light.) The science paper detailing this finding was published in The Astrophysical Journal Letters.

Detecting such faint galaxies is extraordinarily difficult. Using advanced statistical techniques, David Li of the University of Toronto, Canada, and his team identified 10 previously confirmed low-surface-brightness galaxies and two additional dark galaxy candidates by searching for tight groupings of globular clusters — compact, spherical star groups typically found orbiting normal galaxies. These clusters can signal the presence of a faint, hidden stellar population.

To confirm one of the dark galaxy candidates, astronomers employed a trio of observatories: NASA’s Hubble Space Telescope, ESA’s (European Space Agency) Euclid space observatory, and the ground-based Subaru Telescope in Hawaii. Hubble’s high-resolution imaging revealed a close collection of four globular clusters in the Perseus galaxy cluster, 300 million light-years away. Follow-up studies using Hubble, Euclid, and Subaru data then revealed a faint, diffuse glow surrounding the star clusters — strong evidence of an underlying galaxy.

“This is the first galaxy detected solely through its globular cluster population,” said Li. “Under conservative assumptions, the four clusters represent the entire globular cluster population of CDG-2.”

NASA’s Goddard Space Flight Center; Lead Producer: Paul Morris

Preliminary analysis suggests CDG-2 has the luminosity of roughly 6 million Sun-like stars, with the globular clusters accounting for 16% of its visible content. Remarkably, 99% of its mass, which includes both visible matter and dark matter, appears to be dark matter. Much of its normal matter to enable star formation — primarily hydrogen gas — was likely stripped away by gravitational interactions with other galaxies inside the Perseus cluster.

Globular clusters possess immense stellar density and are gravitationally tightly bound. This makes the clusters more resistant to gravitational tidal disruption, and therefore reliable tracers of such ghostly galaxies.

As sky surveys expand with missions like Euclid, NASA’s upcoming Nancy Grace Roman Space Telescope, and the Vera C. Rubin Observatory, astronomers are increasingly turning to machine learning and statistical methods to sift through vast datasets.

The Hubble Space Telescope has been operating for more than three decades and continues to make ground-breaking discoveries that shape our fundamental understanding of the universe. Hubble is a project of international cooperation between NASA and ESA (European Space Agency). NASA’s Goddard Space Flight Center in Greenbelt, Maryland, manages the telescope and mission operations. Lockheed Martin Space, based in Denver, also supports mission operations at Goddard. The Space Telescope Science Institute in Baltimore, which is operated by the Association of Universities for Research in Astronomy, conducts Hubble science operations for NASA.

Share

Details

Last Updated
Feb 18, 2026
Editor
Andrea Gianopoulos
Contact
Media

Claire Andreoli
NASA’s Goddard Space Flight Center
Greenbelt, Maryland
claire.andreoli@nasa.gov

Christine Pulliam
Space Telescope Science Institute
Baltimore, Maryland

Powered by WPeMatico

Get The Details…

A Second Cyclone Slams Madagascar

A Second Cyclone Slams Madagascar

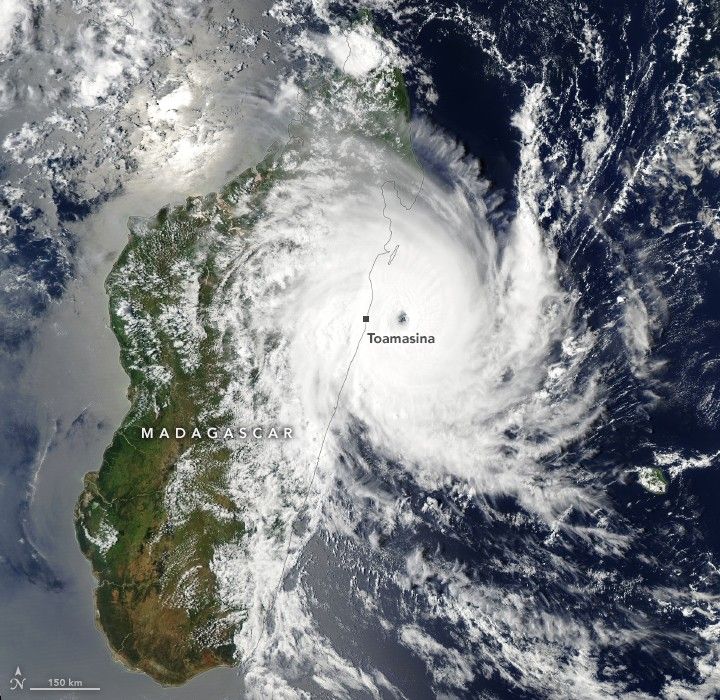
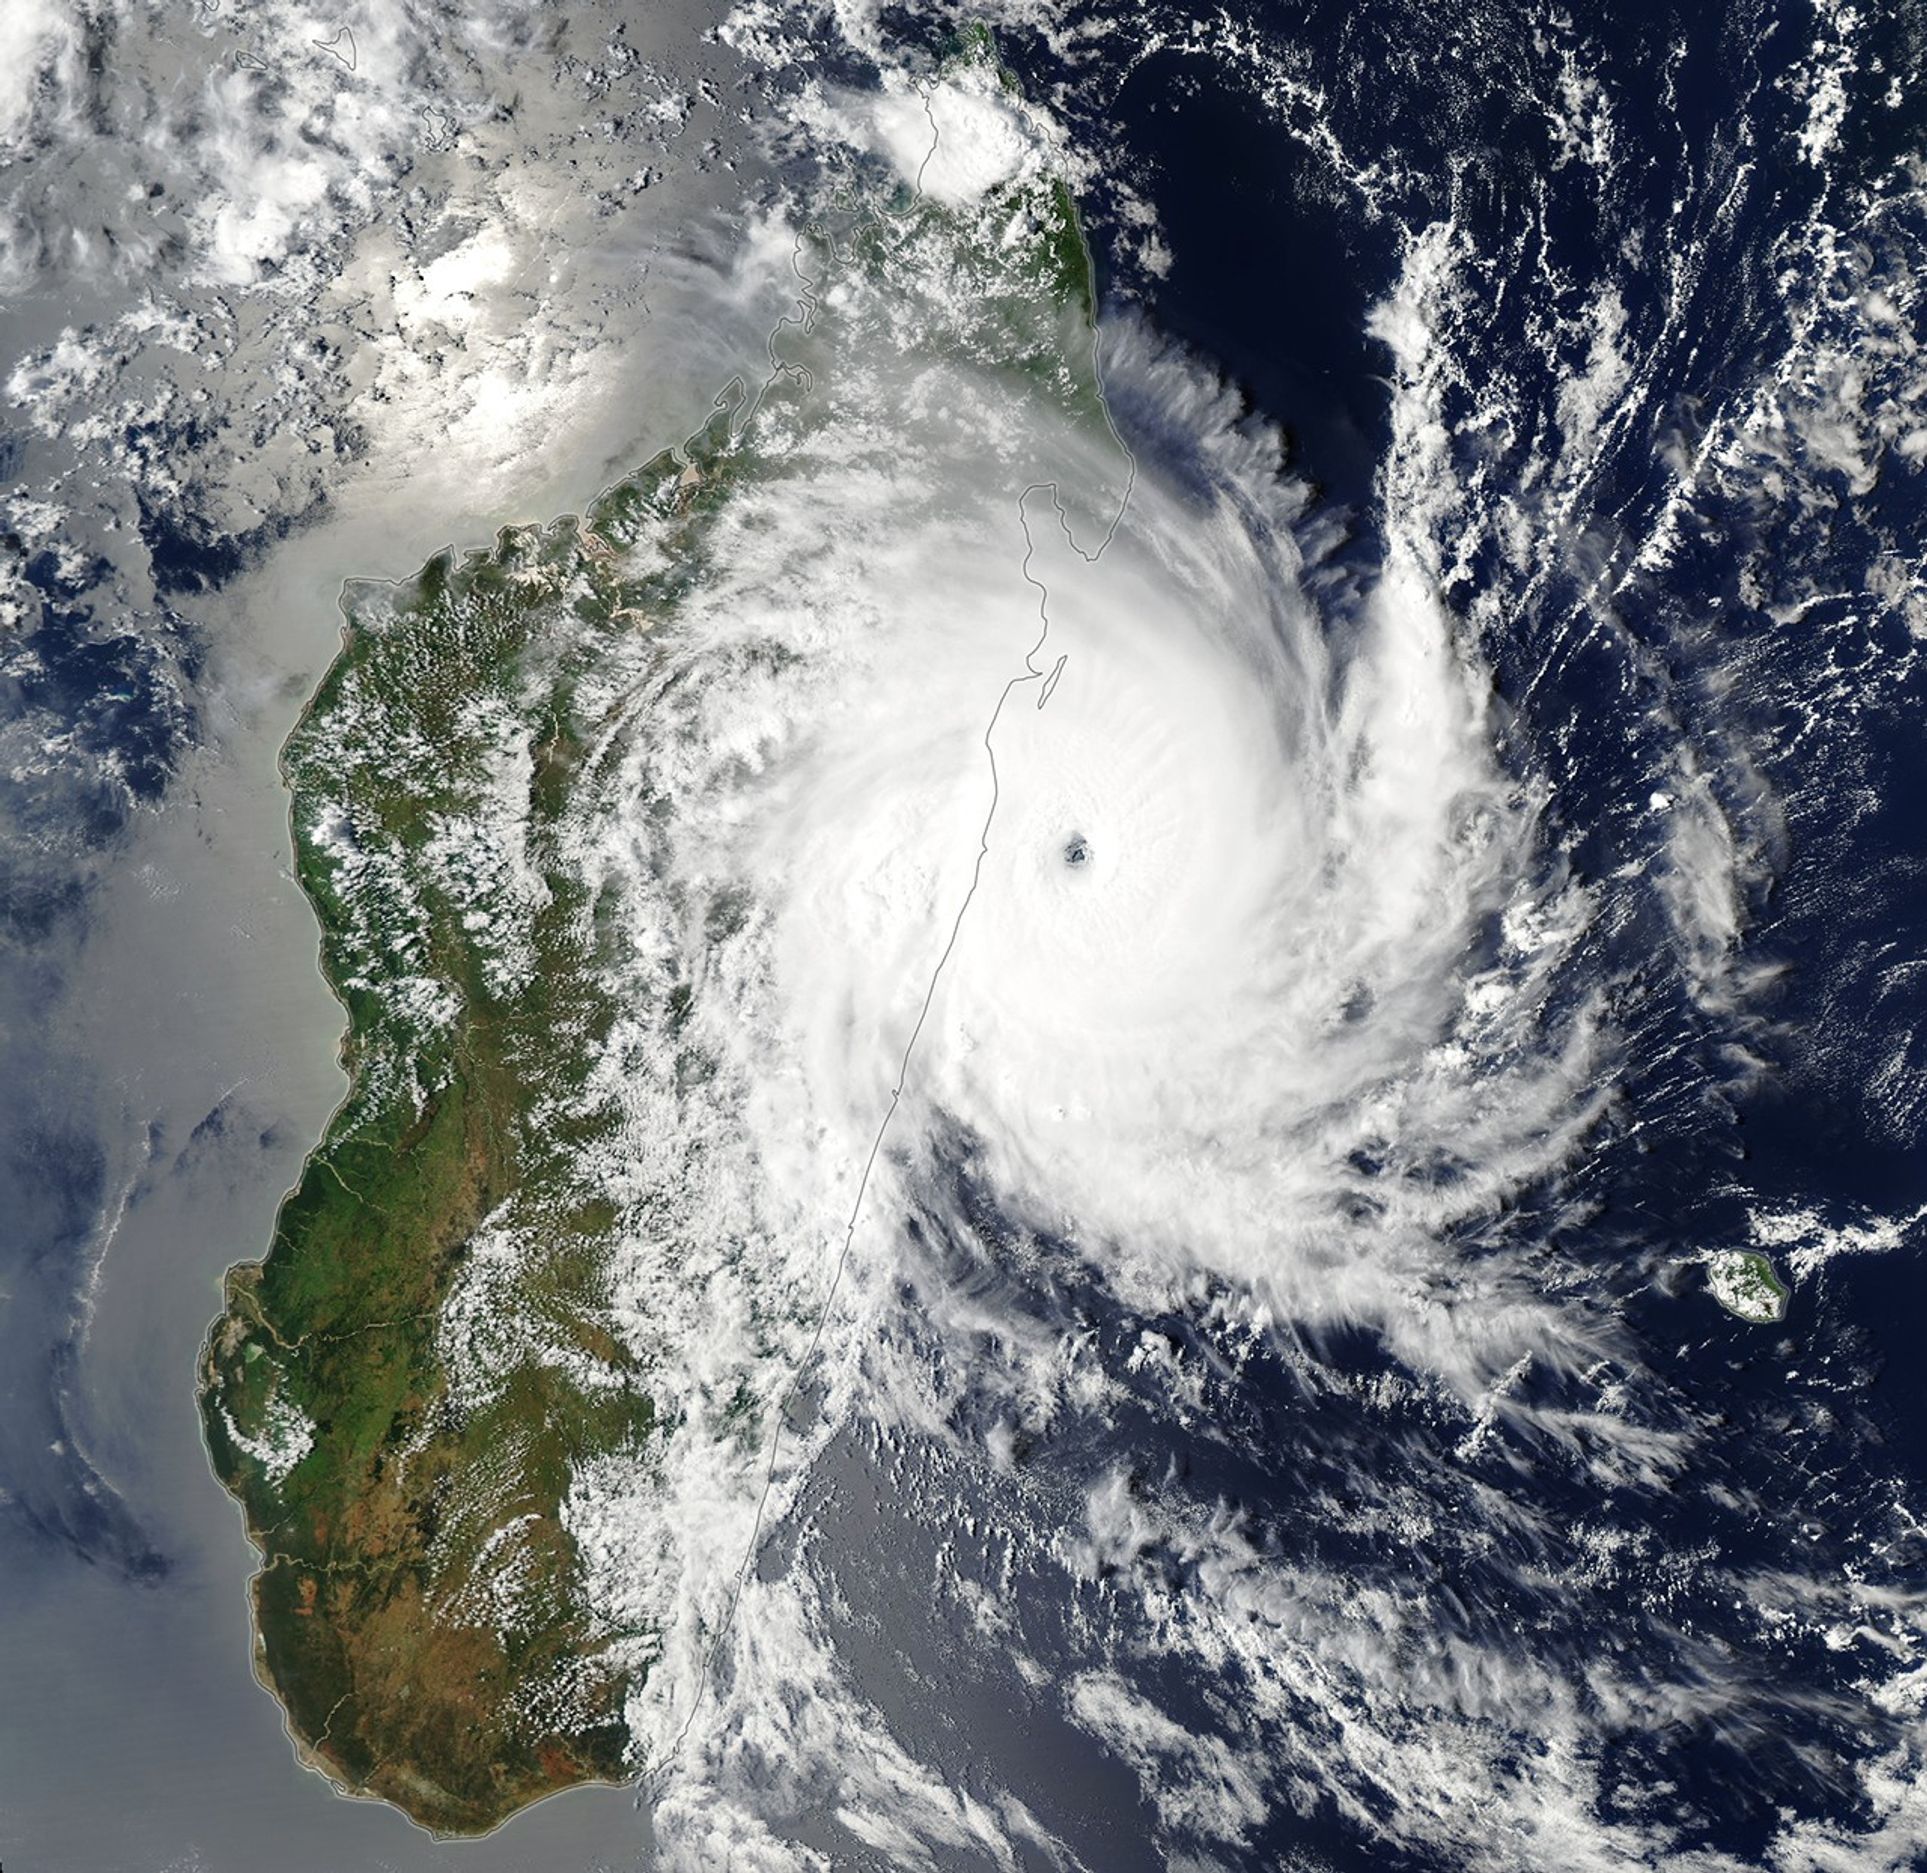
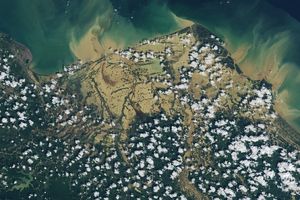
Storm clouds swirl over northwestern Madagascar in a satellite image acquired on February 10, 2026. The eye of tropical cyclone Gezani is visible directly east of Toamasina as the storm approaches land.
February 10, 2026

For the second time in two weeks, a powerful tropical cyclone struck Madagascar. On January 31, Fytia battered the remote northwestern coast of the island with destructive winds and torrential rains that displaced thousands of people. Less than two weeks later, Gezani made a direct hit on one of the island’s largest cities before sweeping past areas that Fytia had just flooded.

The MODIS (Moderate Resolution Imaging Spectroradiometer) on NASA’s Aqua satellite captured this image of Gezani as it neared Madagascar on February 10, 2026. At the time, the storm was undergoing rapid intensification. Its sustained winds peaked at 200 kilometers (125 miles) per hour before making landfall at Category 3 hurricane strength.

According to meteorologists with the Joint Typhoon Warning Center, the storm developed amid conditions “highly favorable” to strengthening, including sea surface temperatures above 28 degrees Celsius (82 degrees Fahrenheit), wind shear below 20 kilometers (12 miles) per hour, and an unusually moist atmosphere. As the storm passed near Toamasina, Madagascar’s second-largest city, satellites that contribute to NASA’s IMERG (Integrated Multi-satellite Retrievals for GPM) product measured rain rates up to 4 centimeters (1.6 inches) per hour.

The deluge caused widespread flooding in Toamasina and several other parts of the island. Preliminary damage assessments from Madagascar’s National Office for Risk and Disaster Management linked the storm to dozens of deaths, hundreds of injuries, and damage to more than 27,000 homes. Reports from news outlets and humanitarian groups described chaotic conditions in Toamasina, with widespread power outages, numerous collapsed roofs, and a lack of clean water.


January 29, 2026
February 14, 2026

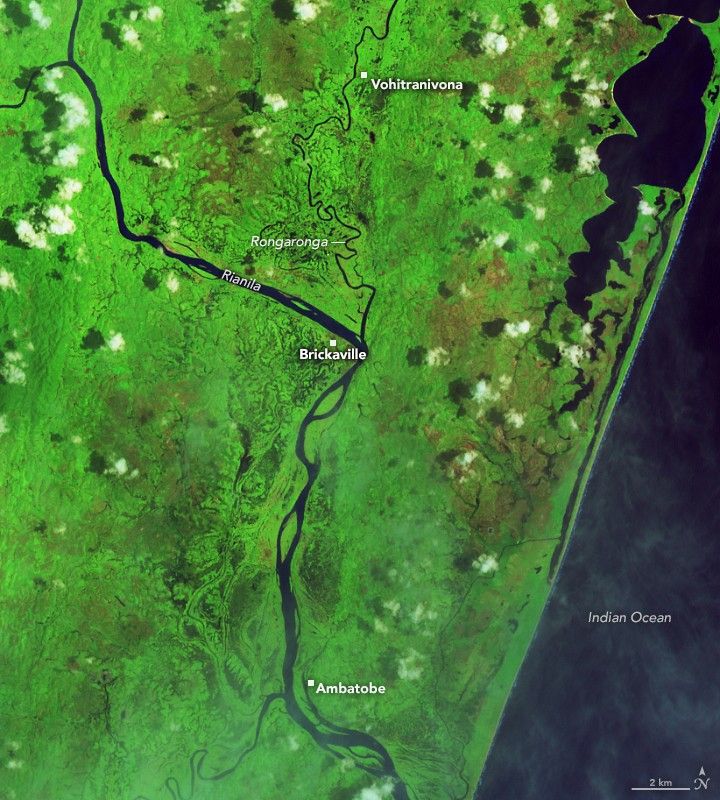
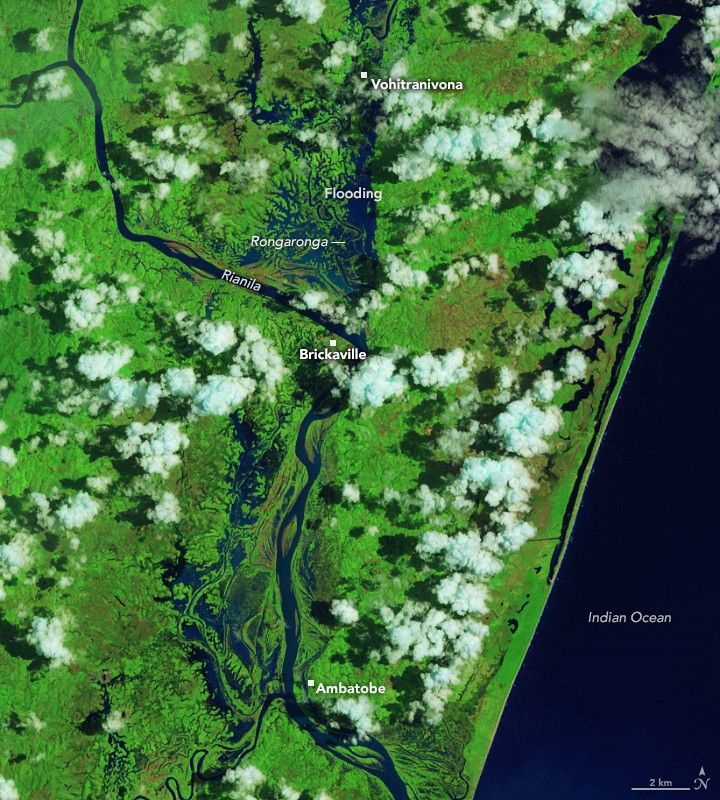
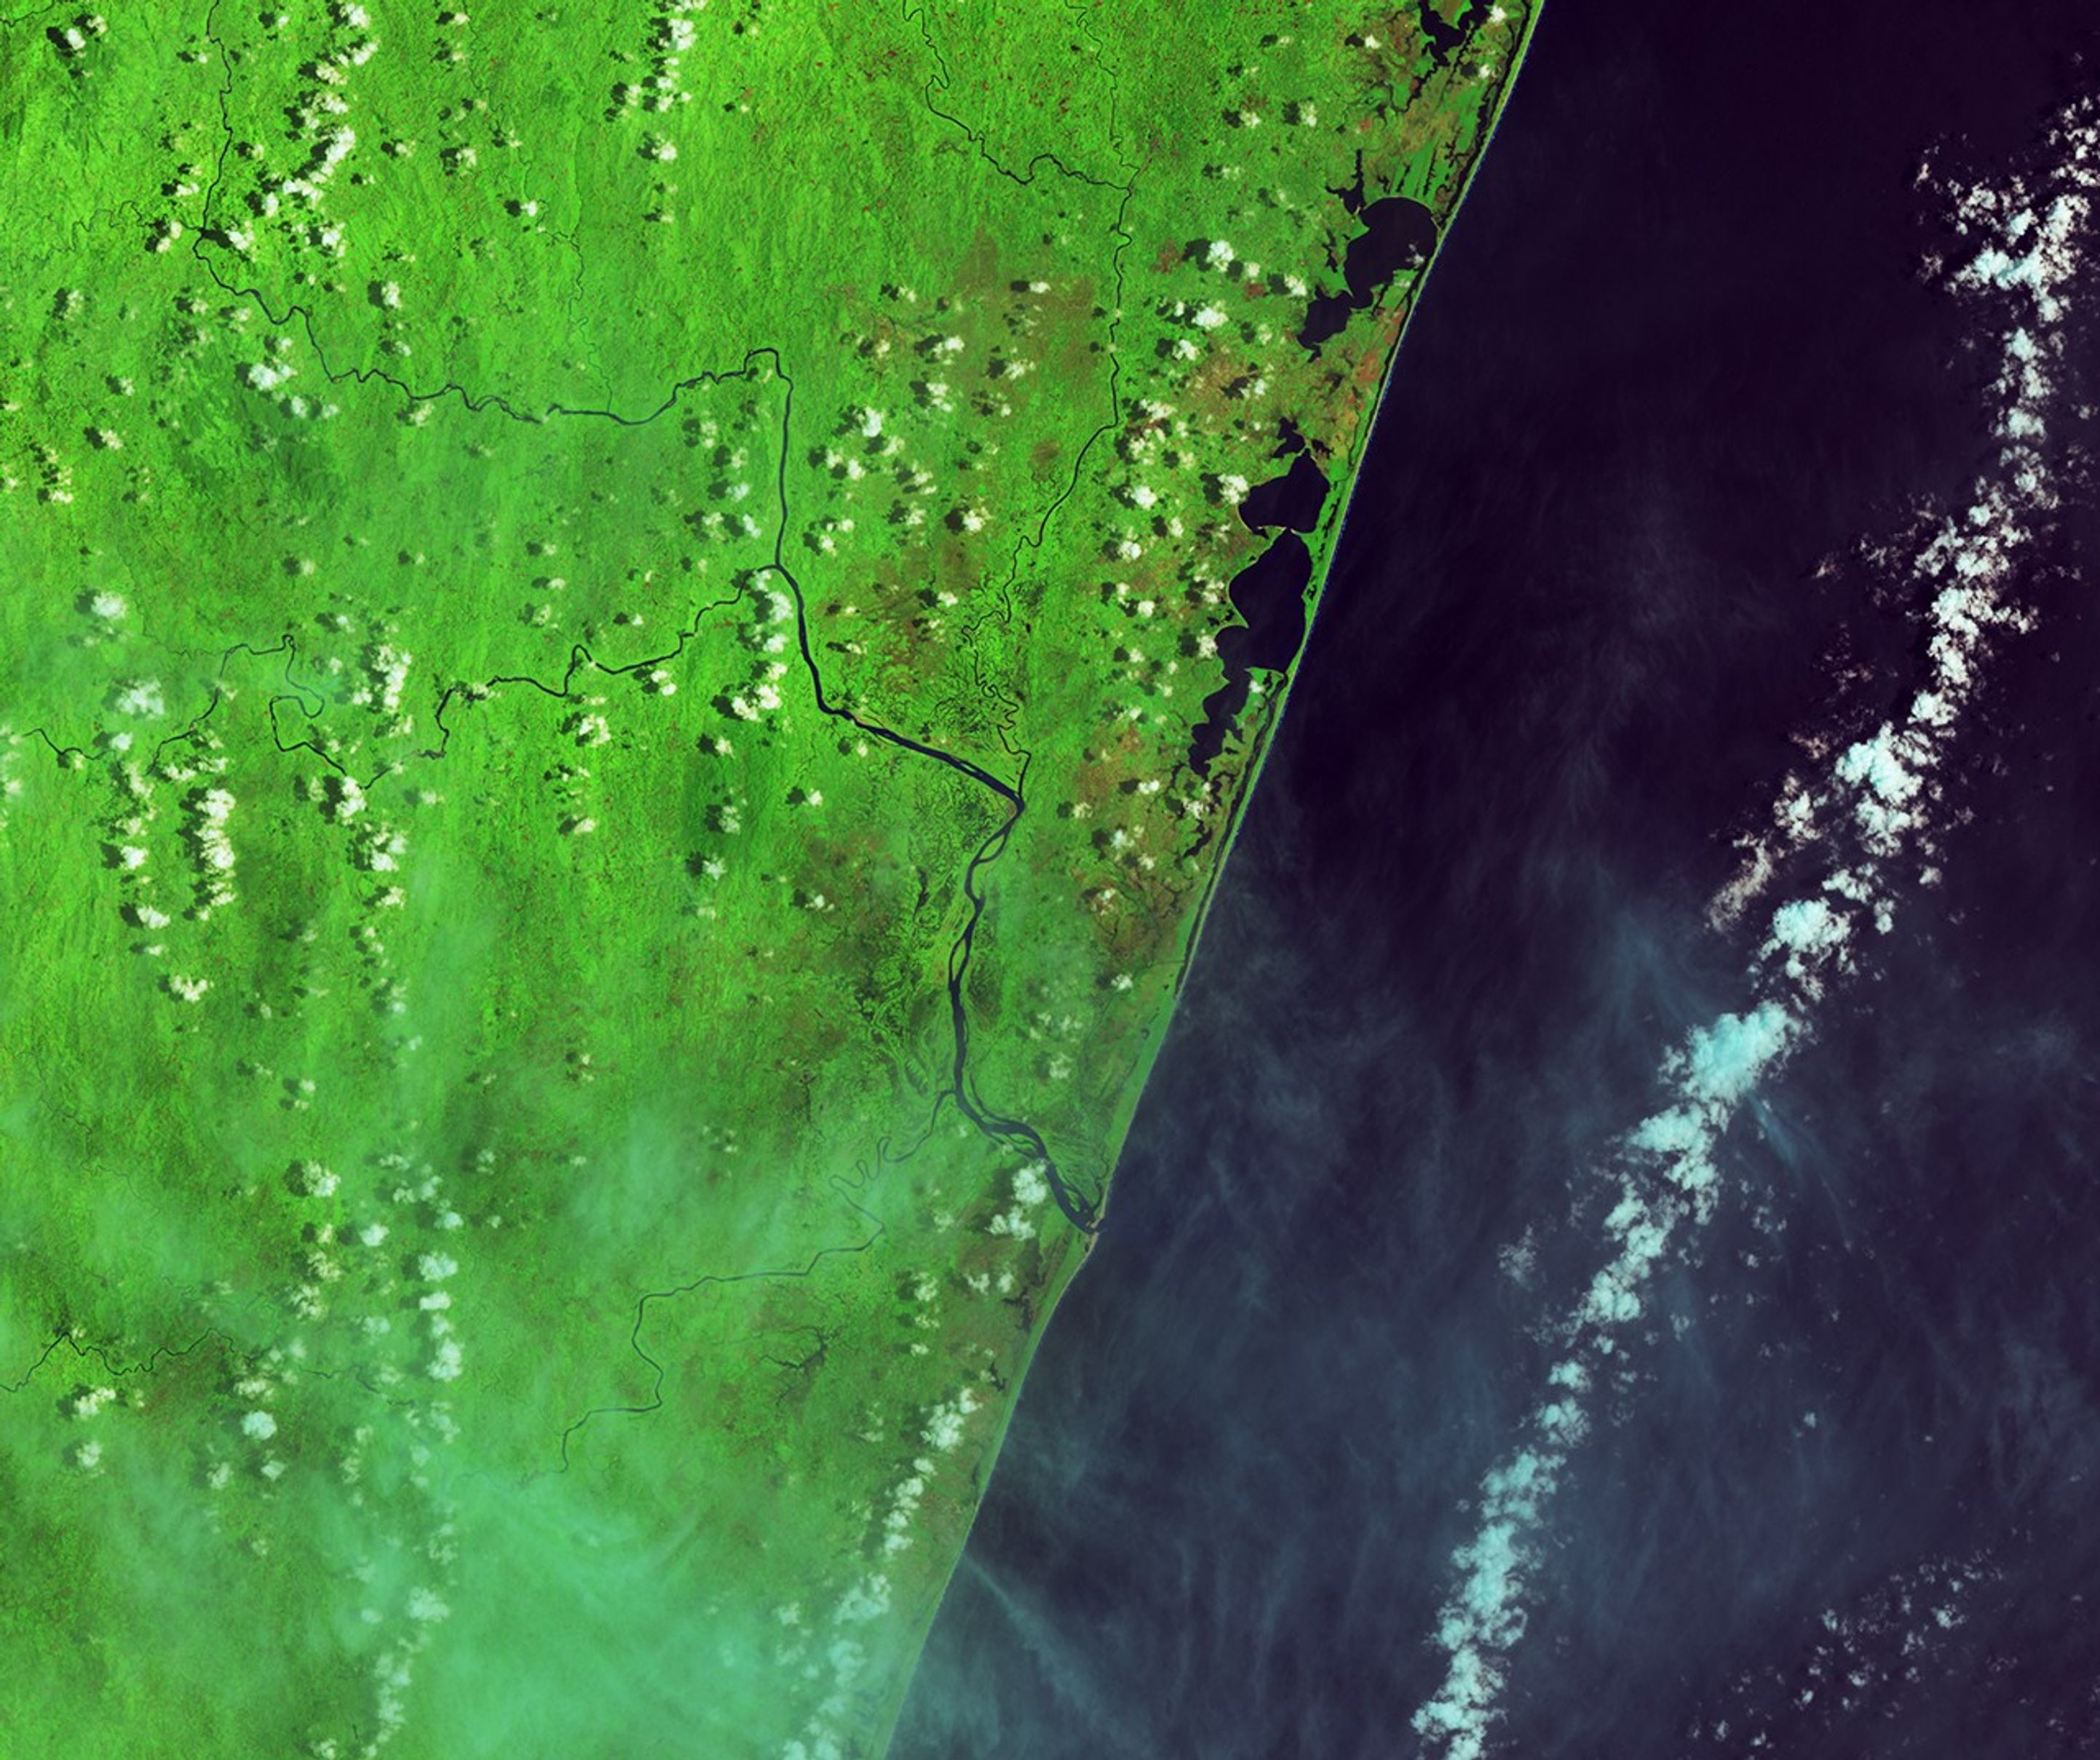
In this false-color image acquired before the flooding, the Rianila and Rongaronga rivers merge near the town of Brickaville. River water appears dark blue against a bright green background of farmland and savanna forest.
NASA Earth Observatory / Lauren Dauphin

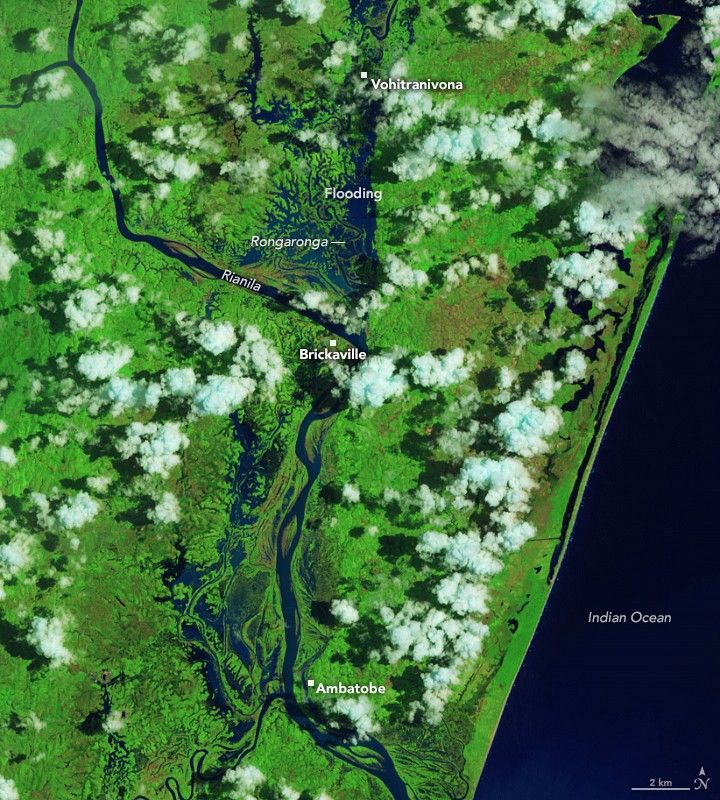
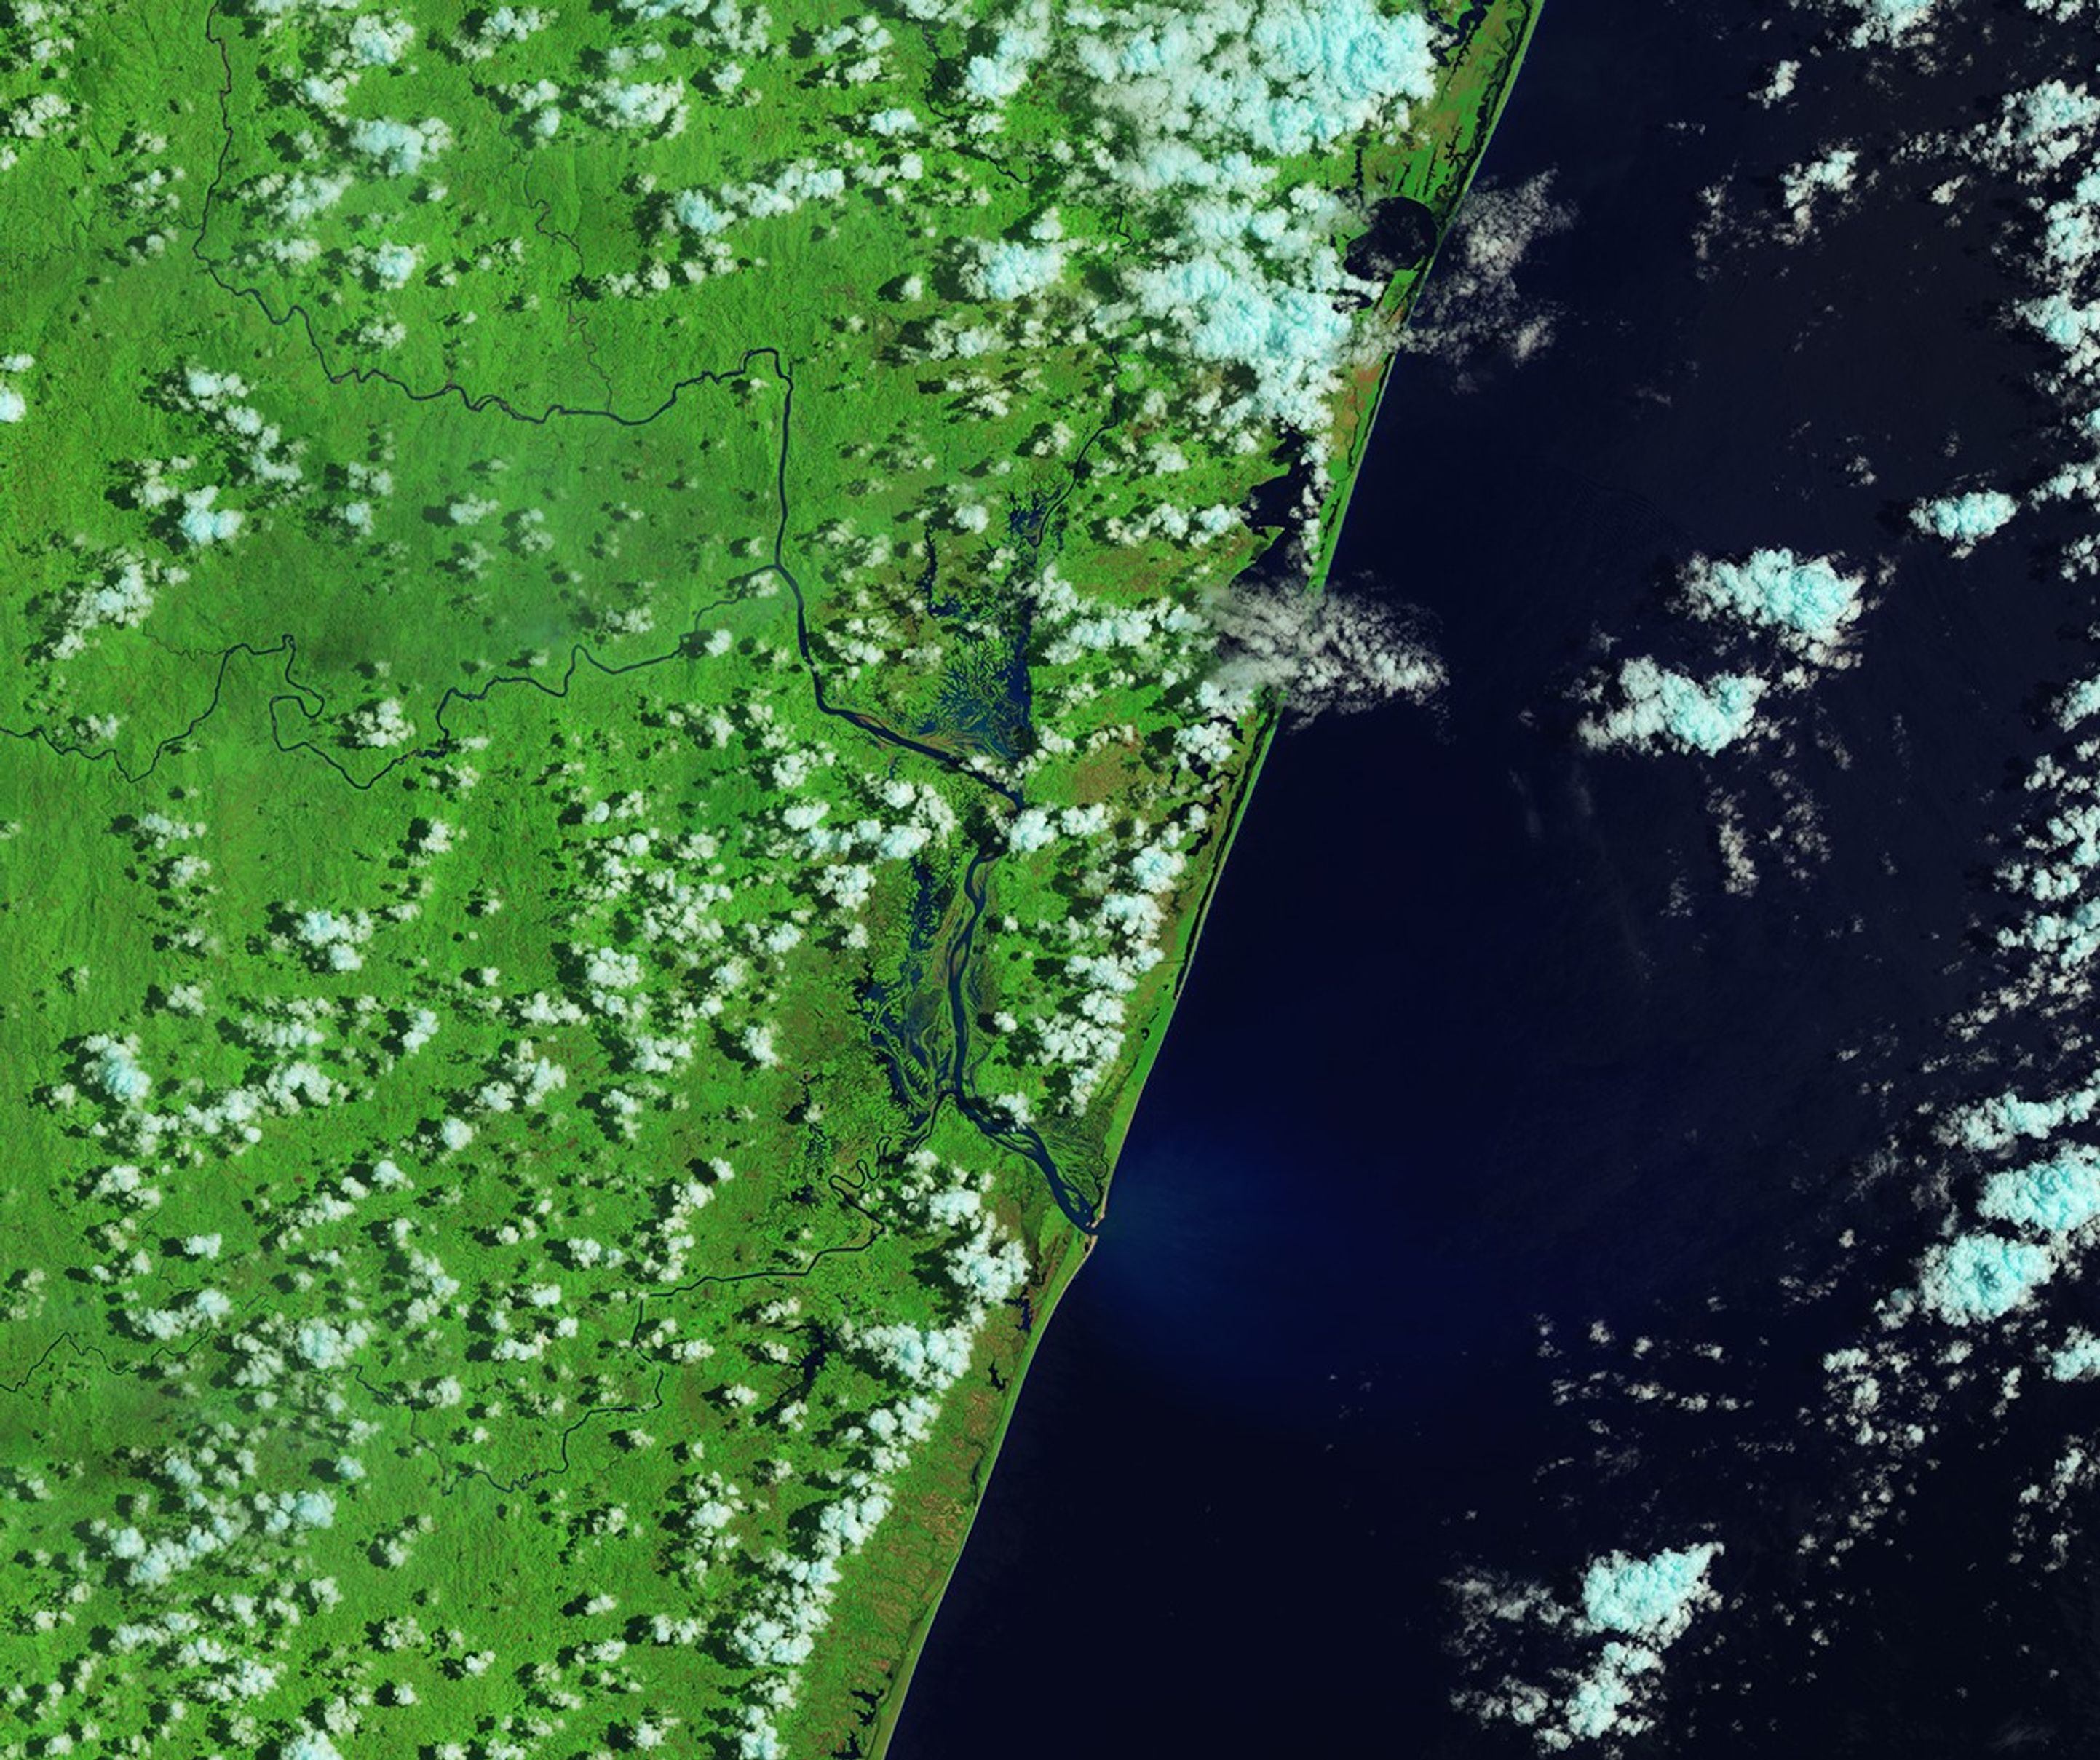
In a false-color image acquired after the flooding, waterways appear much wider, and floodwater covers large portions of the landscape west of the two rivers, both north and south of Brickaville.
NASA Earth Observatory / Lauren Dauphin

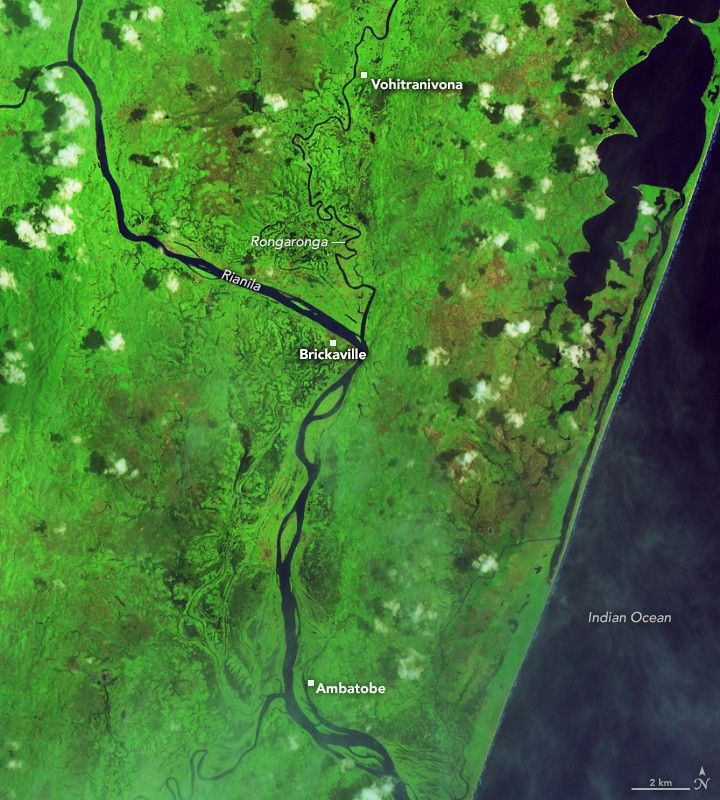
In this false-color image acquired before the flooding, the Rianila and Rongaronga rivers merge near the town of Brickaville. River water appears dark blue against a bright green background of farmland and savanna forest.
NASA Earth Observatory / Lauren Dauphin
In a false-color image acquired after the flooding, waterways appear much wider, and floodwater covers large portions of the landscape west of the two rivers, both north and south of Brickaville.
NASA Earth Observatory / Lauren Dauphin

January 29, 2026

February 14, 2026

Before and After

January 29, 2026 – February 14, 2026


The OLI (Operational Land Imager) on Landsat 8 captured this false-color image of severe flooding near Brickaville, just south of Toamasina, on February 14, 2026 (right). For comparison, the left image shows the same area before the storm. Villages and farmland along the Rongaronga River appear particularly hard hit. Crops commonly grown in this area include rice, vanilla, lychees, black pepper, cloves, and cinnamon, according to researchers from the French Agricultural Research Centre for International Development.

Madagascar is one of the most cyclone-prone countries in Africa, with about six storms typically affecting the island each year and two making direct landfall. The cyclone season generally runs from November through April, with peak activity between January and March.

NASA Earth Observatory image by Lauren Dauphin, using MODIS data from NASA EOSDIS LANCE and GIBS/Worldview and Landsat data from the U.S. Geological Survey. Story by Adam Voiland.

References & Resources

You may also be interested in:

Stay up-to-date with the latest content from NASA as we explore the universe and discover more about our home planet.

Senyar Swamps Sumatra

3 min read

A rare tropical cyclone dropped torrential rains on the Indonesian island, fueling extensive and destructive floods.

Article

Ragasa Steers Toward China

3 min read

The super typhoon headed for Guangdong province after lashing Taiwan and northern Luzon in the Philippines.

Article

Imelda and Humberto Crowd the Atlantic

3 min read

The tropical cyclones are close enough in proximity that they may influence one another.

Article

Powered by WPeMatico

Get The Details…

Curiosity Blog Sols 4804-4811: Kicking Off the Final Phase of Boxwork Exploration

Curiosity Blog Sols 4804-4811: Kicking Off the Final Phase of Boxwork Exploration

3 min read

Curiosity Blog Sols 4804-4811: Kicking Off the Final Phase of Boxwork Exploration

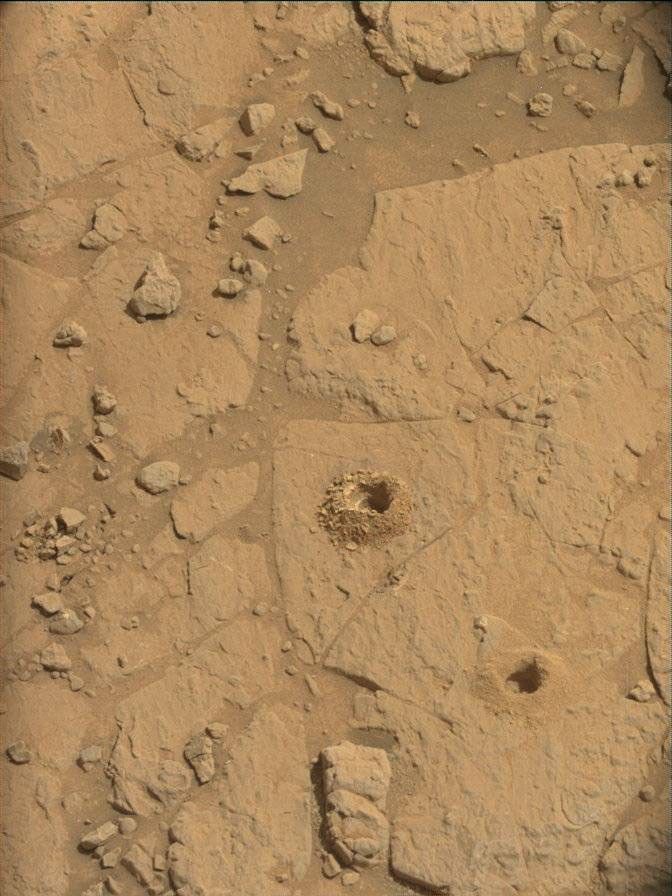
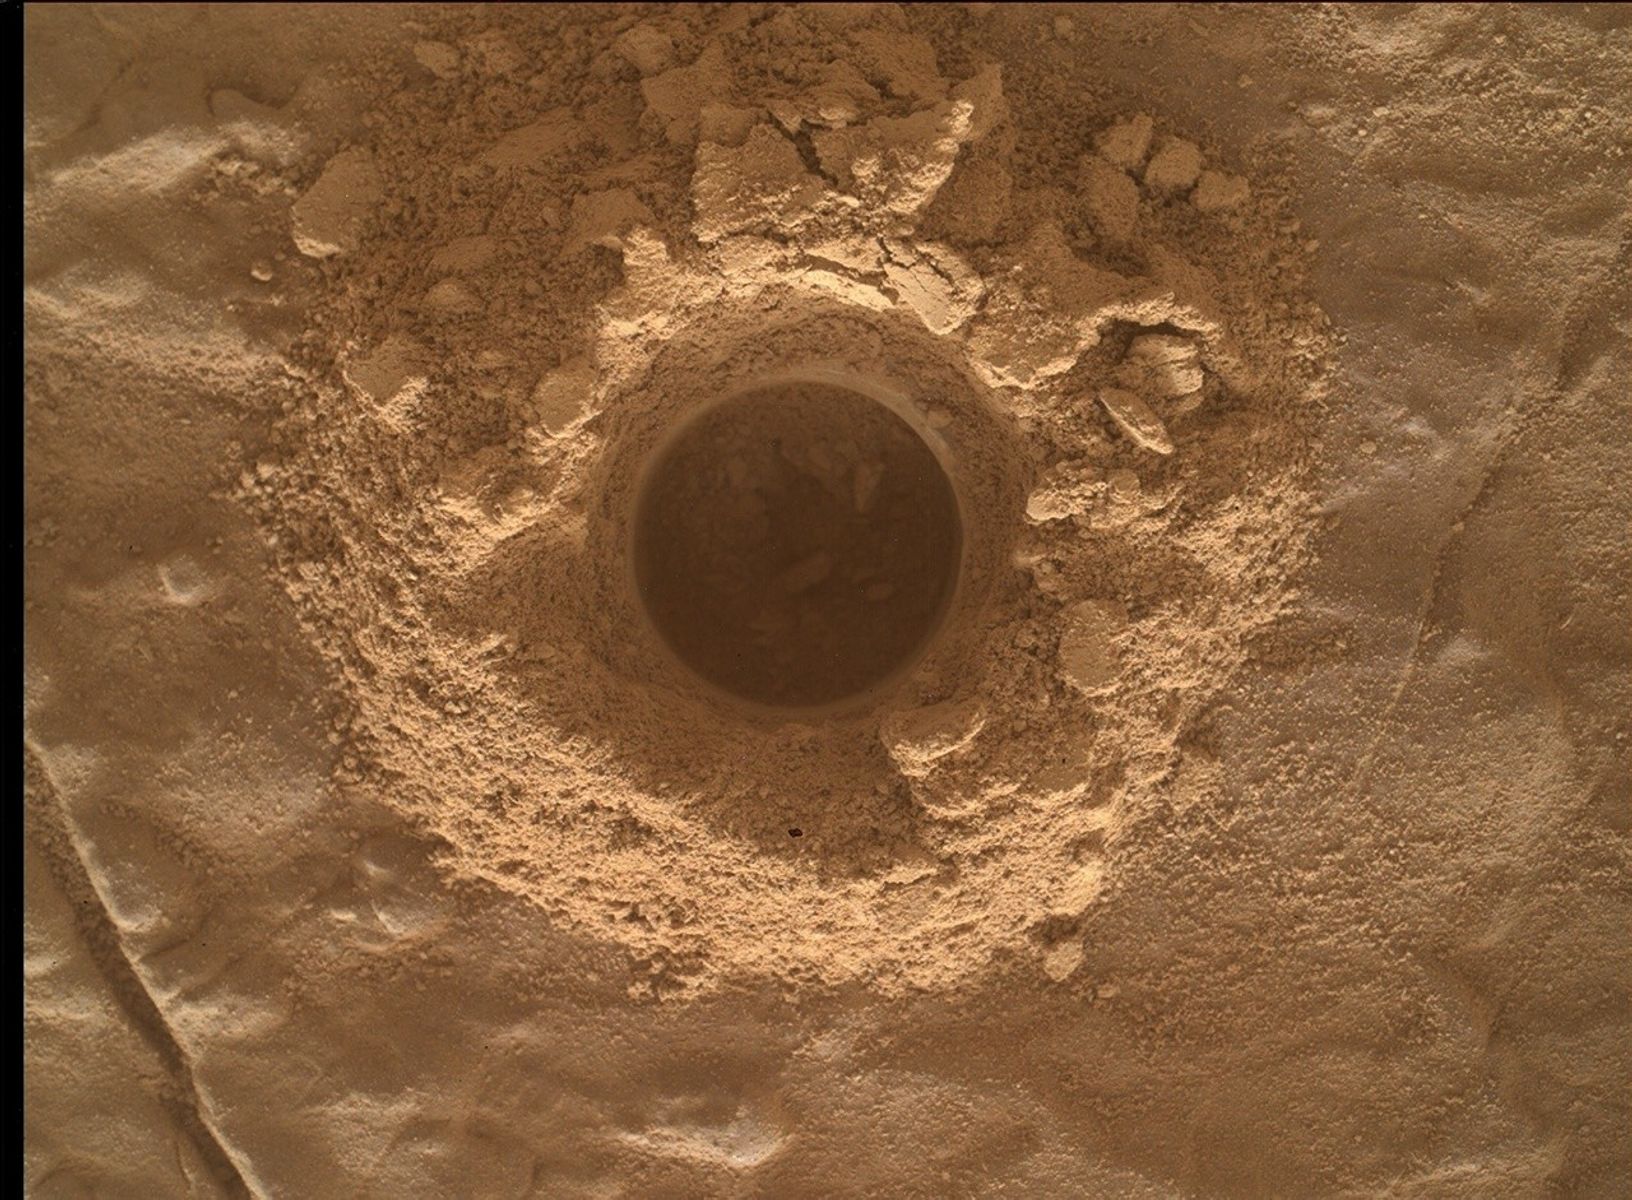
ALT: A color close-up photo of the Martian surface shows smooth but slightly undulating tan-orange ground, with grains of soil or sand scattered throughout. At the center is a hole cored into the ground, surrounded by material dug out from the hole, which looks like a mixture of fine soil and brittle flakes or shards of rock. Those are similarly colored to the surrounding ground.
NASA’s Mars rover Curiosity acquired this image of the “Nevado Sajama 2” drill hole using its Mars Hand Lens Imager (MAHLI), located on the turret at the end of the rover’s robotic arm. Curiosity captured the image Feb. 9, 2026 — Sol 4803, or Martian day 4,803 of the Mars Science Laboratory mission — at 07:41:32 UTC.
NASA/JPL-Caltech/MSSS

Written by Abigail Fraeman, Curiosity Deputy Project Scientist

Earth planning date: Friday, Feb. 13, 2026

Curiosity spent this week at Gale crater completing the last few activities associated with the “Nevado Sajama 2” drill before kicking off our final phase of the boxwork exploration campaign. As we’ve explored the boxwork region, the science team has divided up our activities into four phases: 

  • Phase 1: First approach (sols 4534-4570 / May through June 2025) — This phase focused on making initial observations of the boxwork unit, which culminated in the team’s decision to drill at the Altadena location.
  • Phase 2: Establish regional context (sols 4571-4599 / June through July 2025) — During this time, we collected additional observations of the boxwork unit between the Altadena drill location and arrival at the “main” boxwork area. This included stopping at the distinctive “Volcán Peña Blanca” feature.
  • Phase 3: Exploration of the best expressed boxwork structures (sols 4600-4805 / July 2025 to February 2026) — This period was the heart of the boxwork campaign. During phase 3, we collected lots of observations of the most well-defined ridges and hollows within the boxwork unit, and we used what we learned to select locations where we wanted to drill a hollow and ridge. We selected targets named “Valle de la Luna” and “Nevado Sajama,” respectively.
  • Phase 4: Our final look (sols 4805- ??? / February 2026 and beyond) — We’re kicking off this phase now, which will focus on some last measurements of ridges and hollows as well as an exploration of the contacts between the boxwork unit and adjacent geologic units to the east and south. Once this is completed, we’ll wrap up and continue our climb up Mount Sharp through the recently named “Valle Grande.”

Our first drive away from the Nevado Sajama drill took Curiosity northeast along one of the wide ridges. From near this spot, we have a good view of ridges and hollows to the east. We’re particularly interested in getting a better look of a hollow that, in orbital data, seems to have interesting-looking bedrock on its floor as well as a particularly narrow ridge that has many small ridges branching off it, which the team has dubbed “Los Flamencos.” These images will help us see if we want to drive to one or both features, and they will help us plan the exact places to drive next week. While we’re here, Curiosity will also collect lots of data on the bedrock in front of the rover, with APXS and MAHLI observations planned for targets named “Mollecita” and “Monte Cielo.” 

We got so much wonderful data from the drilling activities over the last few weeks, and it feels really good to be back on the Martian boxwork road again to begin this final phase of our boxwork unit campaign.

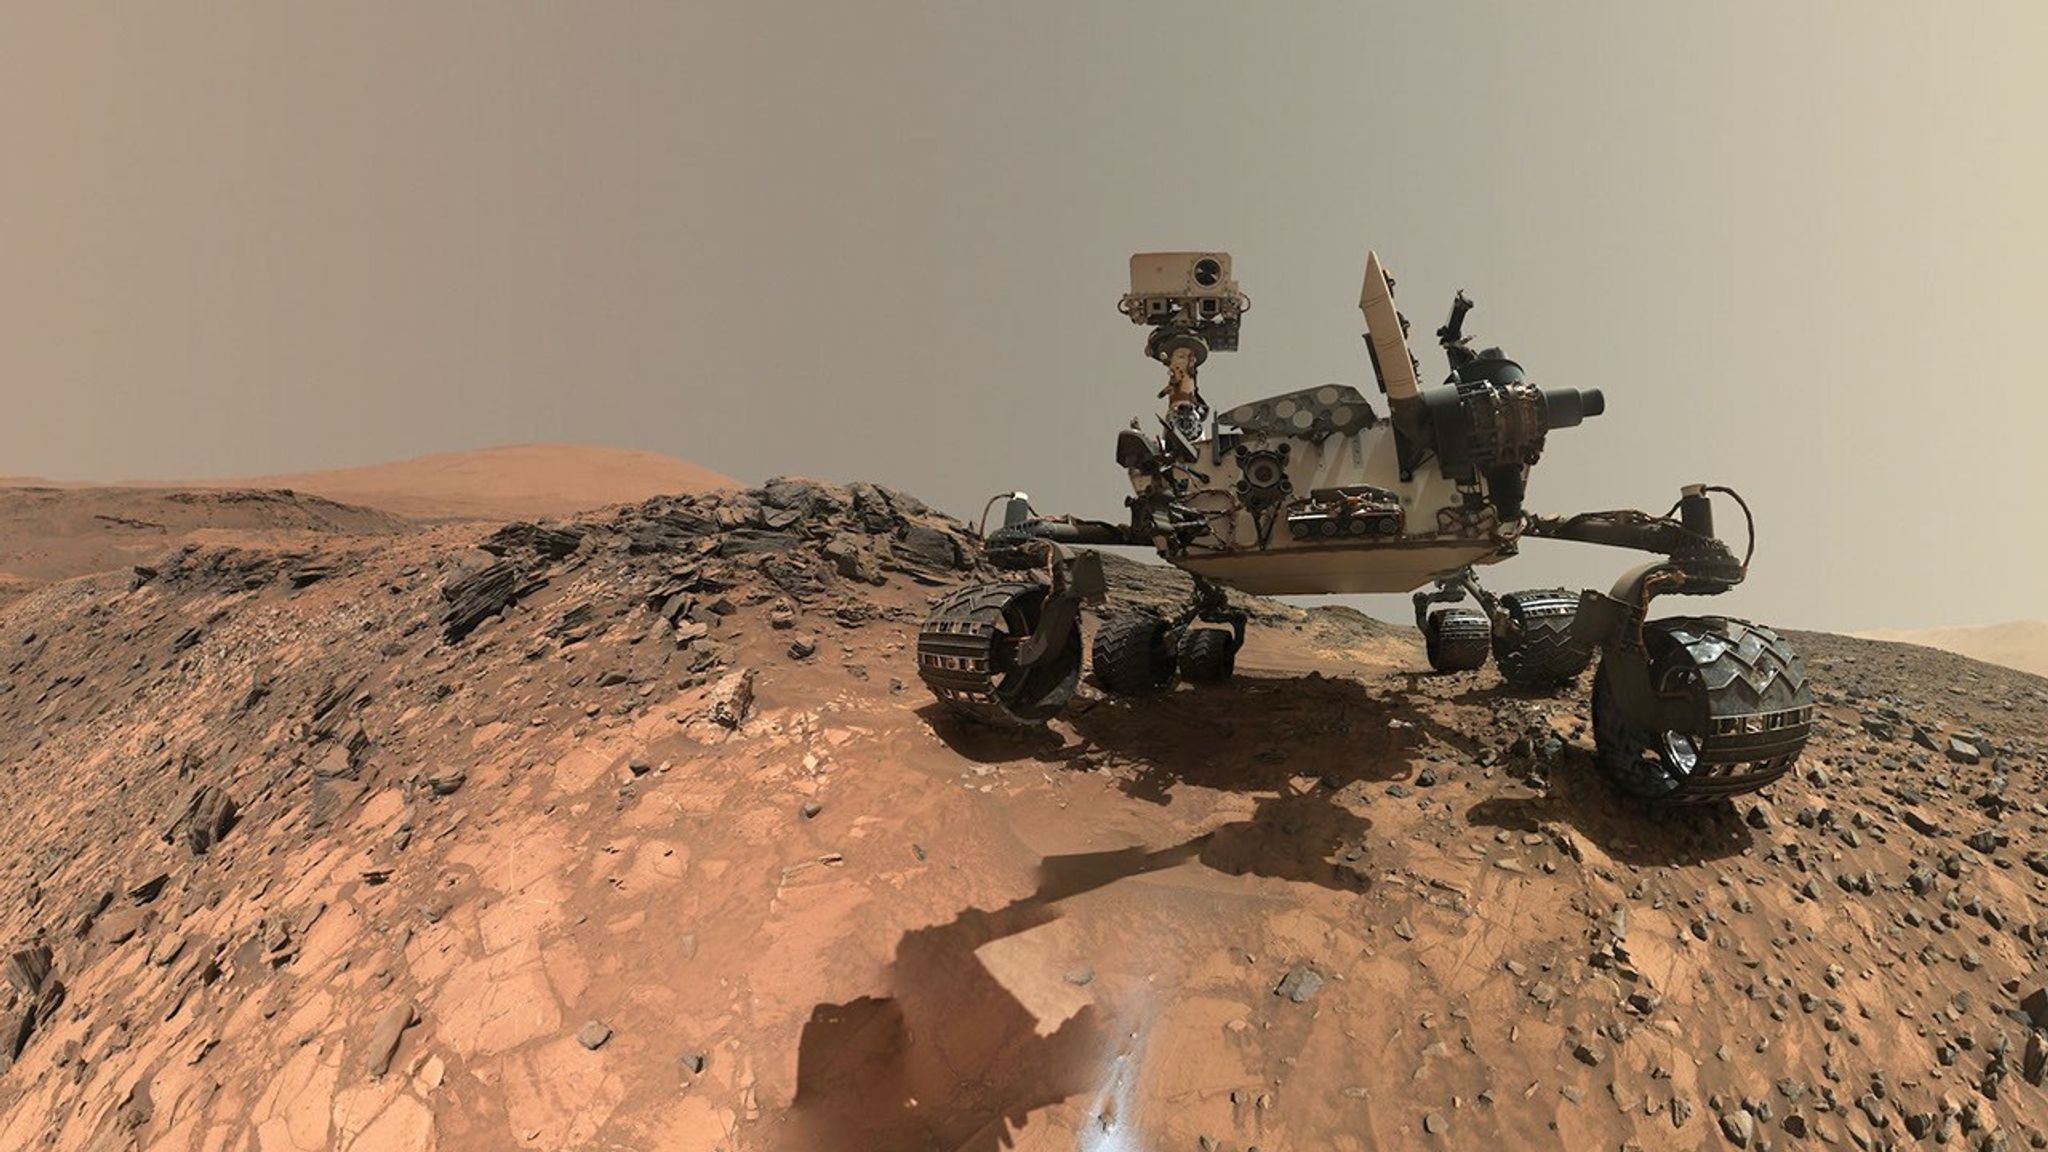
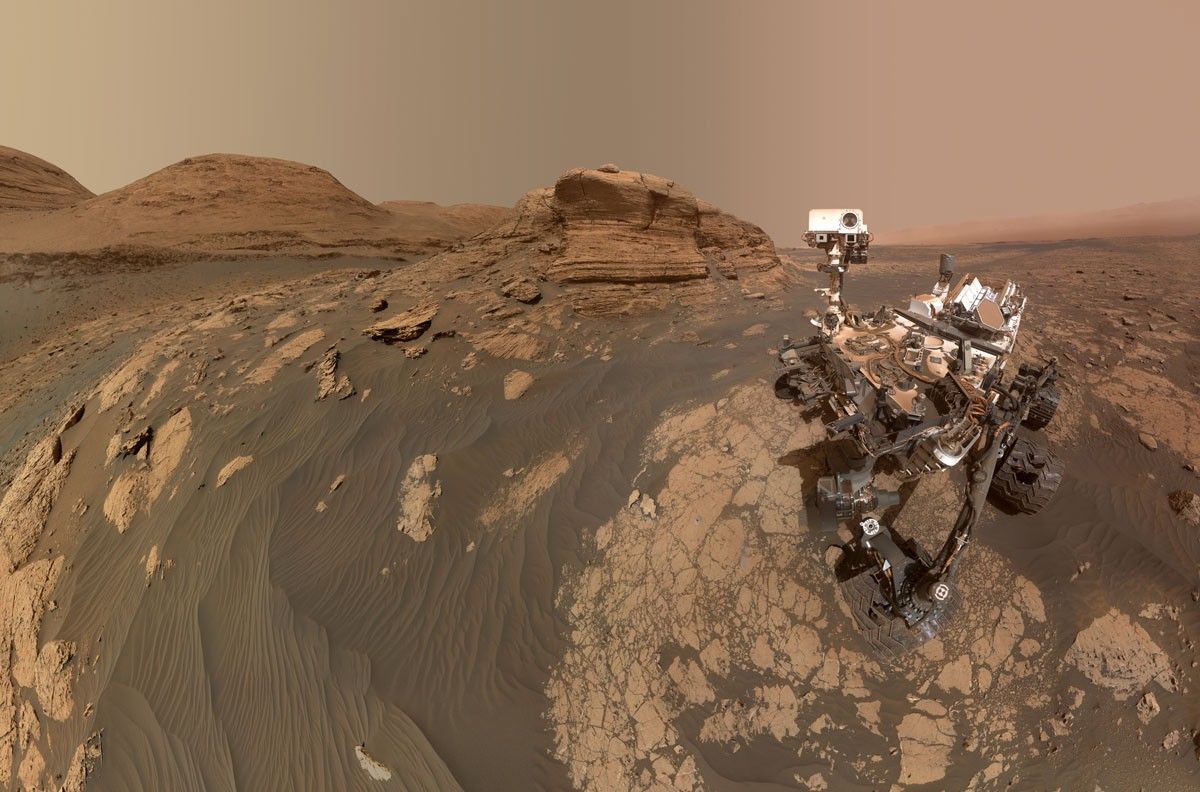
A rover sits on the hilly, orange Martian surface beneath a flat grey sky, surrounded by chunks of rock.
NASA’s Curiosity rover at the base of Mount Sharp
NASA/JPL-Caltech/MSSS

Share

Details

Last Updated
Feb 17, 2026

Related Terms

Powered by WPeMatico

Get The Details…

Stormy, Snowy Winter for Hokkaido

Stormy, Snowy Winter for Hokkaido

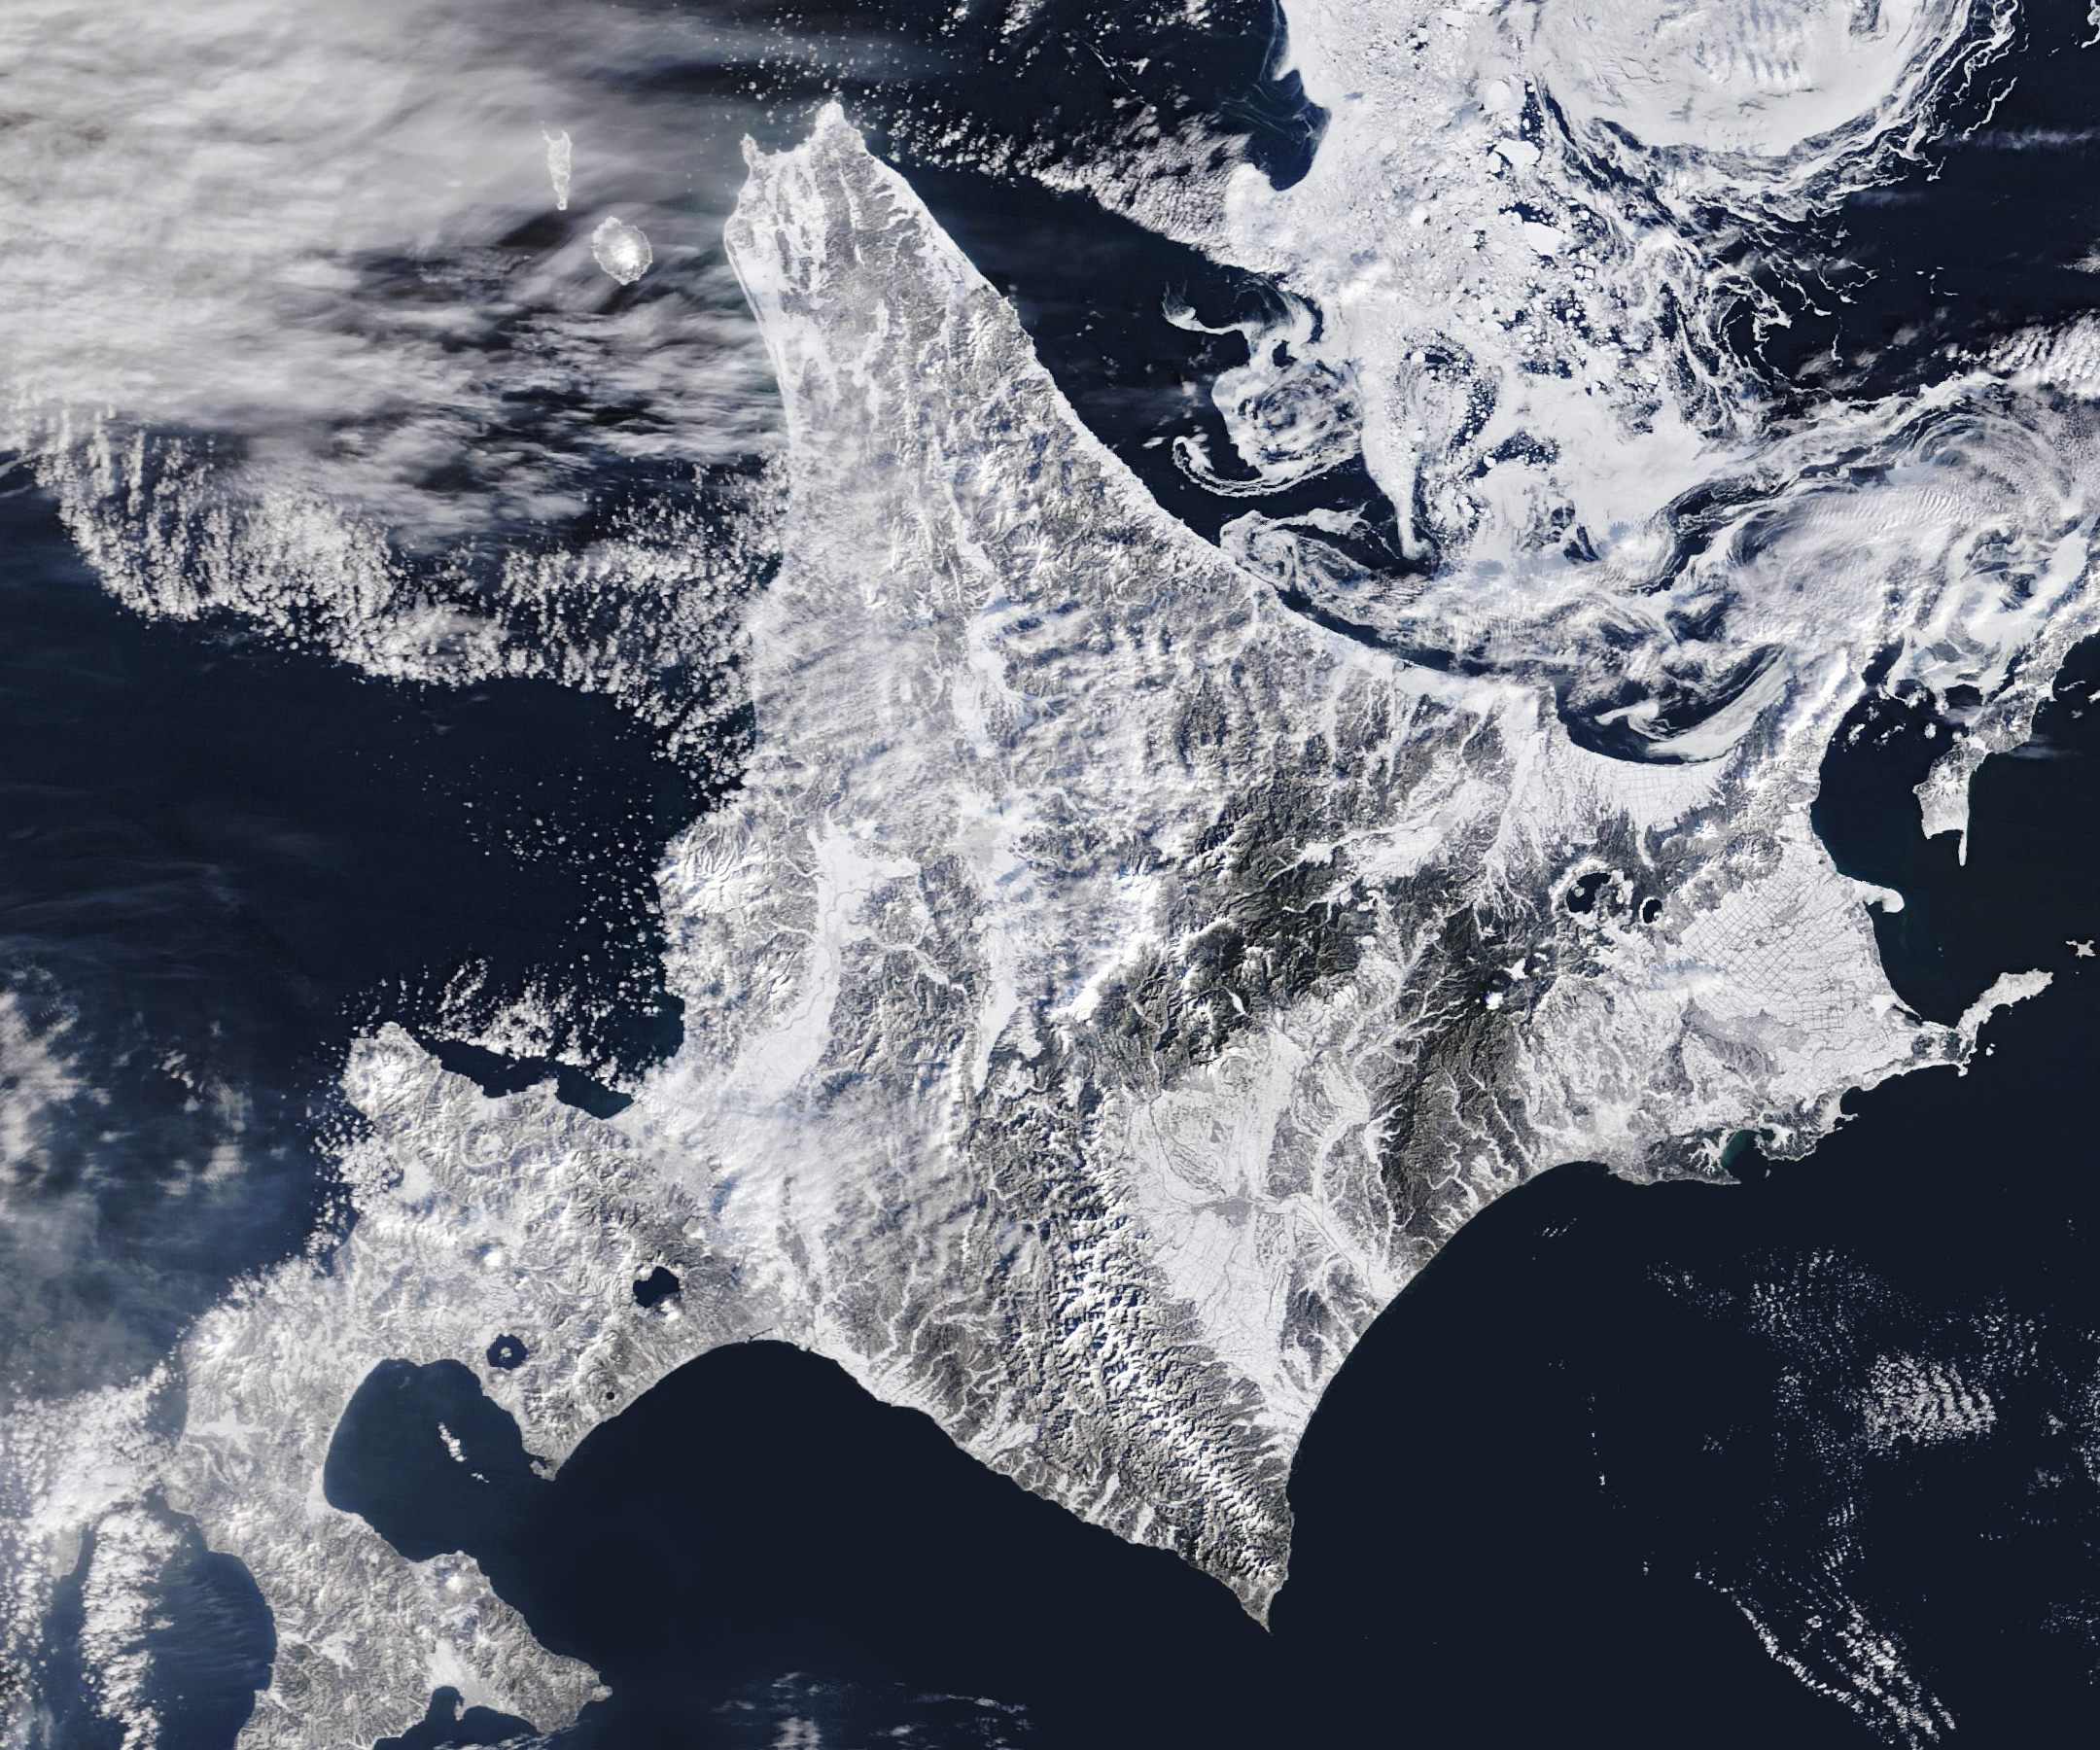
A satellite image shows snow blanketing Hokkaido, Japan, with sea ice swirling just north of the island.
Northern Japan, especially the island of Hokkaido, is home to some of the snowiest cities in the world. Sapporo, the island’s largest city and host of an annual snow festival, typically sees more than 140 days of snowfall, with nearly 6 meters (20 feet) accumulating on average each year.
Michala Garrison, using MODIS data from NASA EOSDIS LANCE and GIBS/Worldview

On February 5, 2026, the MODIS (Moderate Resolution Imaging Spectroradiometer) on NASA’s Terra satellite acquired this image of snow-covered landscapes across Hokkaido. With more than 31 active volcanoes, the island features several large caldera lakes, including at least five that are visible in the image. (Calderas are large depressions formed by volcanic eruptions.) In the east, forested windbreaks around Nakashibetsu form a checkerboard pattern, while to the north, swirls of drifting sea ice adorn the Sea of Okhotsk.

Northern Japan, especially the island of Hokkaido, is home to some of the snowiest cities in the world. However, despite the region’s familiarity with heavy snowfall, winter 2026 got off to a disruptive start. A series of intense storms in January and February repeatedly paralyzed transportation systems, closing airports, snarling roadways, and suspending trains.

Read more about sea ice and snowstorms in Japan.

Text credit: Adam Voiland

Image credit: Michala Garrison, using MODIS data from NASA EOSDIS LANCE and GIBS/Worldview

Powered by WPeMatico

Get The Details…
Monika Luabeya

NASA Advances High-Altitude Traffic Management

NASA Advances High-Altitude Traffic Management

4 min read

Preparations for Next Moonwalk Simulations Underway (and Underwater)

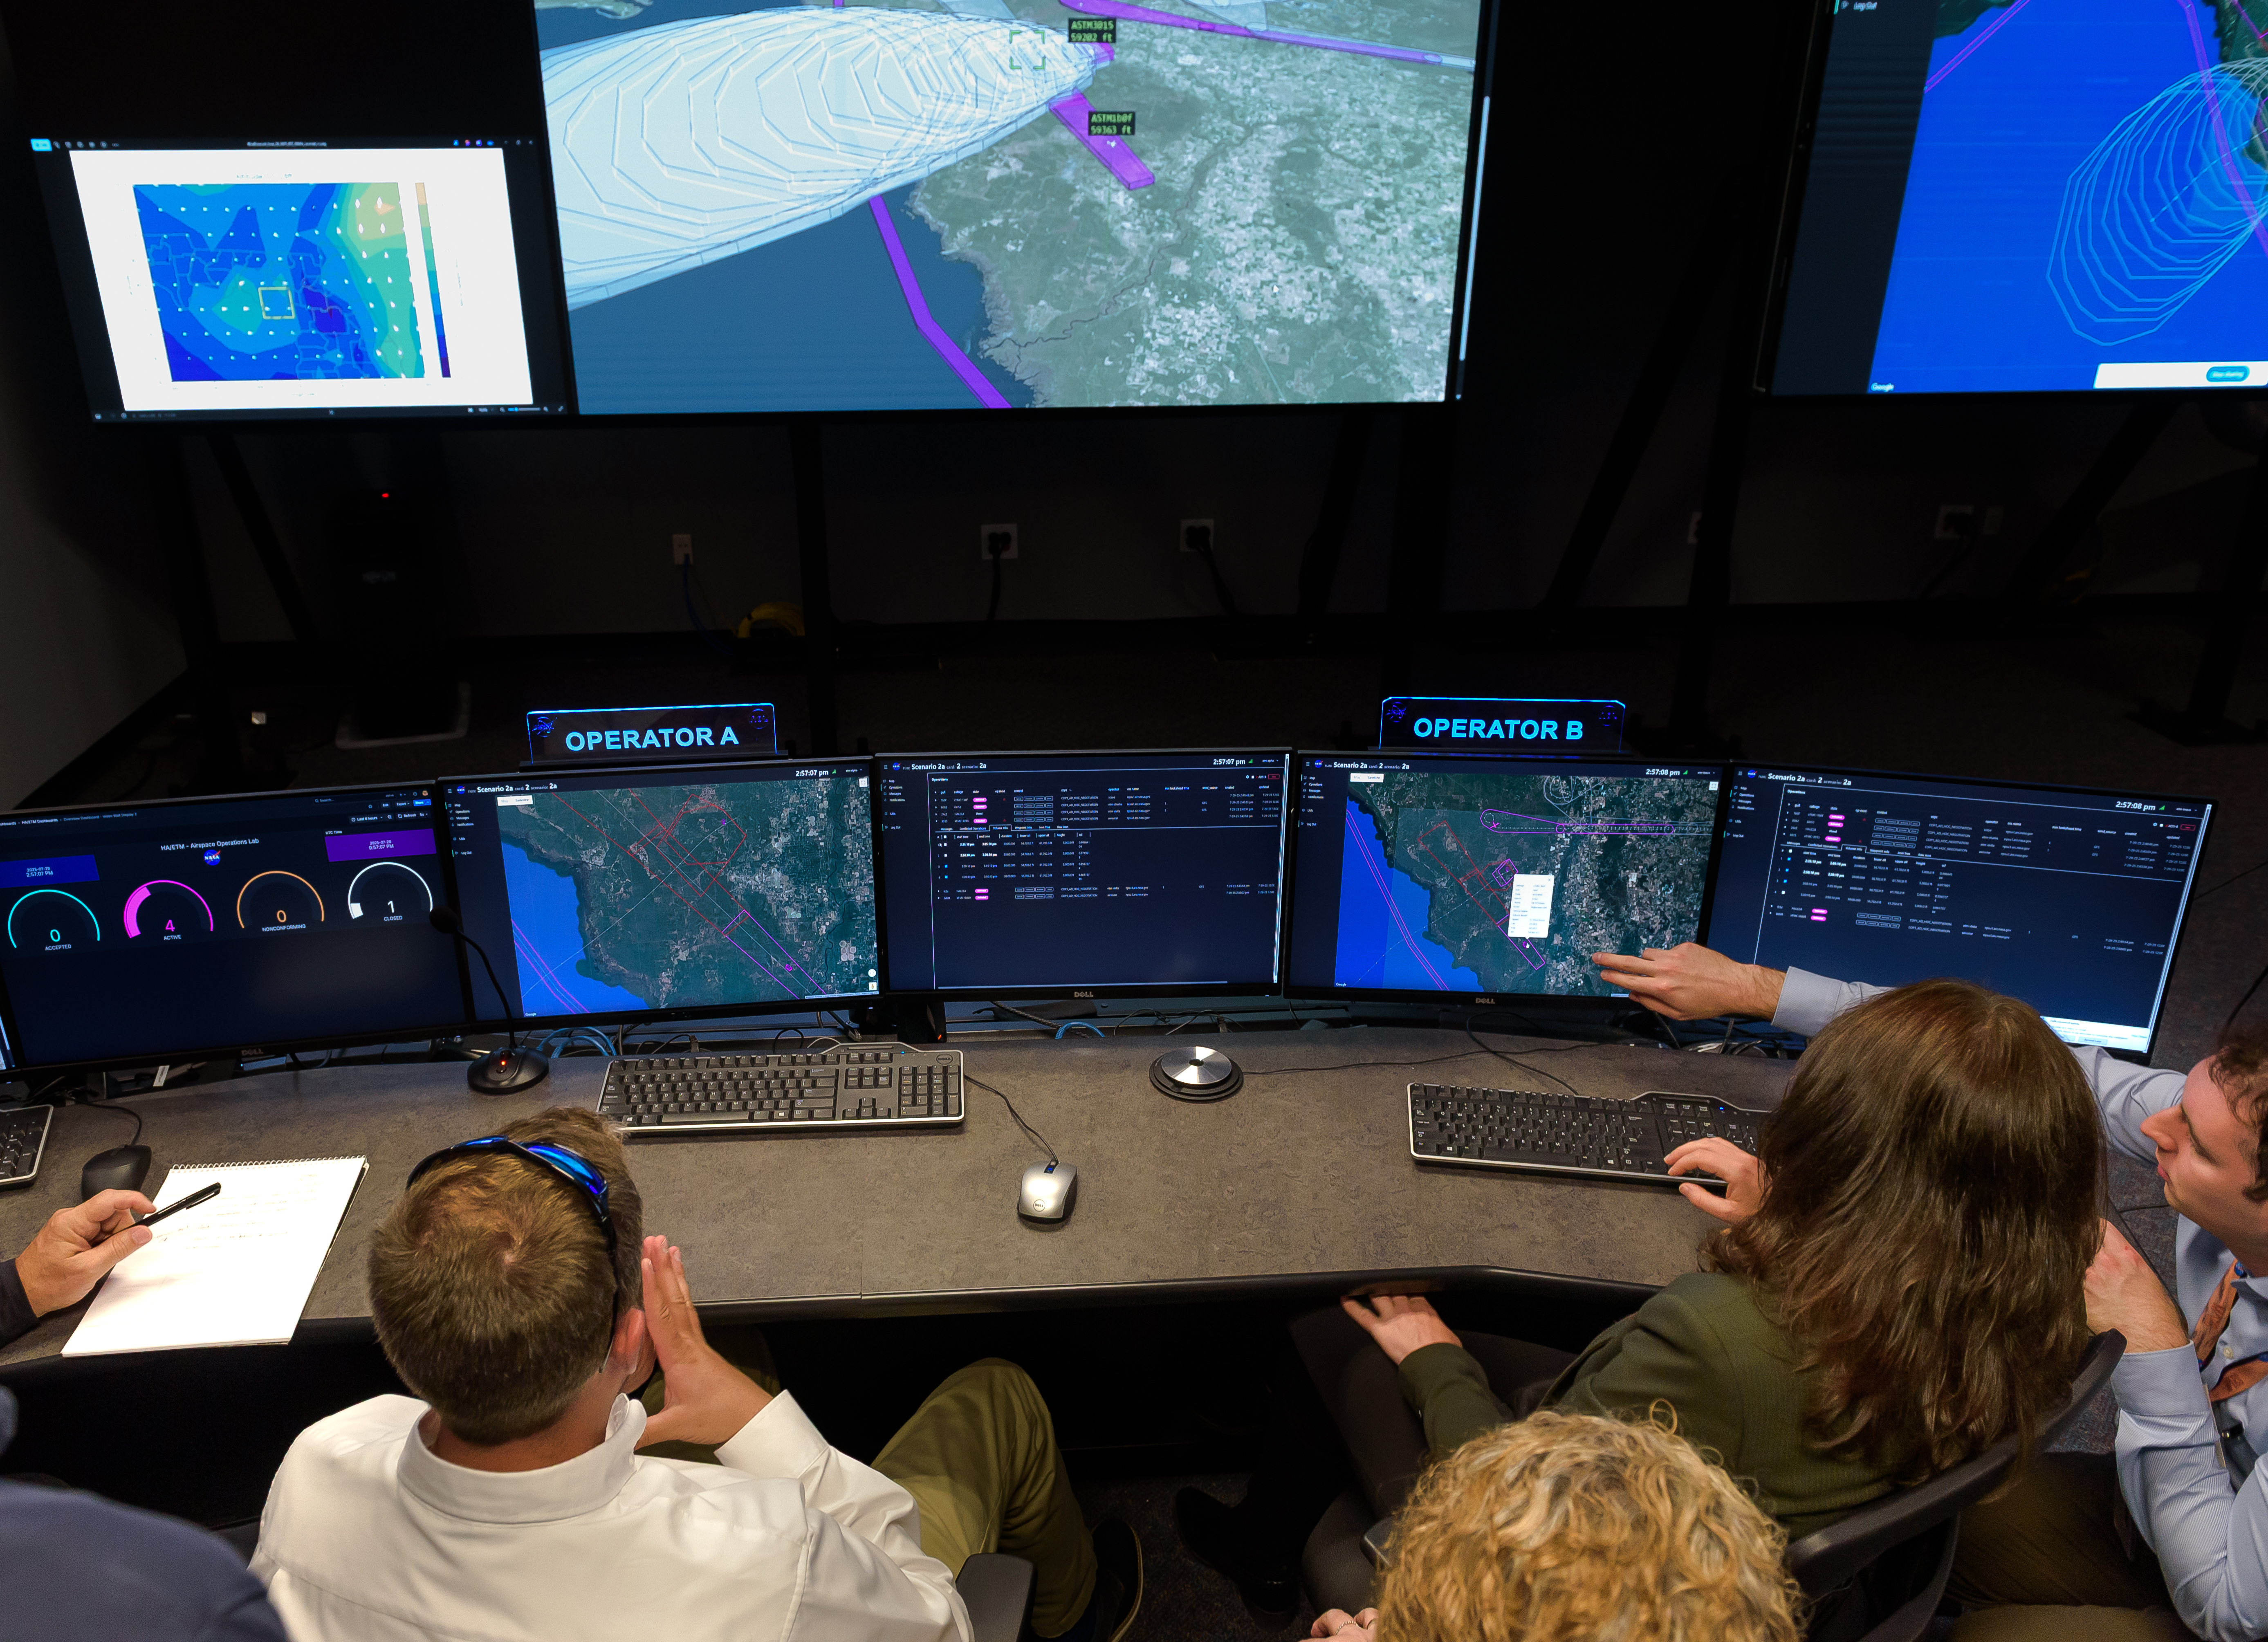
A NASA simulation of higher airspace traffic management with industry partners Aerostar and Sceye in the Airspace Operations Laboratory at NASA’s Ames Research Center in California’s Silicon Valley on July 29, 2025.
NASA/Donald Richey

High-altitude flight is getting increasing attention from sectors ranging from telecommunications to emergency response. To make that airspace more accessible, NASA is developing an air traffic management system covering those altitudes and supplementing its work with real-time data from a research balloon in Earth’s stratosphere. 

Aircraft at high altitudes – 50,000 feet or higher, or roughly 10,000 to 20,000 feet above most commercial traffic – offer new possibilities for delivering internet connectivity in regions in need of reliable service. And they can deliver unprecedented situational awareness for the ground below, providing early warnings for floods and other disasters.  

For these types of operations, “station-keeping,” or remaining in the same region for extended periods of time, can be ideal for aircraft including balloons and airships.  

These flights will require a different sort of air traffic management system from the ones that cover most commercial flights – and it needs to be dependable. That’s why NASA is working to produce a system that ensures aircraft can operate safely in high-altitude airspace, with a particular focus on station-keeping.  

 “Current high-altitude air traffic management is manual and piecemeal,” said Jeff Homola, researcher at NASA’s Ames Research Center in California’s Silicon Valley. “We saw the need for a scalable solution – something multiple operators in a shared airspace can safely rely on. Our system provides shared awareness of the airspace, identifies potential conflicts, enables cooperative conflict resolution, and allows operators to complete missions safely.” 

NASA’s expertise and technology, and the agency’s knowledge of the needs of the aviation industry, put it in an ideal position to perform the work. And NASA researchers are collaborating with the companies Aerostar and Sceye, developers and operators of high-altitude aircraft, to evaluate the system.  

“We’re leveraging decades of NASA’s air traffic management expertise to make this possible,” Homola said. 

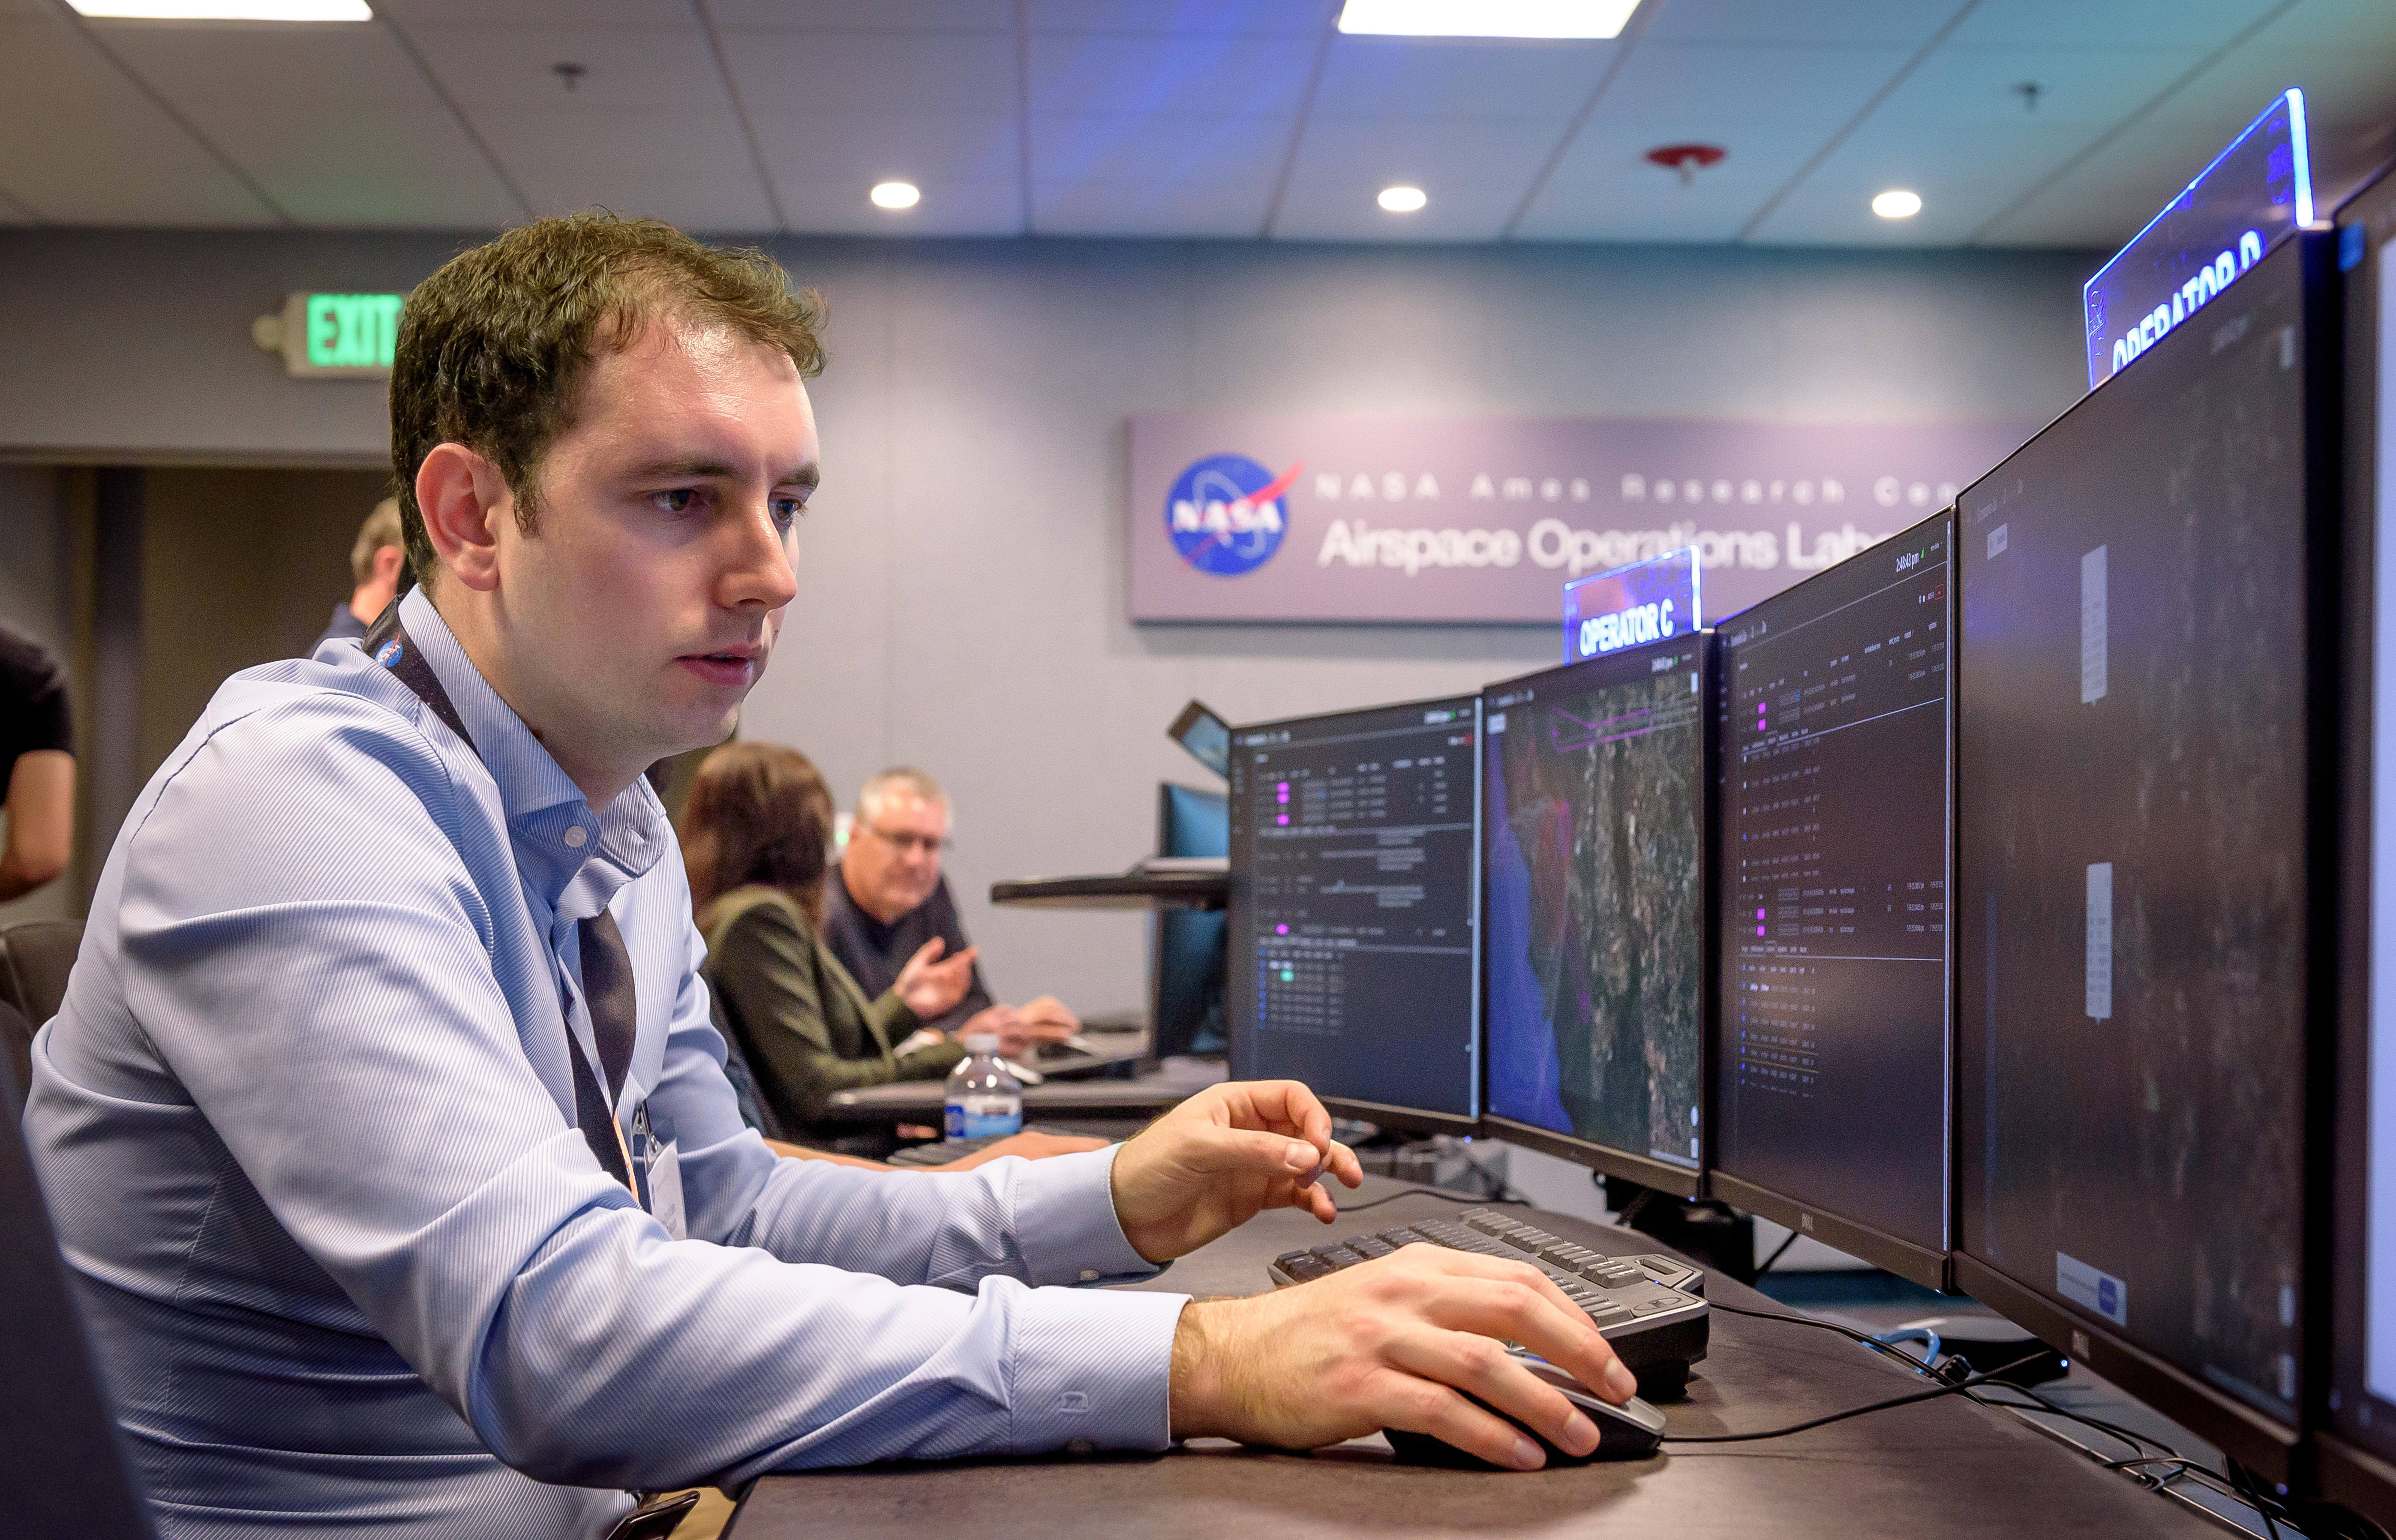
Kevin-Christian Garzon Galindo, San Jose State University researcher at NASA Ames, monitors airspace data during the higher airspace air traffic simulation at NASA Ames on July 29, 2025.
NASA/Donald Richey

This NASA system enables operators to share live flight data, information about their flight plans, and potential conflict alerts. Based on this information, operators can coordinate flight plans in real time. During a 2025 simulation at NASA Ames, researchers tested how efficiently that data sharing would be among operators of lighter-than-air vehicles – both balloons and airships. 

For this test, NASA, Aerostar, Sceye acted as operators of high-altitude vehicles, sharing information from facilities in California, South Dakota, and New Mexico. They were able to share flight information, as well as telemetry data from an Aerostar stratospheric balloon floating 66,500 feet above Sioux Falls, South Dakota, at the time of the testing. 

The simulation built on earlier tests, adding improved flight-intent visualization, conflict detection, and, for the first time, live flight data from the balloon.  

NASA researchers also studied how operators make decision when planned aircraft trajectories overlap, which will help refine essential rules and guidelines for safer high-altitude airspace operations.    

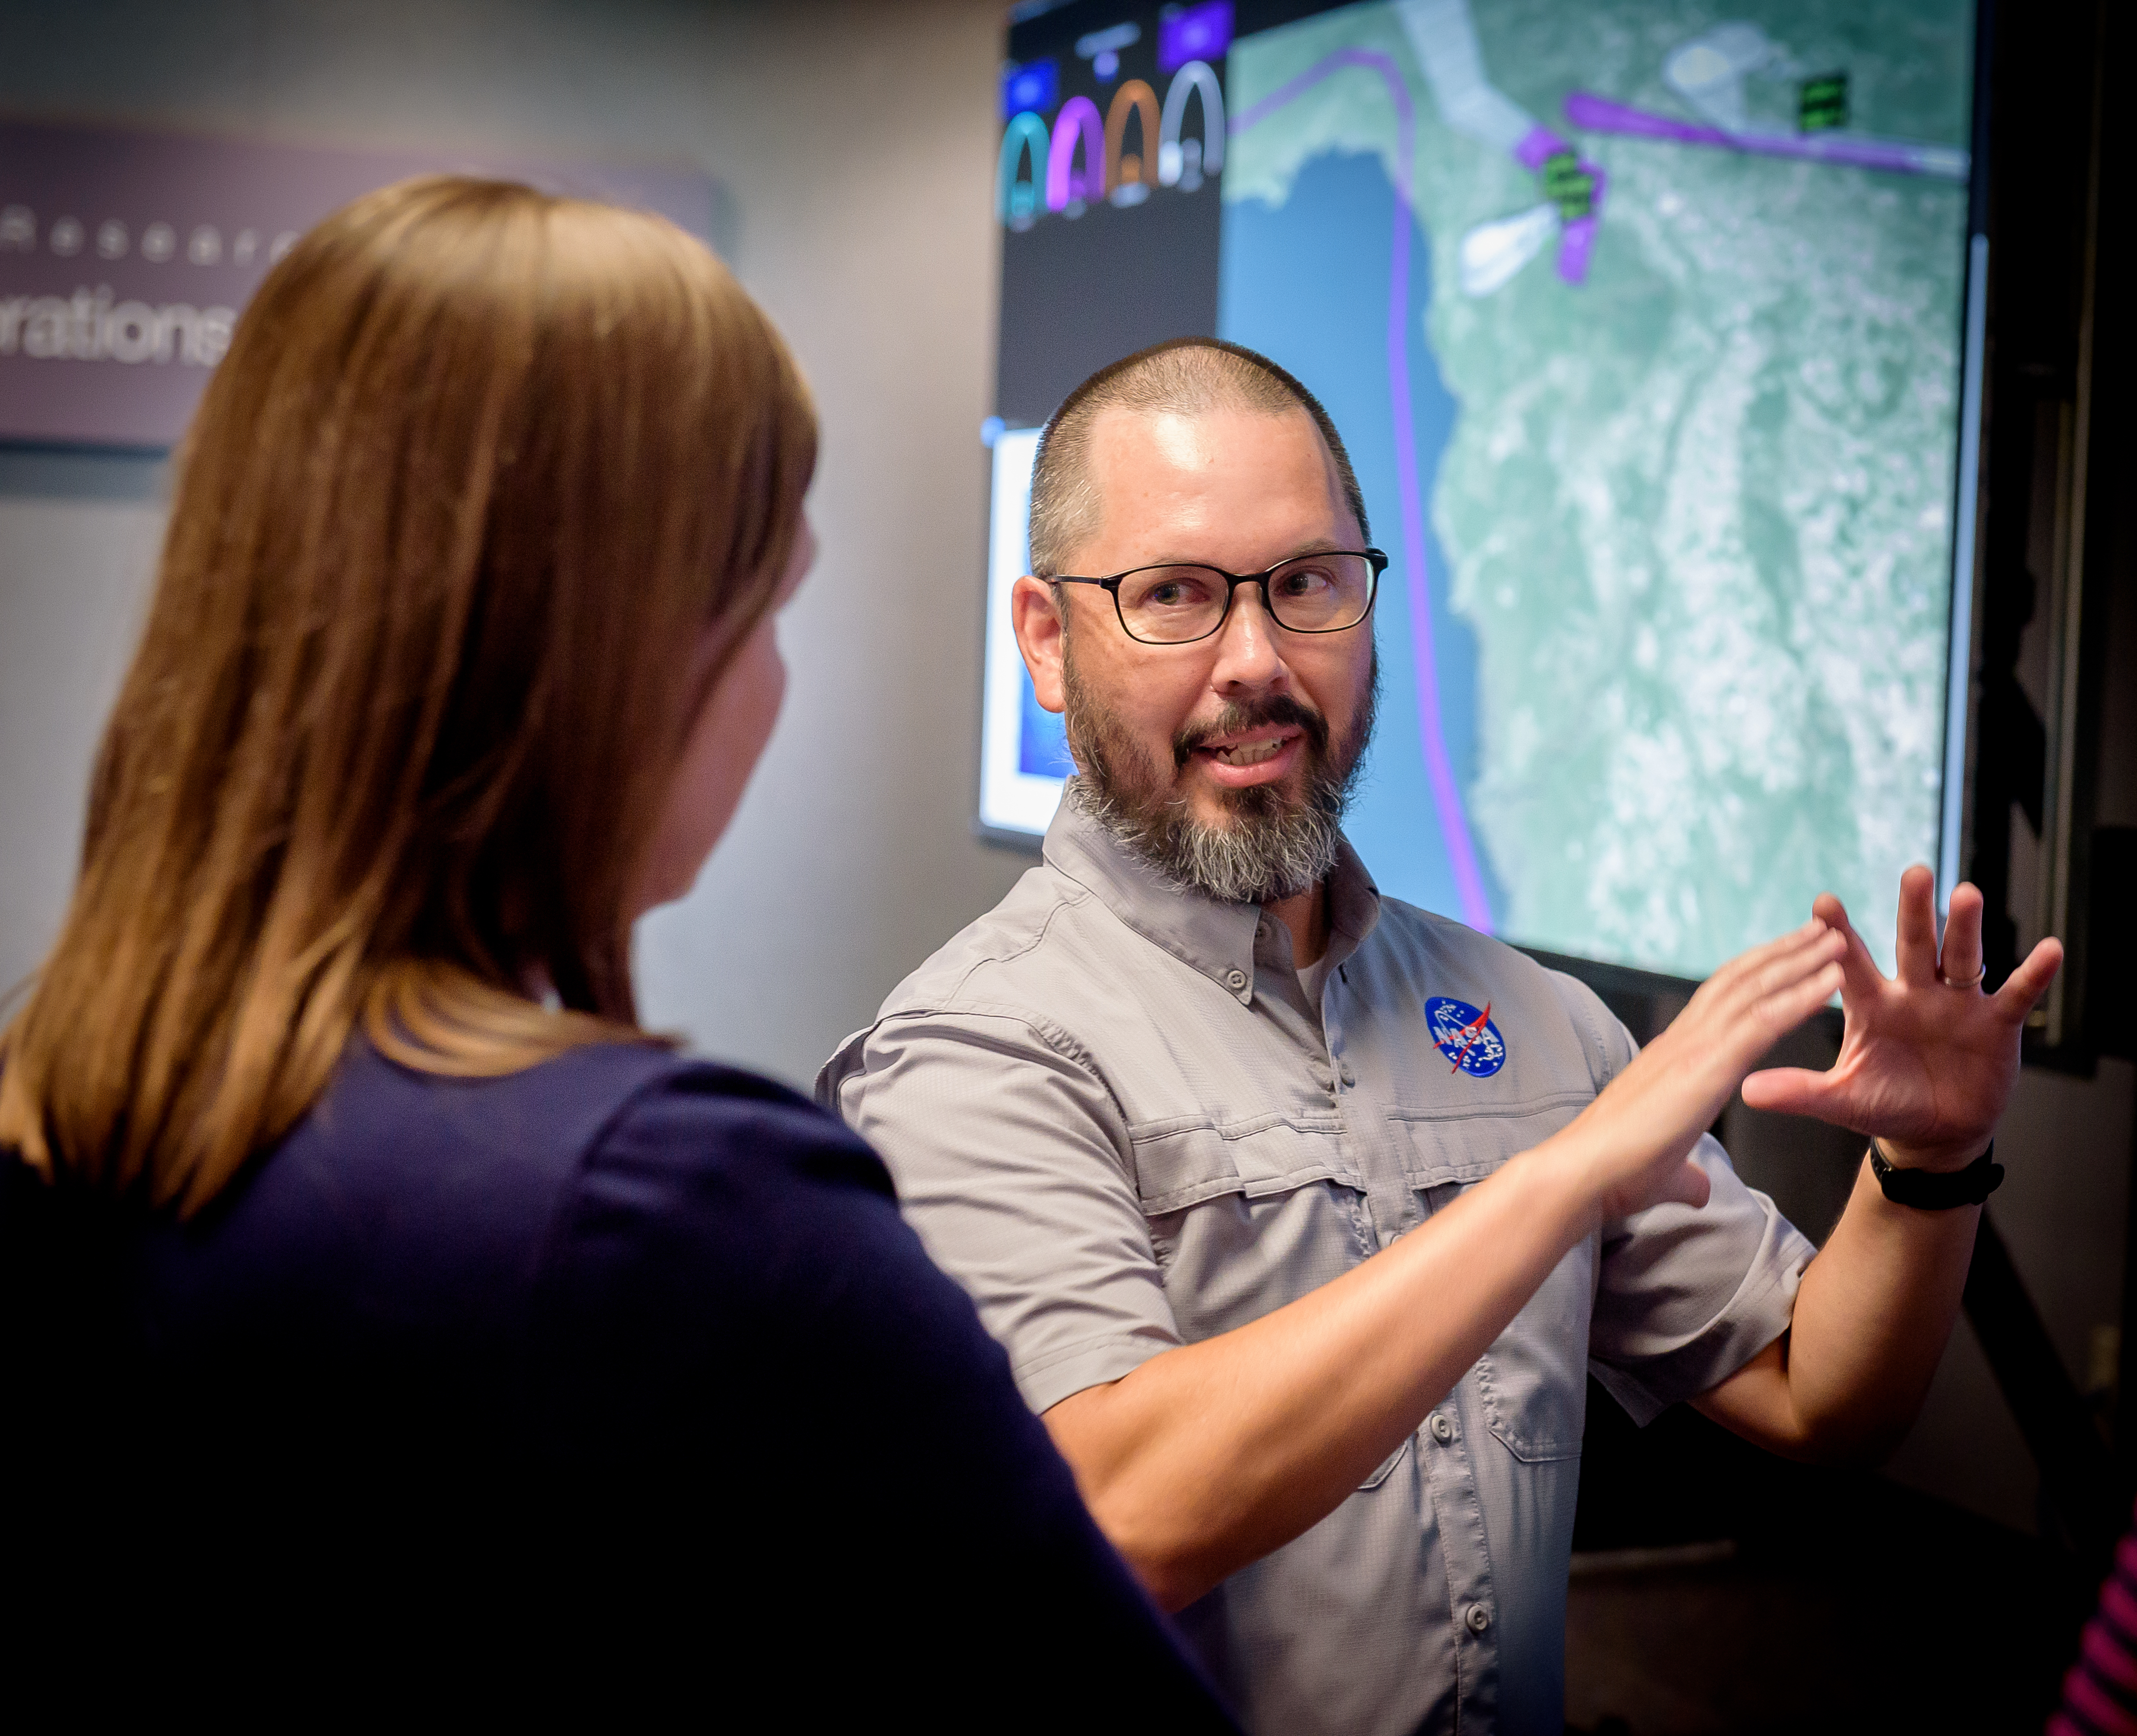
NASA researchers Heather Arneson and Jeff Homola discuss the high-altitude air traffic simulation in the agency’s Airspace Operations Lab at NASA Ames on July 29, 2025.
NASA/Donald Richey

For decades, NASA has biggest air traffic management challenges facing the National Airspace System. NASA innovations have helped cut fuel consumption, prevent accidents, enable precision navigation, and lay the groundwork for today’s modern air traffic management systems. This specific work builds on the initiatives focused on drone operations. 

NASA will share results and lessons learned from the simulation with the Federal Aviation Administration (FAA) to inform its approach to ensuring that higher airspace operations are accessible, safe, and scalable.

The agency will continue advancing the high-altitude traffic management system through continued collaboration with industry partners and the FAA. NASA’s goal is to create a framework that opens the door to new commercial, scientific, and humanitarian missions.

This work has been supported through NASA’s Air Traffic Management Exploration project. The project is part of the agency’s Airspace Operations and Safety Program within its Aeronautics Research Mission Directorate.

Powered by WPeMatico
Get The Details…
Tara Friesen