NASA’s Webb Finds Clues to Ancient, Distant Origin of Comet 3I/ATLAS

NASA’s Webb Finds Clues to Ancient, Distant Origin of Comet 3I/ATLAS
4 Min Read

NASA’s Webb Finds Clues to Ancient, Distant Origin of Comet 3I/ATLAS

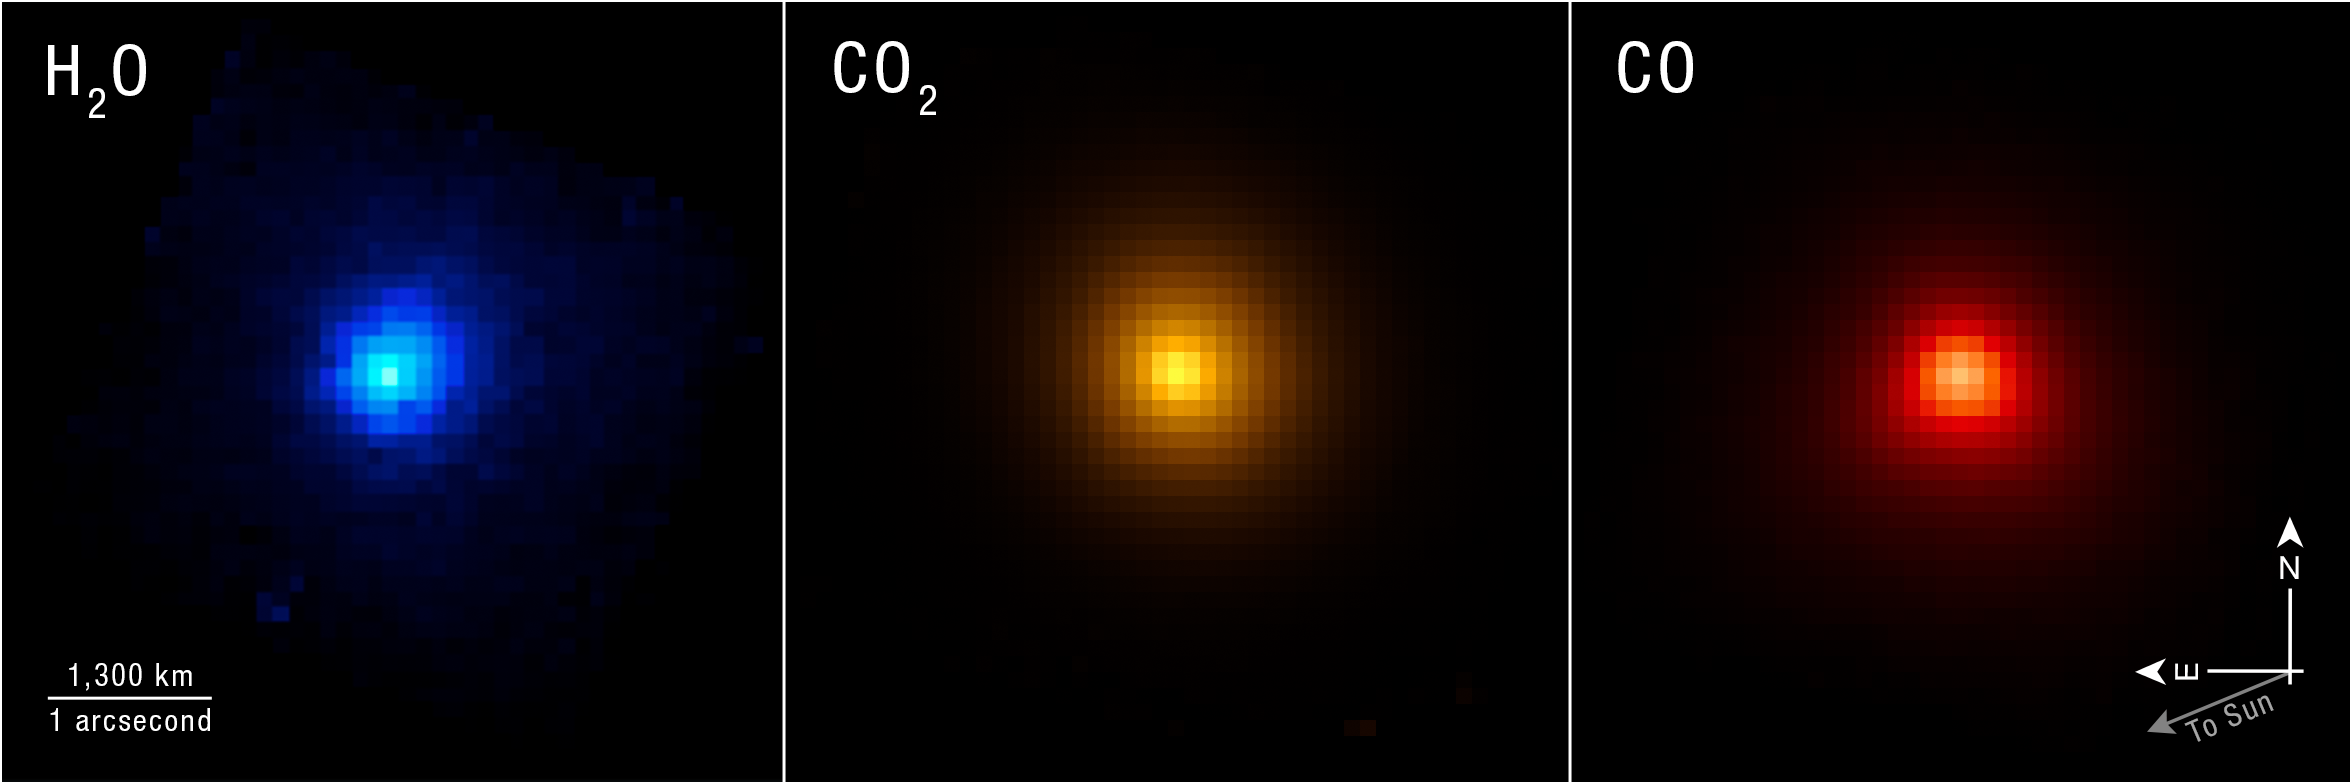
Comparison of three telescope images side by side. They are roughly spherical but pixelated, with more intense color saturation in the center. From left to right: smallest sphere is blue and labeled H2O, orange is larger and labeled CO2, and red is largest and labeled CO. A scale bar at the lower left is labeled 1300 km/1 arcsecond and is about one fourth of each of the three images. A compass at the lower right shows north pointing up to 12 o’clock, east pointing left to 9 o’clock, and a fainter arrow labeled to Sun pointing down to 8 o’clock.
Researchers used the NIRSpec (Near-Infrared Spectrograph) instrument on NASA’s James Webb Space Telescope to map specific chemical contents of comet 3I/ATLAS as it moved away from the Sun. Full image shown below.
Credits:
Image: NASA, ESA, CSA, STScI, Martin Cordiner (CUA, NASA-GSFC); Image Processing: Alyssa Pagan (STScI)

As interstellar comet 3I/ATLAS began moving away from the Sun in December 2025, astronomers took the opportunity to turn NASA’s powerful James Webb Space Telescope in its direction and capture detailed measurements of its chemical components. The comet was freshly warmed from its closest pass by the Sun, and its ancient ice had been converted to a bright coma of gas ideal for observation. 

Webb captured detailed data, including chemical ratios of carbon and deuterium, also known as heavy hydrogen, that are not found in solar system comets. The results surprised researchers. Working backward, astronomers used the components that make up comet 3I/ATLAS to understand the environment in which it formed. 

A paper detailing the findings published June 22 in the journal Nature. 

Image: Interstellar Comet 3I/ATLAS (NIRSpec IFU)

Comparison of three telescope images side by side. They are roughly spherical but pixelated, with more intense color saturation in the center. From left to right: smallest sphere is blue and labeled H2O, orange is larger and labeled CO2, and red is largest and labeled CO. A scale bar at the lower left is labeled 1300 km/1 arcsecond and is about one fourth of each of the three images. A compass at the lower right shows north pointing up to 12 ou2019clock, east pointing left to 9 ou2019clock, and a fainter arrow labeled to Sun pointing down to 8 ou2019clock.
Researchers used the NIRSpec (Near-Infrared Spectrograph) instrument on NASA’s James Webb Space Telescope to map specific chemical contents of comet 3I/ATLAS as it moved away from the Sun. 
Image: NASA, ESA, CSA, STScI, Martin Cordiner (CUA, NASA-GSFC); Image Processing: Alyssa Pagan (STScI)

The comet’s name comes from its status as the third confirmed interstellar comet, meaning it originated outside the solar system, and the telescope that first spotted it, the NASA-funded ATLAS (Asteroid Terrestrial-impact Last Alert System).

“This was a unique opportunity to study an ancient object from the distant galaxy, probably pre-dating our Sun and solar system,” said astro-chemist Martin Cordiner of NASA’s Goddard Space Flight Center in Greenbelt, Maryland, and lead author of the study. “On the one hand, we get direct insight into that distant time and place, and on the other, we learn something about how unusual our own solar system may be.”

Cordiner and the research team joined astronomers from many sub-disciplines in taking the opportunity to get a look at 3I/ATLAS on its journey through the solar system. They received approval to interrupt Webb’s planned schedule of observations to make use of its NIRSpec (Near-Infrared Spectrograph) instrument to study the comet. 

NIRSpec revealed exceptionally high levels of deuterium, about 30 times more than seen in solar system comets. This implies that 3I/ATLAS may have originated in a very cold system much earlier in the history of our galaxy. During its formation, the material that became incorporated into 3I/ATLAS was likely exposed to plenty of radiation, but not any long-term warmth that would have reprocessed its “heavy water” ice, with deuterium, into the type of H2O ice we are familiar with on Earth.

Image: 3I/ATLAS Compared to Solar System Comets
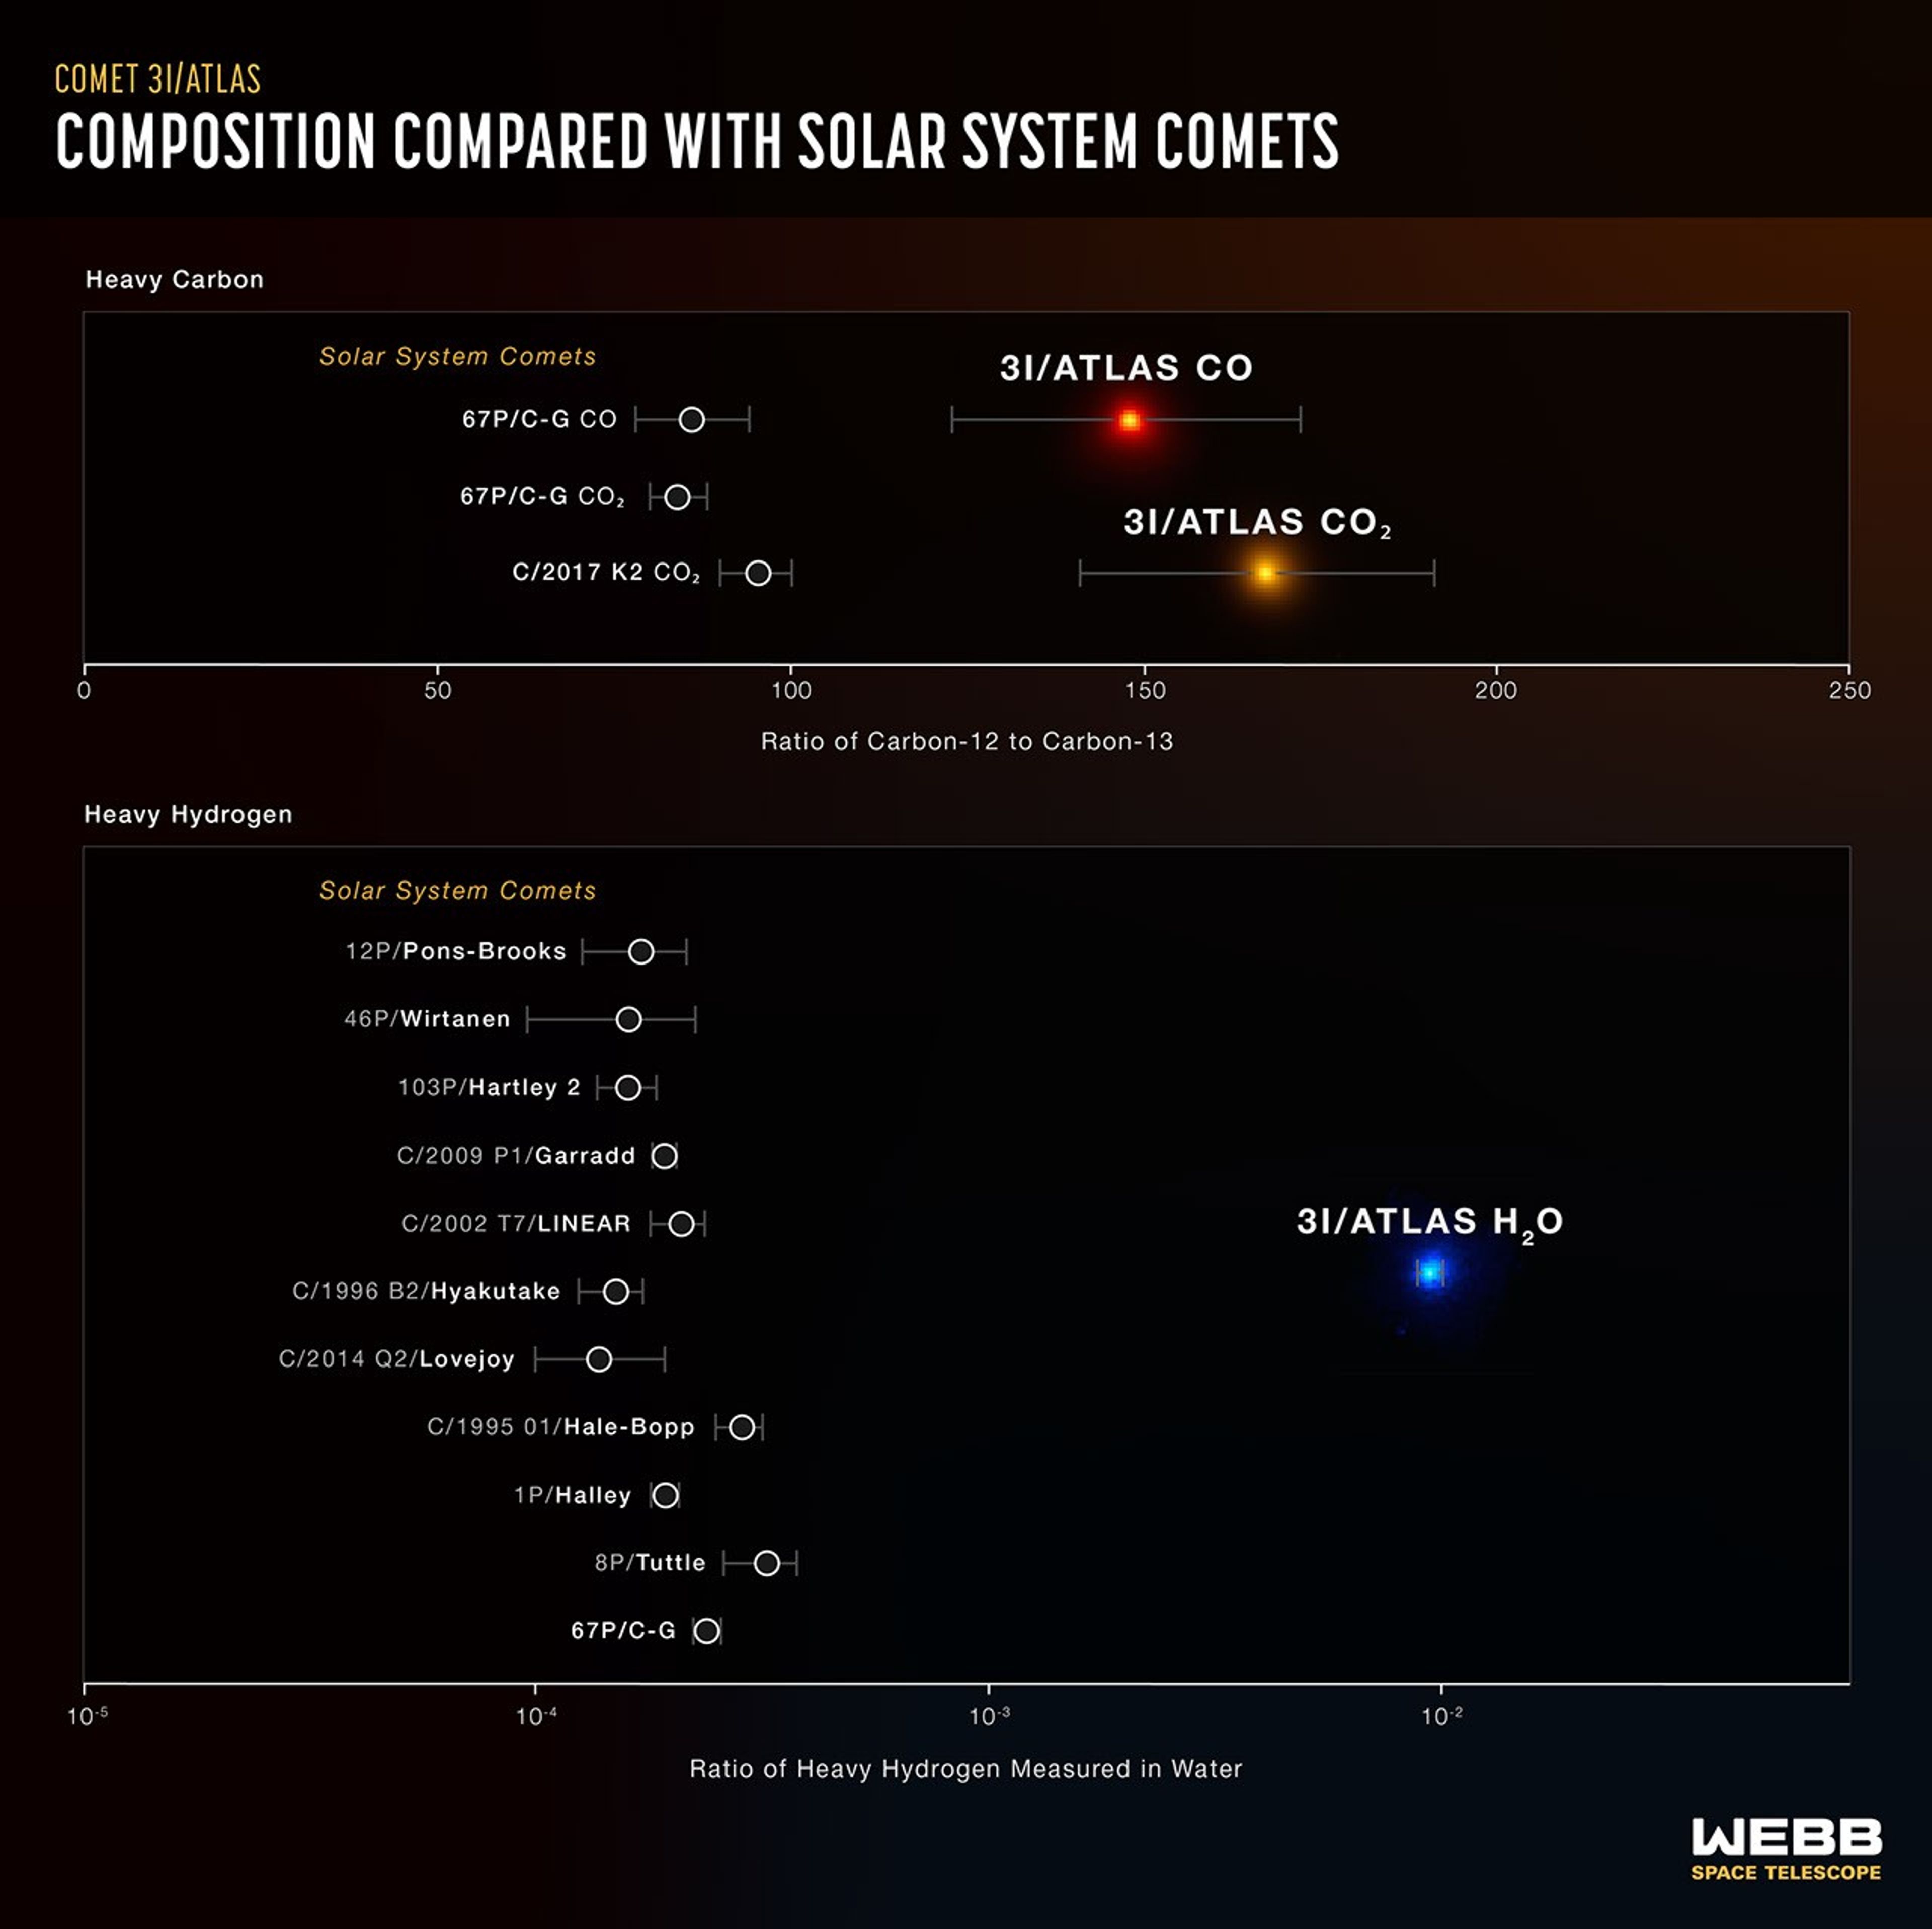
Infographic showing differences in measured ratios of heavy carbon and heavy hydrogen between solar system comets and interstellar comet 3I/ATLAS. Title text reads Comet 3I/ATLAS, Composition Compared With Solar System Comets. Top portion of the infographic has headline Heavy Carbon, plus a horizontal scale in increments of 50 ranging from zero to 250 measuring the ratio of Carbon-12 to Carbon-13. Three solar system comets appear just below 100 on the scale, while 3I/ATLAS appears above 150 for carbon monoxide and about 170 for carbon dioxide.  
Bottom portion of infographic has headline Heavy Hydrogen and a horizontal scale ranging from 10 to the negative fifth power on the left to approximately 10 to the negative first power on the right, though 10 to the first is not labeled. This scale is labeled Ratio of Heavy Hydrogen Measured in Water. Eleven solar system comets appear on the graph, all falling to the right of 10 to the negative fourth power. Comet 3I/ATLAS appears at 10 to the negative second power.
These graphs lay out the significant difference in composition between the interstellar comet 3I/ATLAS and comets originating in our solar system. This very specific data helps researchers build a picture of the comet’s original planetary system. 
Illustration: NASA, ESA, CSA, Martin Cordiner (CUA, NASA-GSFC), Leah Hustak (STScI)

Additionally, NIRSpec showed only traces of carbon-13 compared to lighter-weight carbon-12. This also points to a very old origin for 3I/ATLAS, as stellar systems become enriched with carbon-13 over time as generations of stars are born and die in the galaxy. That is why there are higher levels of carbon-13 in our system, around our Sun, which formed relatively recently, 4.5 billion years ago.

The research team estimates that 3I/ATLAS could have formed as long as 10 to 12 billion years ago, during the universe’s “cosmic noon,” when star formation was at its height. Its young origin system was likely ensconced in a relatively cold, dense cloud. The abundance of heavy water shows that 3I/ATLAS spent its formative years in a deeply frozen state. 

A separate study using the European Southern Observatory’s Very Large Telescope, led by astronomer Cyrielle Opitom of the University of Edinburgh, complements Webb’s findings with an analysis of 3I/ATLAS’s carbon and nitrogen varieties in the form of the chemical cyanide.

“For us as scientists, finding these rare isotopes is fascinating, but the bigger picture here is looking at the possibilities of prebiotic chemistry elsewhere in the galaxy,” said Stefanie Milam of NASA Goddard and co-author of the study with Cordiner. “So far, we know of only one place in the vast cosmos where chemical ingredients led to life – our solar system, our Earth. Analysis of these interstellar objects is a major step towards learning how common, or uncommon, the conditions for the evolution of life are in the universe.”

The James Webb Space Telescope is the world’s premier space science observatory. Webb is solving mysteries in our solar system, looking beyond to distant worlds around other stars, and probing the mysterious structures and origins of our universe and our place in it. Webb is an international program led by NASA with its partners, ESA (European Space Agency) and CSA (Canadian Space Agency).

To learn more about Webb, visit:

https://science.nasa.gov/webb

Downloads & Related Information

The following sections contain links to download this article’s images and videos in all available resolutions followed by related information links, media contacts, and if available, research paper and Spanish translation links.

Related Links

Read more: NASA’s Webb Detects Methane on Interstellar Comet 3I/ATLAS

Explore more: NASA’s 3I/ATLAS Observation Timeline

Watch: Interstellar Visitor is Fastest Comet Ever Recorded

Watch: ViewSpace | Interstellar Comet Measured

More Webb: News | Images | Science | Home Page

Share

Details

Last Updated
Jun 22, 2026
Contact
Media

Laura Betz
NASA’s Goddard Space Flight Center
Greenbelt, Maryland
laura.e.betz@nasa.gov

Leah Ramsay
Space Telescope Science Institute
Baltimore, Maryland

Christine Pulliam
Space Telescope Science Institute
Baltimore, Maryland

Powered by WPeMatico

Get The Details…

Signs of Thaw in the Bering Sea

Signs of Thaw in the Bering Sea


natural color
false color

Two large, partly snow-covered islands lie west of mainland Alaska. Sea ice fragments form swirling patterns in the ocean, and brown water lines part of the Alaskan coastline.
NASA Earth Observatory/Michala Garrison

A false-color satellite image shows two large islands west of mainland Alaska. Sea ice fragments appear light blue and form swirling patterns in the ocean. The land appears mostly light green, interrupted by many small ponds and a large river delta.
NASA Earth Observatory/Michala Garrison

Two large, partly snow-covered islands lie west of mainland Alaska. Sea ice fragments form swirling patterns in the ocean, and brown water lines part of the Alaskan coastline.
NASA Earth Observatory/Michala Garrison
A false-color satellite image shows two large islands west of mainland Alaska. Sea ice fragments appear light blue and form swirling patterns in the ocean. The land appears mostly light green, interrupted by many small ponds and a large river delta.
NASA Earth Observatory/Michala Garrison

natural color

false color


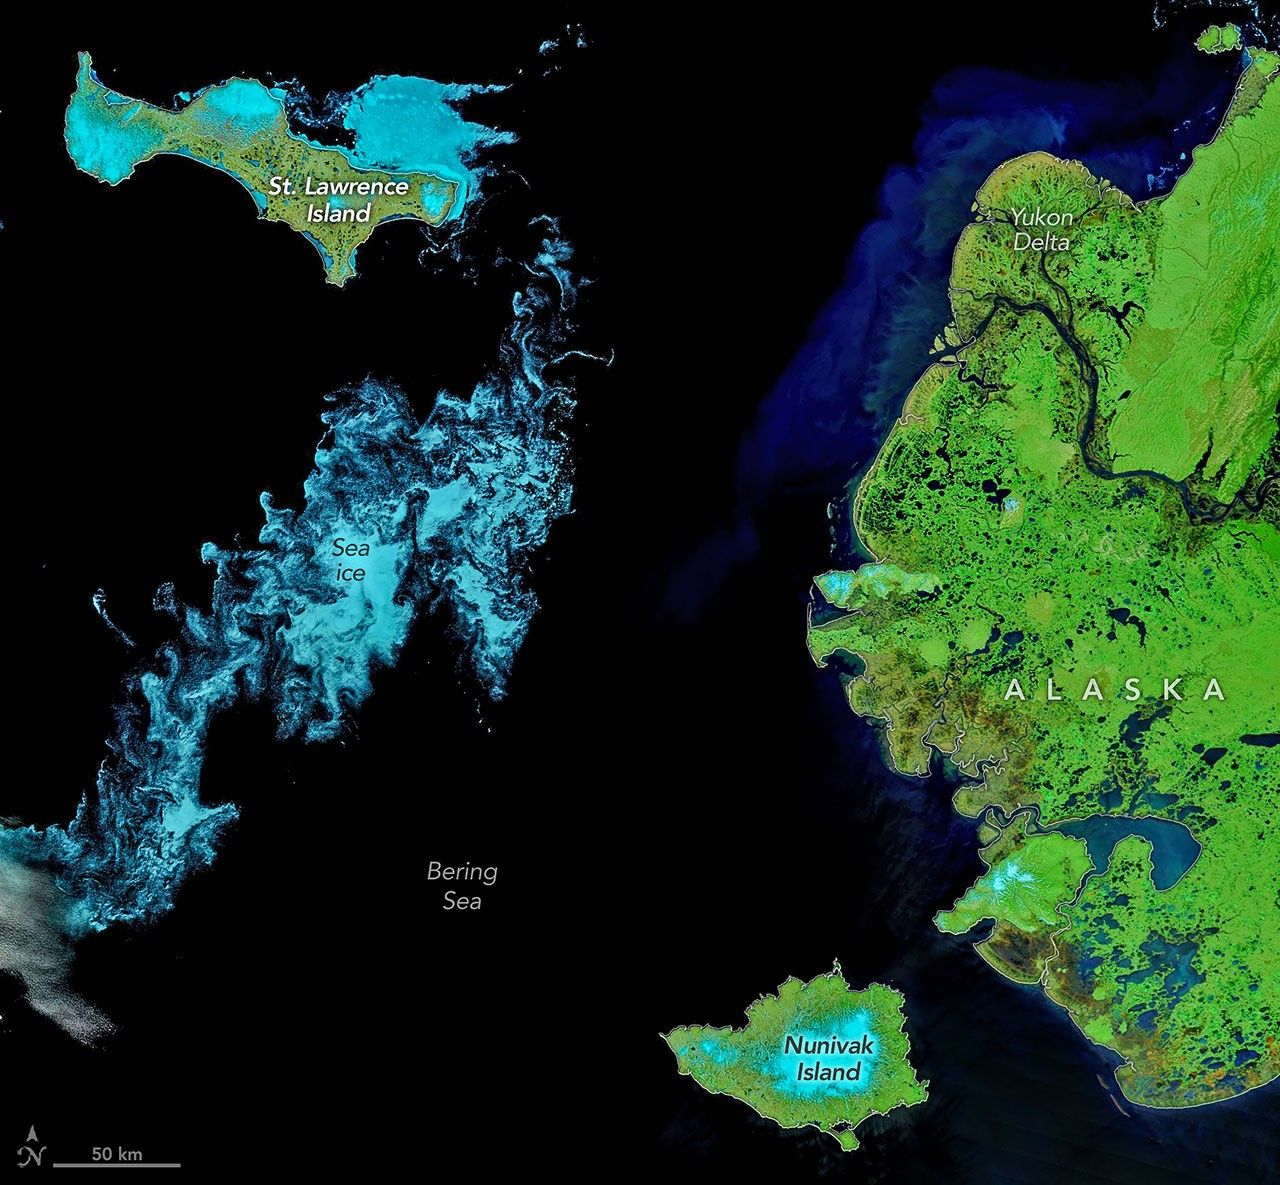
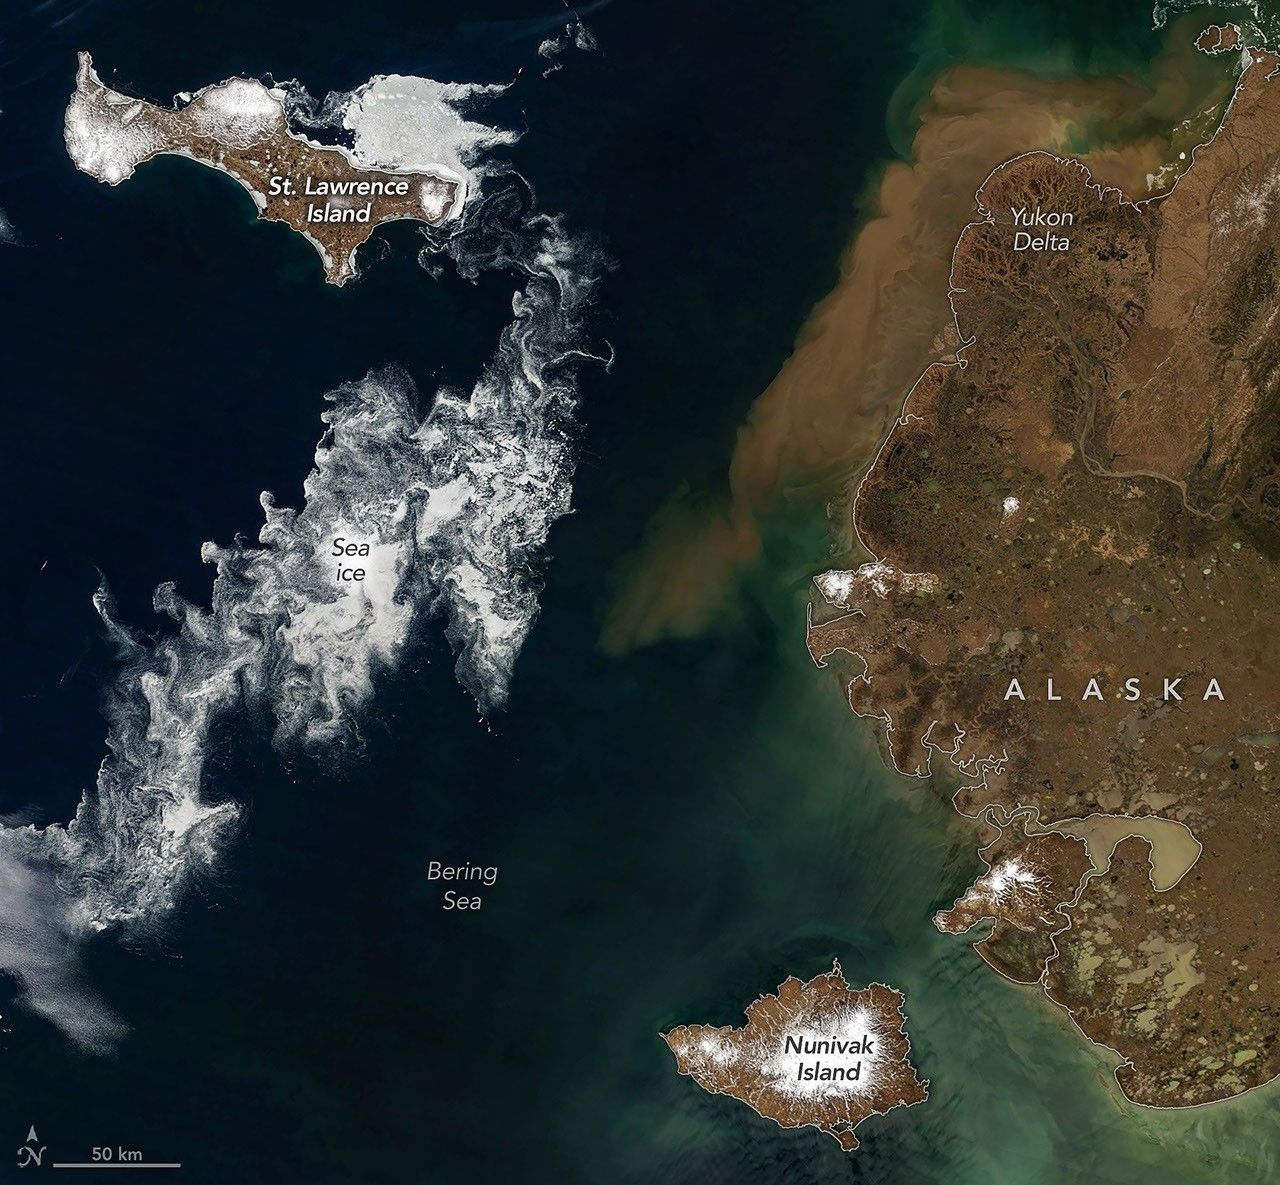
Sea ice fragments drift near Alaska’s Saint Lawrence and Nunivak islands and colorful water surrounds the Yukon Delta in natural-color (left) and false-color (right) images acquired with the MODIS (Moderate Resolution Imaging Spectroradiometer) on NASA’s Terra satellite on June 3, 2026. NASA Earth Observatory images by Michala Garrison.

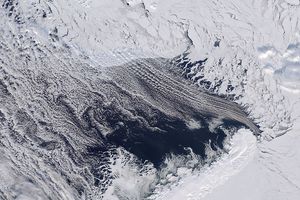
When clouds parted in early June 2026, satellites glimpsed hints of summer’s approach in the Bering Sea off Alaska’s coast. Sea ice, broken into small fragments, took a few final spins on its way to melting completely, while rivers swollen with snowmelt washed sediment and organic material out to sea.

These images, acquired with the MODIS (Moderate Resolution Imaging Spectroradiometer) on NASA’s Terra satellite on June 3, 2026, capture the seasonal transition. A false-color view of the area (right) brings out features of the landscape that are more subtle in the natural-color scene (left), as human eyes would see it. In false color, the tundra and marsh vegetation appear green, and ice-free rivers and thermokarst lakes are dark blue. Sea ice and snow, where they still linger, appear light blue.

Amid the seasonal phenomena playing out in the images stand Saint Lawrence and Nunivak islands. Both have volcanic origins and are among the largest islands in the United States. They contain extensive basaltic lava flows forming small shield volcanoes, along with other features such as cinder cones and maars, or low-lying volcanic craters.

Saint Lawrence Island lies about 150 miles (240 kilometers) directly south of the Bering Strait, separating Alaska and the Russian Far East. It is one of the few pieces of the land bridge that connected Asia and North America during the Pleistocene that remain above water. Pack ice persisted along the northeast side of the island in early June, while other sea ice drifted and curled into intricate patterns with the winds and currents. The smaller the ice fragments, the wispier their swirling patterns appear when observed by satellites.

Brownish water, likely containing a mixture of suspended sediment and colored dissolved organic matter, lines the coast of mainland Alaska. The colorful water appears to enter the sea around the Yukon Delta, a vast wetland where the Yukon River branches into many circuitous channels. Sediment concentrations in this area typically increase starting in late May or early June. That’s after river ice has broken up and runoff from rain and snowmelt carries eroded material downstream.

NASA Earth Observatory images by Michala Garrison, using MODIS data from NASA EOSDIS LANCE and GIBS/Worldview. Story by Lindsey Doermann.

References & Resources

You may also be interested in:

Stay up-to-date with the latest content from NASA as we explore the universe and discover more about our home planet.

Barents Sea Tied to Low Arctic Sea Ice

4 min read

Patches of open water in the region contributed to low sea ice extent across the Arctic in March 2026, which…

Article

Ice Moves Out of Aniak

3 min read

Spring melt along Alaska’s Kuskokwim River caused ice jams and flooding.

Article

Cañon Fiord’s Whirling Waters

3 min read

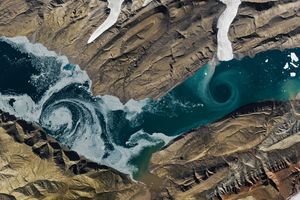
During the 2022 summer melt season, sediment plumes and fractured sea ice traced swirling eddies in a branch of the…

Article

Powered by WPeMatico

Get The Details…

Tropical Storm Arthur

Tropical Storm Arthur


Natural color
brightness temperature

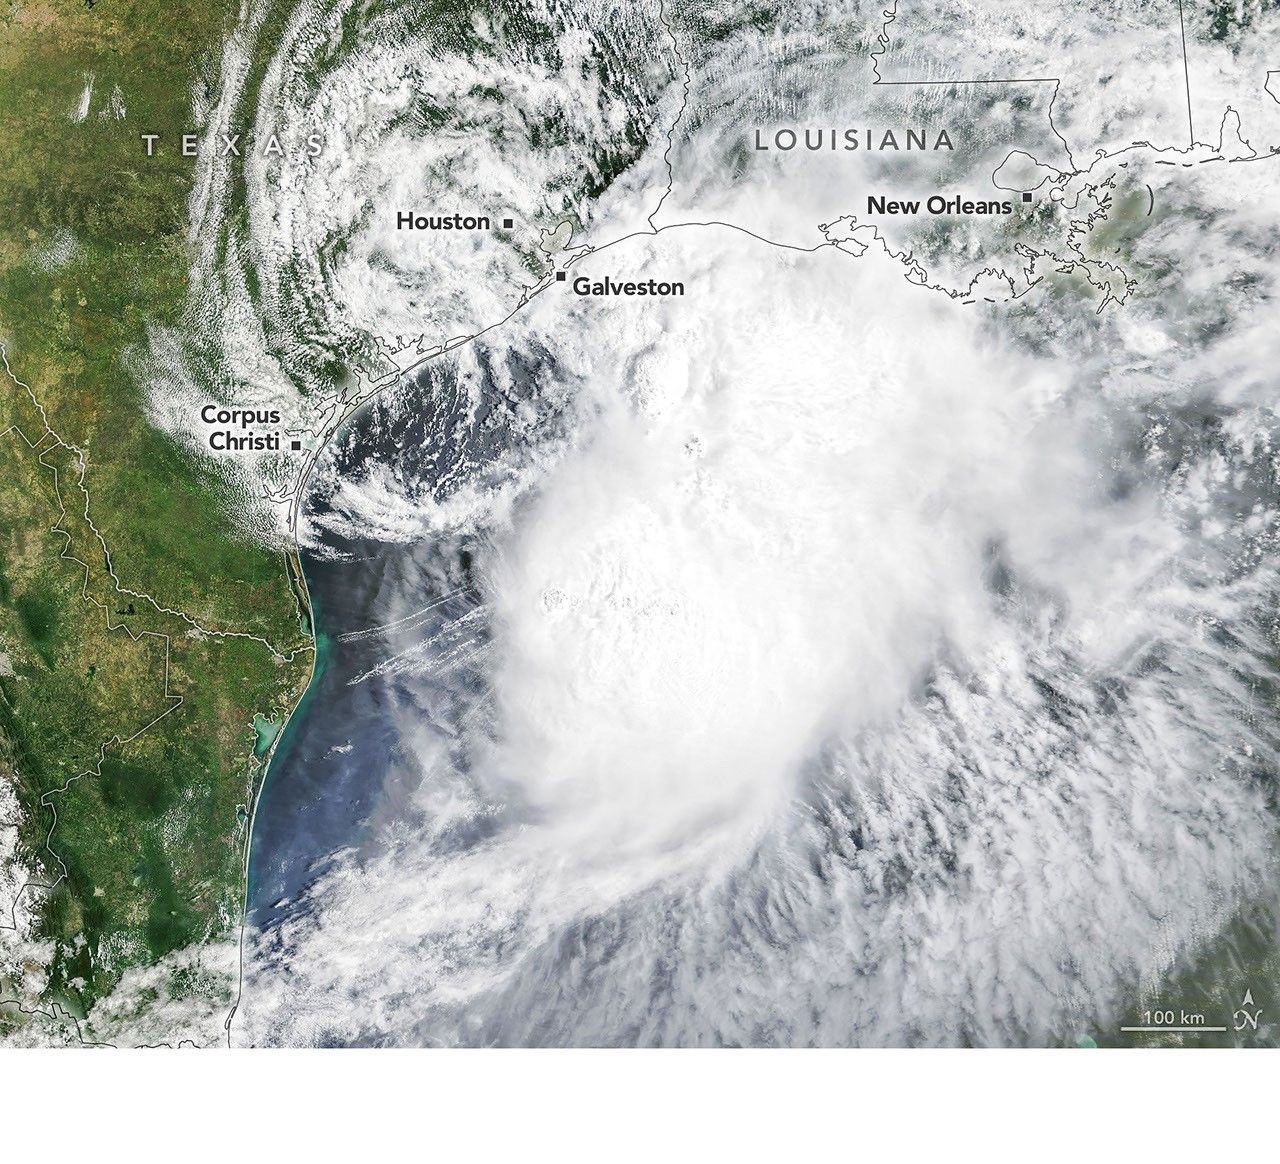
Tropical Storm Arthur’s white storm clouds cover the waters off the U.S. Gulf Coast. Some clouds extend inland over parts of Texas and Louisiana.
NASA Earth Observatory/Michala Garrison

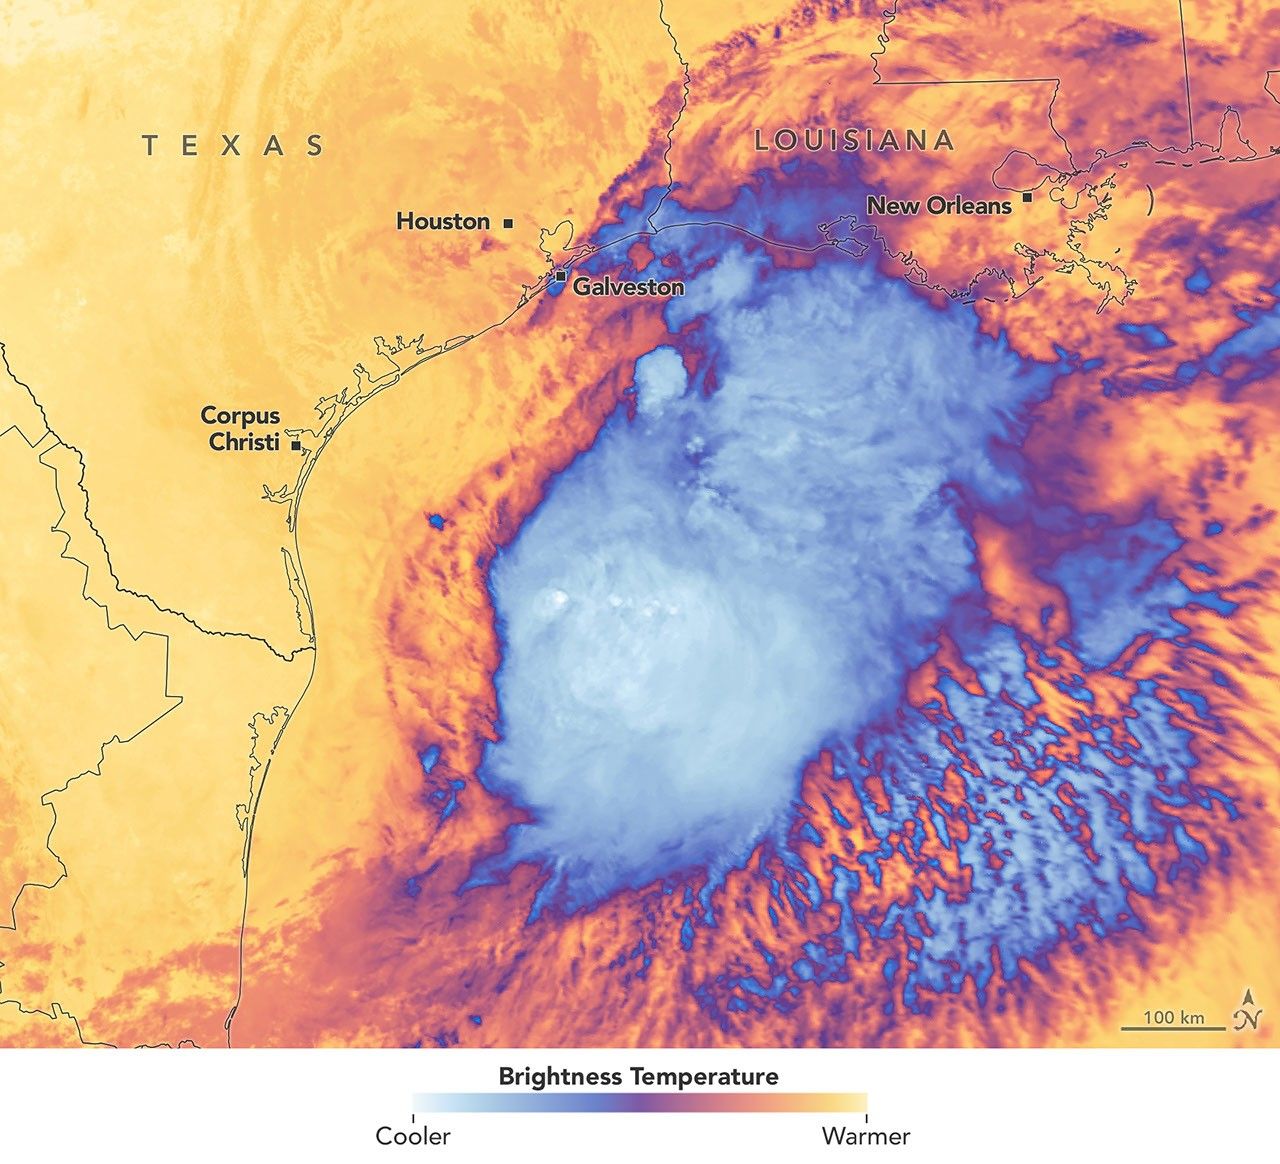
White and purple areas of cloud off the Gulf Coast indicate the cooler areas of cloud tops associated with Tropical Storm Arthur.
NASA Earth Observatory/Michala Garrison

Tropical Storm Arthur’s white storm clouds cover the waters off the U.S. Gulf Coast. Some clouds extend inland over parts of Texas and Louisiana.
NASA Earth Observatory/Michala Garrison
White and purple areas of cloud off the Gulf Coast indicate the cooler areas of cloud tops associated with Tropical Storm Arthur.
NASA Earth Observatory/Michala Garrison

Natural color

brightness temperature


Images from the MODIS (Moderate Resolution Imaging Spectroradiometer) on NASA’s Terra satellite show Tropical Storm Arthur on the morning of June 17, 2026. The left image is natural color; the right shows infrared signals known as brightness temperature. NASA Earth Observatory images by Michala Garrison.

Tropical Storm Arthur, the first named storm of the 2026 Atlantic hurricane season, brought high winds and heavy rain to the U.S. Gulf Coast in mid-June.

NASA’s Terra satellite captured this natural-color image (left) at 10:30 a.m. Central Time (15:30 Universal Time) on June 17. The second image (right) depicts infrared signals known as brightness temperature, which help distinguish cooler cloud tops (white and purple) from the warmer surface below (yellow and orange). Around the time these images were acquired, the system had just recently been designated a tropical storm, according to the National Hurricane Center (NHC).

Though Arthur stayed below hurricane strength, it still delivered strong winds to parts of the Gulf Coast as it tracked northeast. The storm had maximum sustained winds of 40 miles (65 kilometers) per hour around the time these images were captured. Tropical-storm-force winds extended 175 miles (280 kilometers) from the storm’s center, the NHC reported. Measurements at Galveston, Texas, for instance, showed a gust of 48 miles per hour.

The storm also produced heavy rainfall that the National Weather Service warned could lead to life-threatening flash flooding. Estimates from IMERG (the Integrated Multi-Satellite Retrievals for GPM), a product of the GPM (Global Precipitation Measurement) mission, showed high rainfall rates over Gulf waters and extending inland on June 17.

As Arthur weakened and became less organized, it continued to bring abundant moisture to central Gulf Coast states on June 18. The National Weather Service reported rainfall rates of 3 inches (7.6 centimeters) per hour in southeastern Louisiana. Forecasts indicated that storm-total rainfall amounts could exceed 12 inches (30 centimeters) in areas, with some locations seeing totals approaching 20 inches (51 centimeters).

NASA Earth Observatory images by Michala Garrison, using MODIS data from NASA EOSDIS LANCE and GIBS/Worldview. Story by Kathryn Hansen.

References & Resources

You may also be interested in:

Stay up-to-date with the latest content from NASA as we explore the universe and discover more about our home planet.

Typhoon Jangmi

2 min read

The sprawling storm promised to deliver torrential rain across a wide swath of southern Japan.

Article

Tropical Cyclone Narelle Crosses Australia

3 min read

The powerful storm lashed the northern edge of the continent with damaging winds and drenching rain as it made landfall…

Article

Super Typhoon Sinlaku

3 min read

The violent storm aimed at the U.S. Northern Mariana Islands and Guam in mid-April 2026.

Article

Powered by WPeMatico

Get The Details…

Curiosity Blog, Sols 4920-4926: Surveying the Bands

Curiosity Blog, Sols 4920-4926: Surveying the Bands

3 min read

Curiosity Blog, Sols 4920-4926: Surveying the Bands

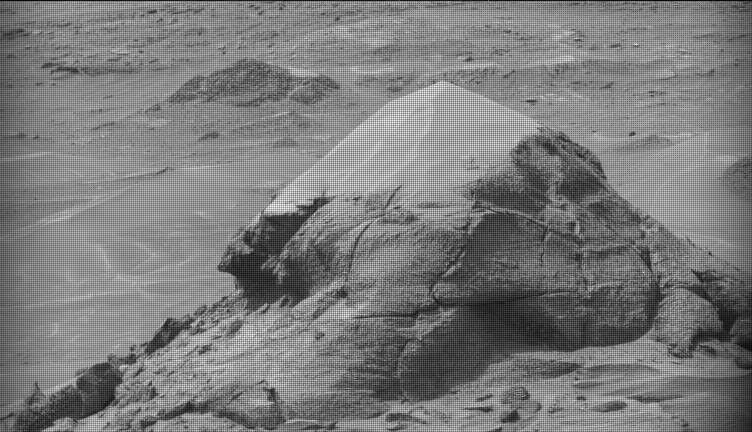
A black-and-white image of a barren Martian landscape featuring a prominent, roughly pyramidal rock outcropping in the foreground. The rock's lower half is rugged with deep cracks and textured layers, while its peak appears lighter and smoother, possibly covered in dust. The surrounding terrain stretches into the background with scattered smaller rocks and another low mound in the distance.
NASA’s Mars rover Curiosity acquired this image of small butte, “Miraflores,” using its Mast Camera (Mastcam) on June 11, 2026 — Sol 4922, or Martian day 4,922 of the Mars Science Laboratory mission — at 09:12:13 UTC.
NASA/JPL-Caltech/MSSS

Written by William Farrand, Senior Research Scientist, Space Science Institute

Earth planning date: Friday, June 12, 2026

Rather than going from stage to stage at a music festival to hear different bands playing different varieties of music, Curiosity has been ascending up Mount Sharp through physical bands of exposed rocks with textural and tonal differences.

Planning for sols 4920 and 4921 were done with the rover in the middle of a unit with a rougher texture and dark-toned bedrock. With the rougher-textured bedrock, brushing wasn’t possible, but APXS chemistry and MAHLI micro-imaging were planned on “as is” bedrock targets “Salto La Cascada” and “Puerto de Rosas.” ChemCam was targeted to perform LIBS spectroscopy on a bedrock target “Kishuara” and a small, layered float rock “La Rosita.” ChemCam’s Remote Micro-Imager (RMI) collected views of the “Mishe Mokwa” butte and another looking at dunes with tonal differences. Mastcam mosaics were collected on the “Valle Grande” channel, “Kimsa Chata” butte, nearby troughs, and the aircraft carrier shaped rock “El Matir.”

Another drive brought Curiosity closer to the upper border of the dark-toned band. Again, brushing of the rocks was not possible, but APXS and MAHLI were collected on dark-toned bedrock targets “Santa Gracia” and “Laguna San Rafael” with ChemCam LIBS also targeting the bedrock. Mastcam mosaics were collected of a layered rock and nearby troughs and a mosaic of the nearby smaller butte, “Miraflores” which displays an interesting layered structure with ragged dark-toned rocks on one side and a stack of dust piled on top (see accompanying image). Other activities included a long-distance RMI mosaic of a bright unit on “Mishe Mokwa”, and Navcam dust-devil surveys in both sols.

Communicating between Earth and Mars has come to seem routine, but at times can still be a challenging endeavor and this was demonstrated to the team on Friday when we did not get a timely downlink of data for the drive planned for Sol 4923. Without these images another drive, in situ examinations, or targeted remote sensing could not be planned. However, there are always interesting things to be done on Mars and the three-sol plan (4924 to 4926) included a 360-degree Mastcam mosaic, the automatic AEGIS targeting of LIBS measurements on each sol, a Navcam dust-devil survey, APXS atmospheric measurements, as well as several other environmental activities.

On Monday, the delayed downlink will be used to plan the first investigation of the next band of surface materials, this one being smooth-textured and light-toned, as well as another drive to continue the surveying of the bands.

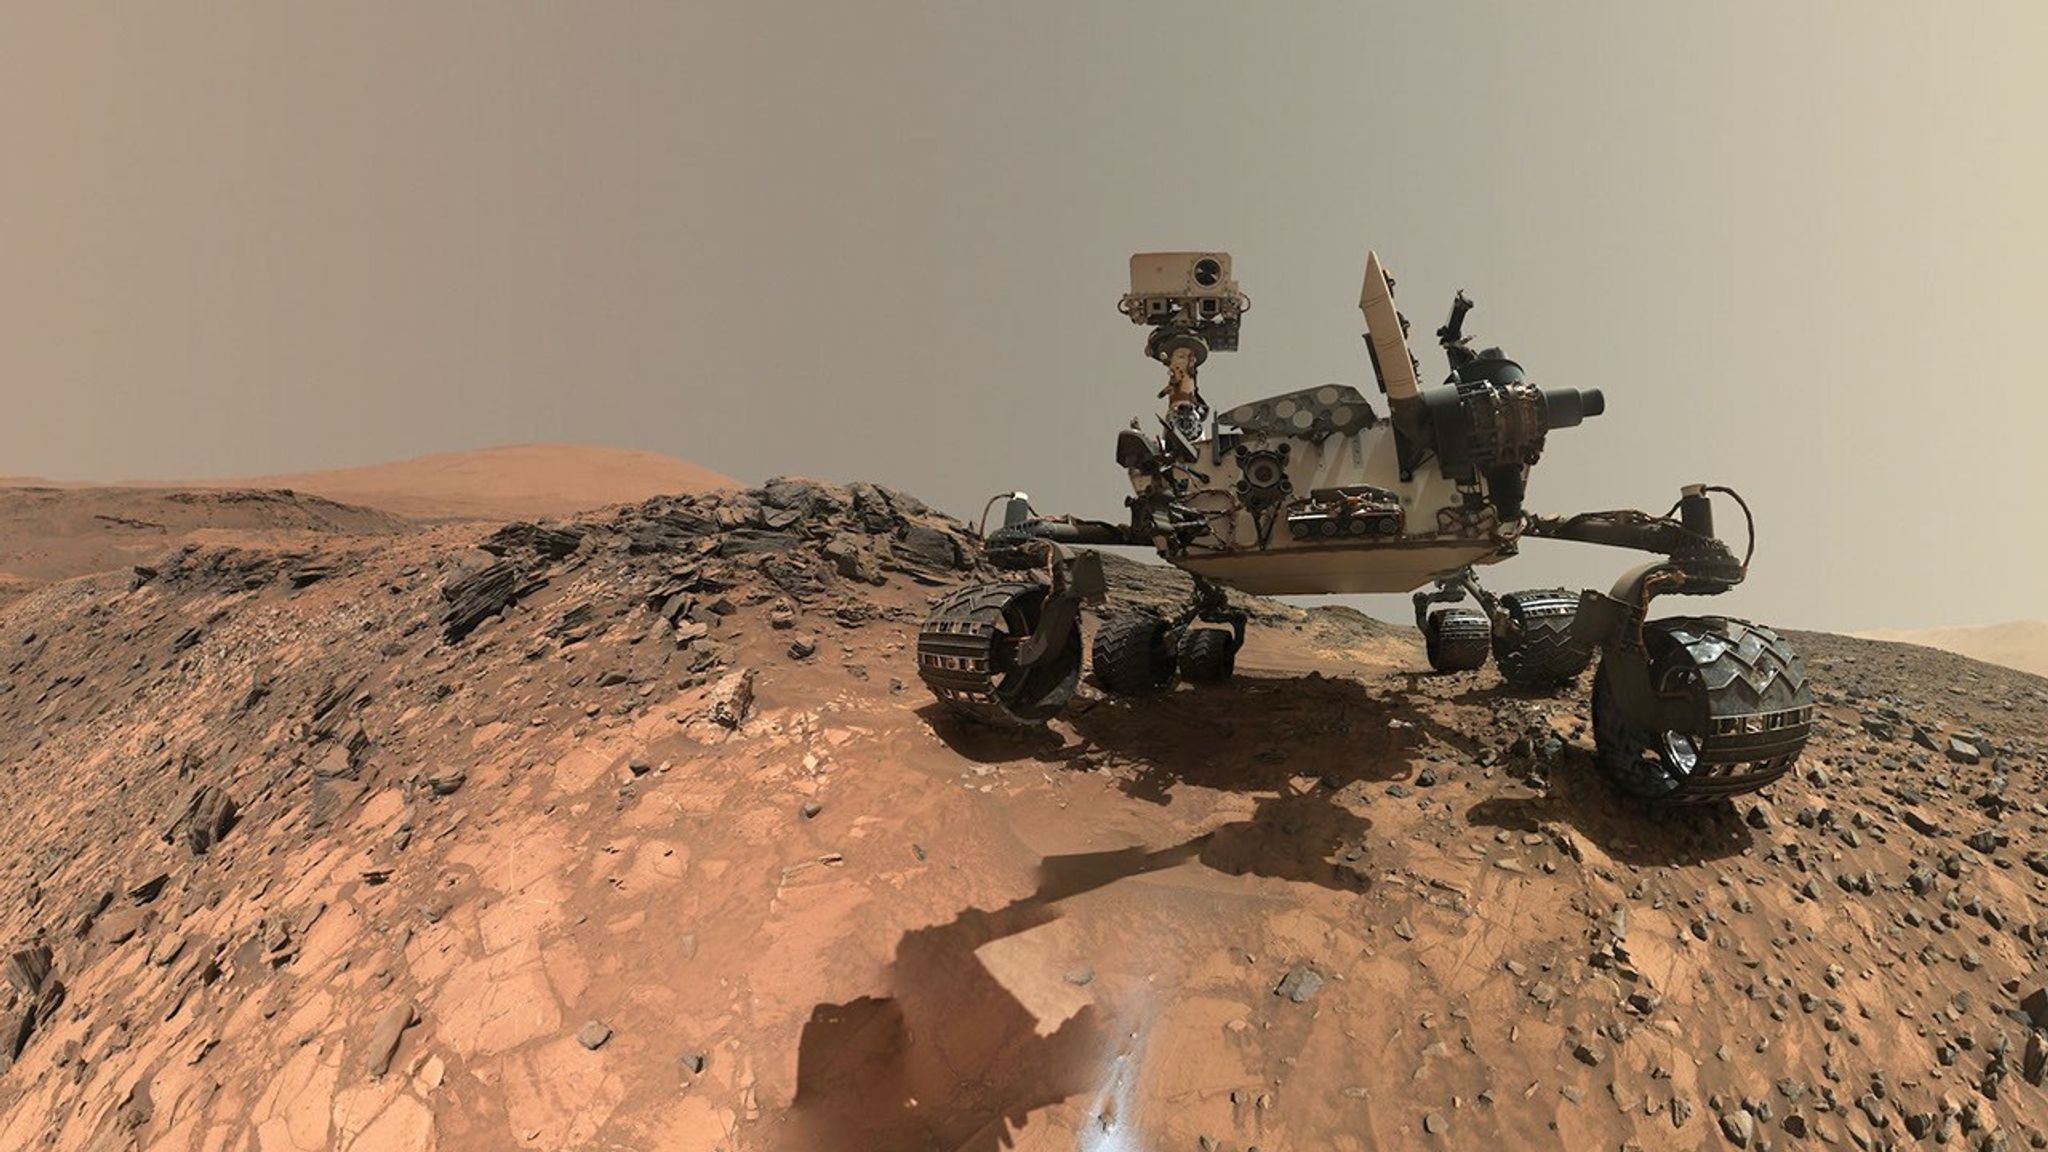
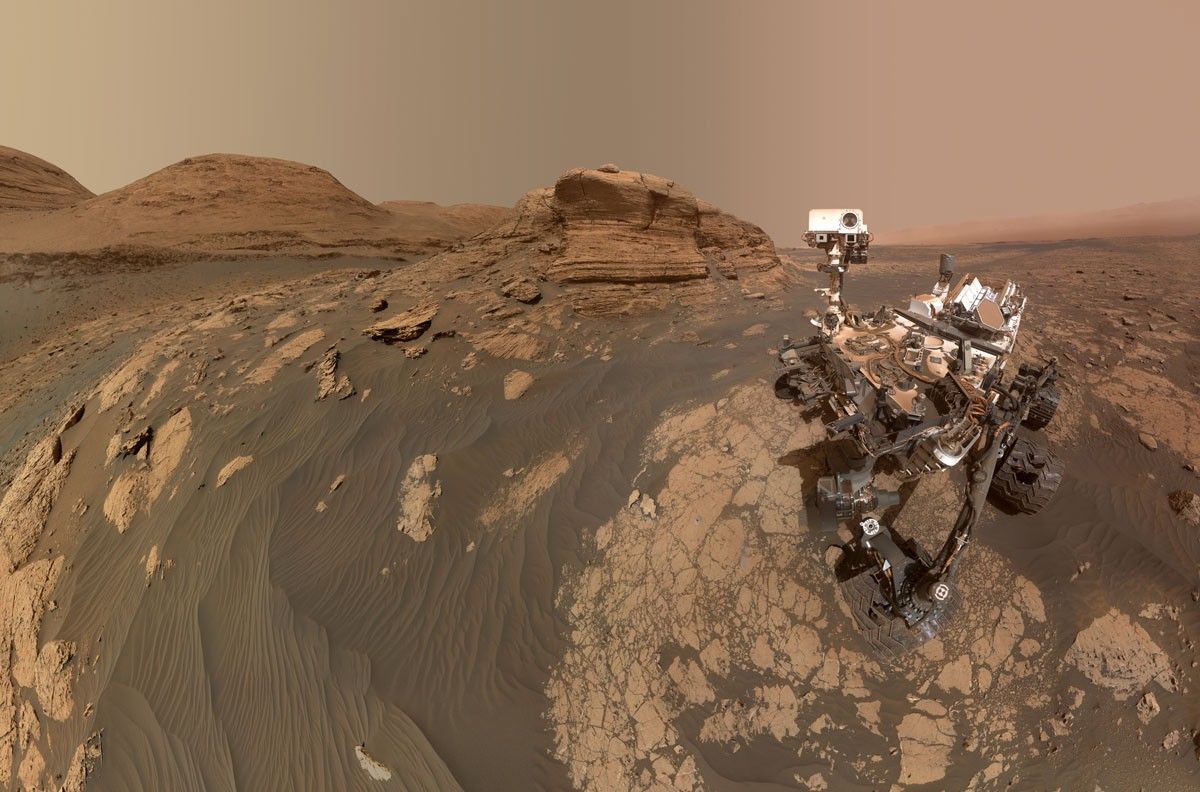
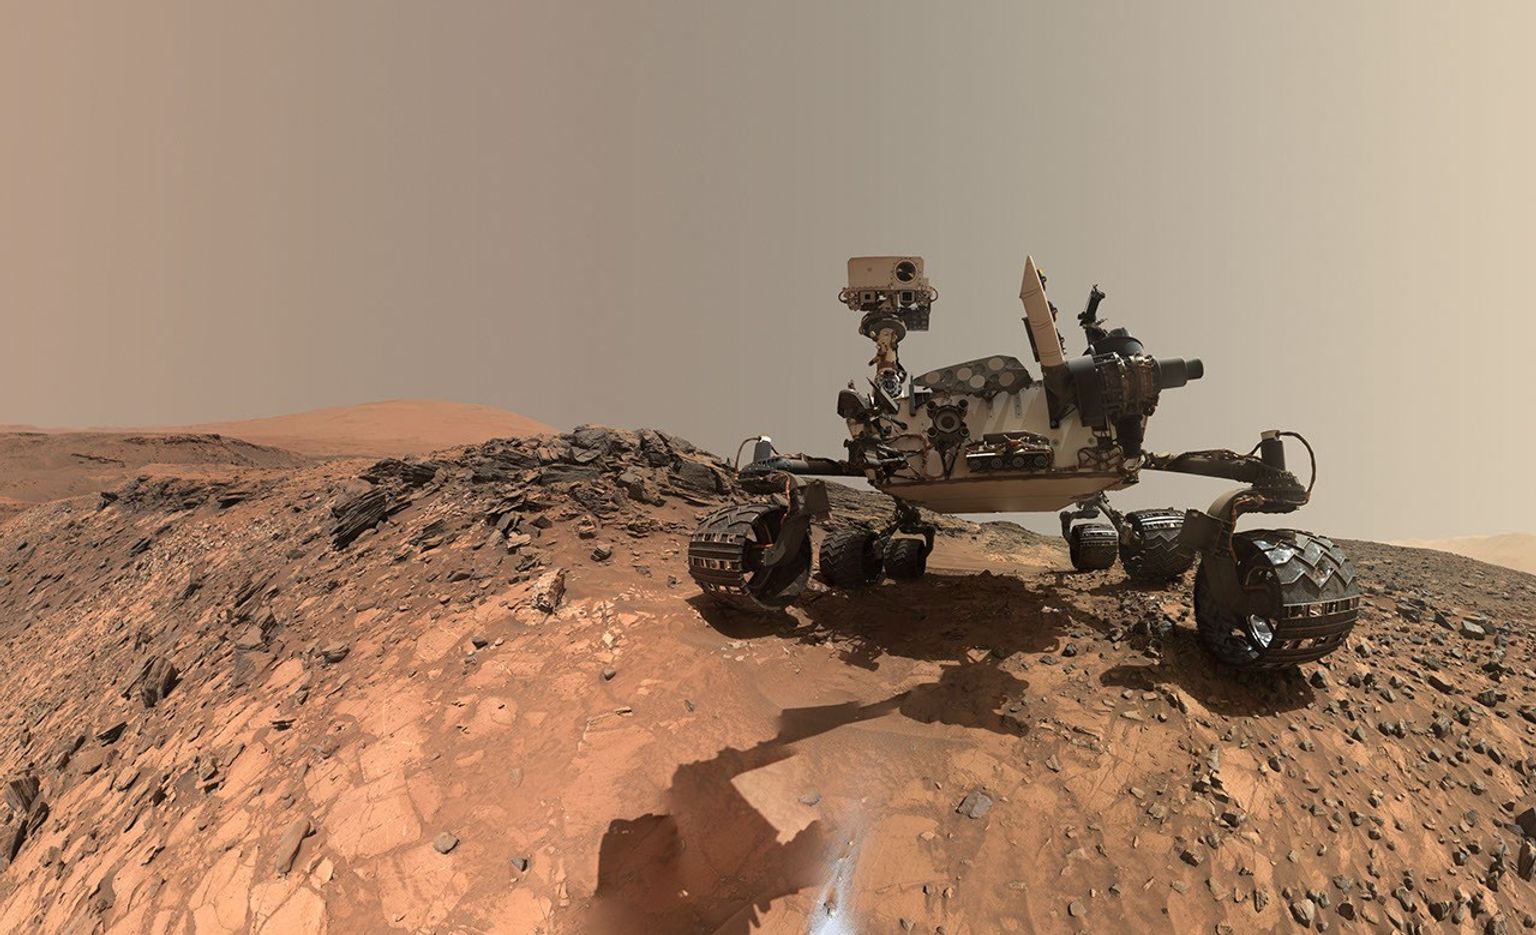
A rover sits on the hilly, orange Martian surface beneath a flat grey sky, surrounded by chunks of rock.
NASA’s Curiosity rover at the base of Mount Sharp
NASA/JPL-Caltech/MSSS

Share

Details

Last Updated
Jun 18, 2026

Related Terms

Powered by WPeMatico
Get The Details…

NASA Mission to Study Space Weather Impacts of Earth’s Atmosphere

NASA Mission to Study Space Weather Impacts of Earth’s Atmosphere

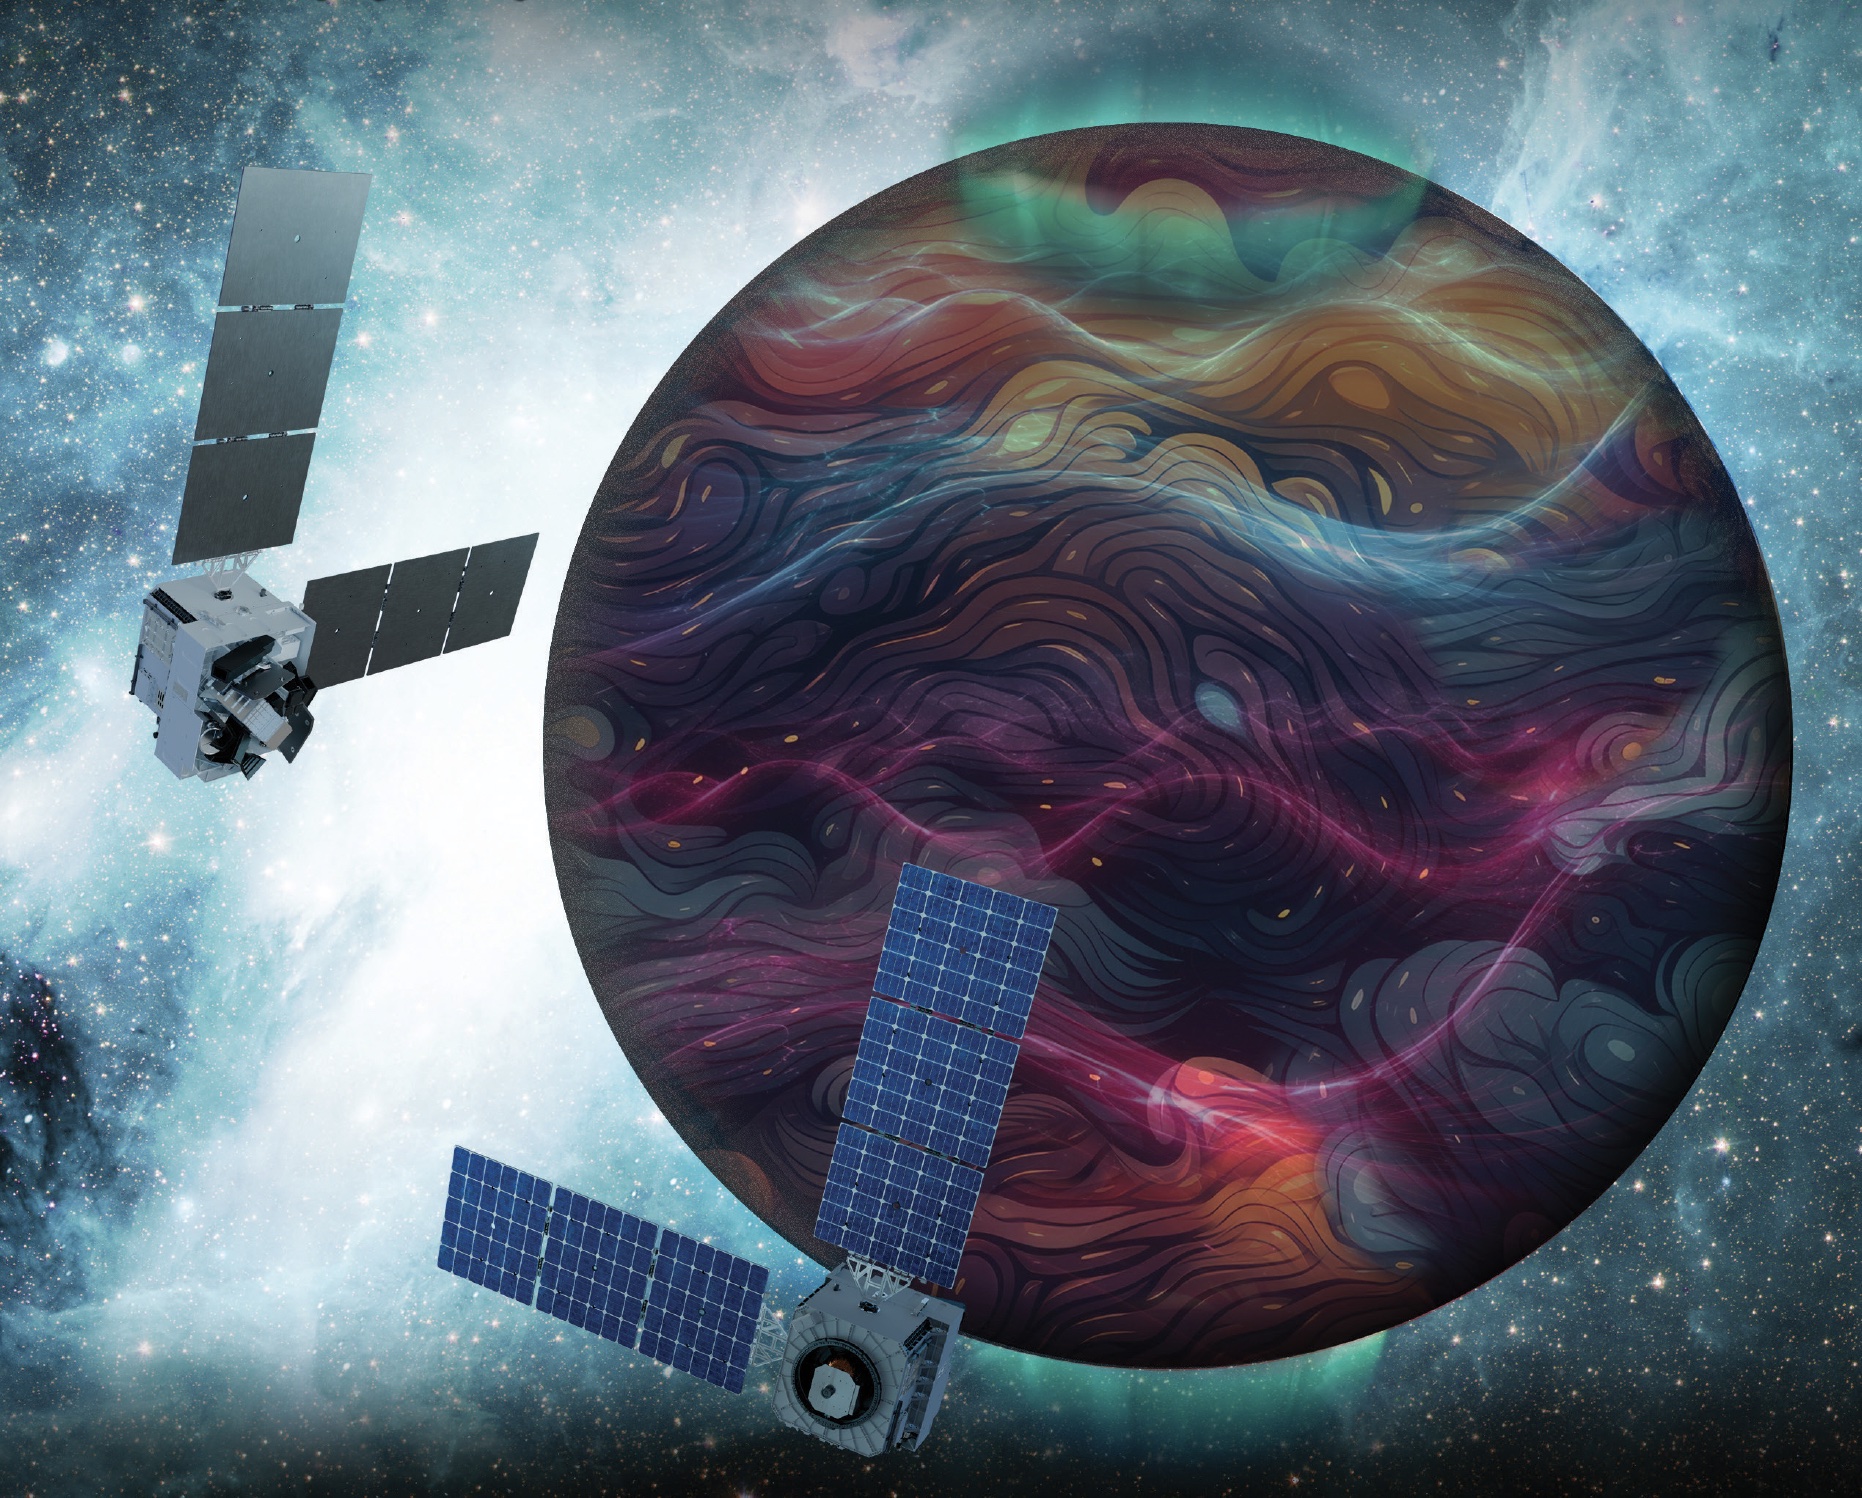
Artist’s rendition of the DAPHNE (Dynamic Atmosphere-Ionosphere Explorer) mission concept.
Artist’s rendition of the DAPHNE (Dynamic Atmosphere-Ionosphere Explorer) mission concept. The coloring represents auroras and atmospheric waves in Earth’s atmosphere.
Credit: Laboratory for Atmospheric and Space Physics/Mary Tostanoski

NASA selected a mission concept to research how space weather and dynamics within Earth’s atmosphere influence the space environment and help improve prediction capabilities for impacts on crucial technology, such as GPS and low Earth orbit satellites, as well as astronauts in space.

The DAPHNE (Dynamic Atmosphere-Ionosphere Explorer) mission will enter Phase B of development, which includes planning and design for flight and mission operations. It will use identical twin satellites to study how changes in Earth’s lower atmosphere influence our planet’s upper atmosphere, where space weather is manifested.

“NASA is advancing the United States’ leadership as a space weather-ready nation, and by providing new insights into Earth’s atmosphere we can better predict and prepare for impacts in our daily lives on Earth and in space,” said Nicky Fox, associate administrator, Science Mission Directorate, NASA Headquarters in Washington. “As NASA sends astronauts beyond Earth’s magnetic protection to the Moon, Mars, and beyond, DAPHNE will join the NASA science fleet strategically located across the solar system to provide data that will help mission planners predict and mitigate the effects of space weather for the benefit of all.”

The DAPHNE mission’s low-risk high-return concept will provide coordinated, multi-point measurements of neutral winds, temperature, and composition in the thermosphere. The ionosphere and thermosphere regions are where Earth’s neutral atmosphere transitions into the ionized plasma of space. In this thin shell that surrounds the planet, the atmosphere is in constant motion, shaped by the influence of solar activity and changes in the lower atmosphere and in near-Earth space.

Fundamental observations and physical insights from the DAPHNE mission will incorporate lower-atmospheric energy data to advance space weather predictive capabilities. The mission is led by Aimee Merkel from the Laboratory for Atmospheric and Space Physics at the University of Colorado, Boulder.

The mission will be subject to a confirmation review in 2027, which will assess the progress of the mission and the availability of funds. If confirmed, the total estimated cost of the mission, excluding launch, will not exceed $250 million in fiscal year 2023 dollars, with a mission launch date of no earlier than 2029.

The DAPHNE mission was proposed as a concept study in response to the DYNAMIC (Dynamical Neutral Atmosphere-Ionosphere Coupling) mission announcement of opportunity. Funding and management oversight for this mission is provided by the Solar Terrestrial Probes program at NASA’s Goddard Space Flight Center in Greenbelt, Maryland.

For more information on NASA’s heliophysics missions, visit:

https://science.nasa.gov/heliophysics

-end-

Abbey Interrante / Karen Fox
Headquarters, Washington
202-358-1600
abbey.a.interrante@nasa.gov / karen.c.fox@nasa.gov

Share

Details

Last Updated

Jun 18, 2026

Powered by WPeMatico
Get The Details…
Lauren E. Low