


GVIS Test Facilities Visualizations
GVIS Test Facilities Visualizations
NASA GVIS
The Graphics and Visualization Lab (GVIS) at NASA Glenn Research Center creates a variety of immersive visualizations and simulations in support for NASA’s missions, projects, and future innovations. These visual tools help scientists, engineers, and researchers develop solutions to bring their projects to life.
Test Facility Models
GVIS creates visualizations of various NASA test facilities. These visualizations include interactive tours, digital replications of facilities, 3D models, and demonstrations of facility tests. Test facility visualizations are useful tools for customers, developers, and curious minds. They give researchers the ability to visit and explore test facilities from afar, reducing travel costs and allow developers to experience a facility in its entirety before construction has been completed.
“We have had senior management see our visualizations after seeing the actual test facility and say that the visualization helped them understand the facility better than seeing the facility itself.” says GVIS Lab manager Herb Schilling.
Tours of test facilities are typically given outside of actual testing operations. Those unaffiliated with the testing facility aren’t able to experience the facility in full, which makes creating test facility visualizations so vital. With these visualizations, visitors are able to see every corner of the facility as well as experience a test demonstration. Visualizations can also create experiences that would not typically be possible to see in person.
The visualization helped them understand the facility better than seeing the facility itself.

Herb schilling
GVIS Lab Manager
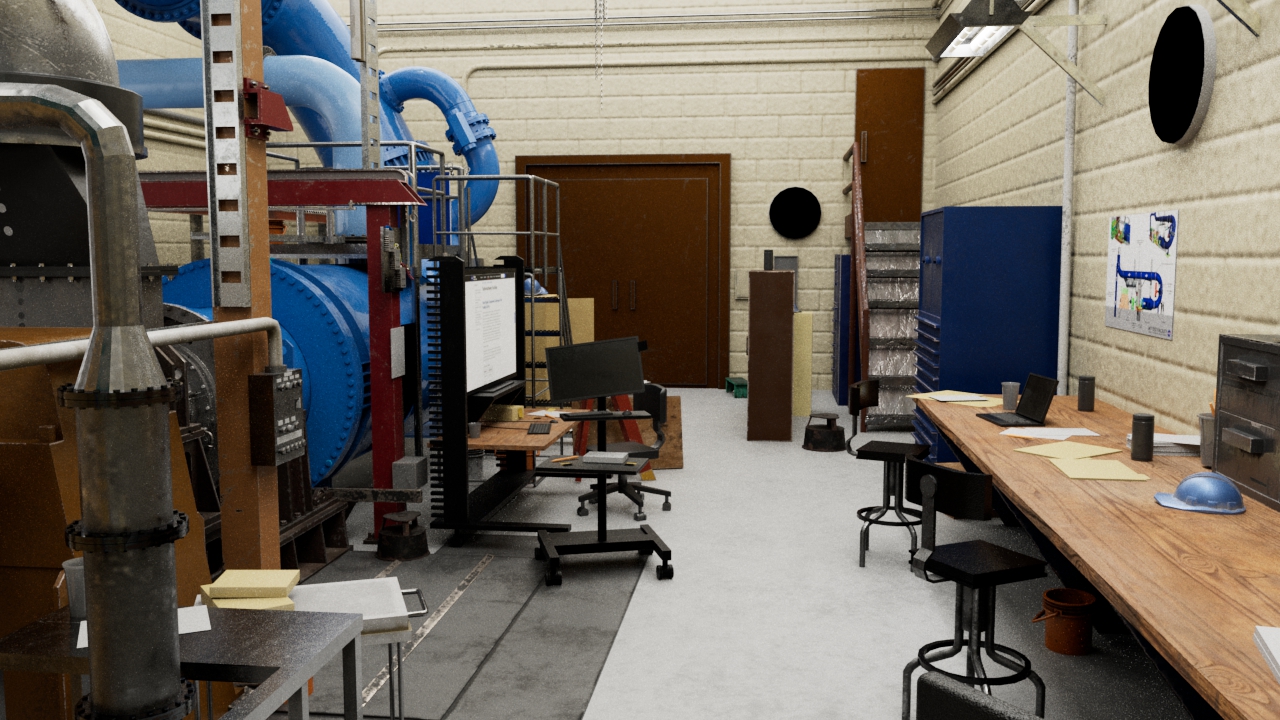
GVIS creates to-scale visualizations of various NASA facilities. Shown above and below are fly-throughs of two facilities: The High Speed Multistage Compressor Facility (W-7) and the NASA Electric Aircraft Testbed (NEAT) Facility. These visualizations can be interacted with in a multitude of ways, including in virtual reality. These visualizations are immersive, detailed, and offer “to-scale” experiences where users can feel as if they were actually visiting the facility. With a simple headset, users are transported to NASA facilities across the country. without ever needing to leave their center.
GVIS also creates 3D printed models of facilities, such as the altitude chamber of NEAT facility. 3D printed facility models allow for innovation and collaboration, and can offer new perspectives. These prints are life-like, to-scale, contain movable parts, and are easily transportable.
Test Facility Demonstrations
In addition to creating virtual models of test facilities, the GVIS Lab creates demonstrations of tests and facility functions. Tests are seldom performed for visitors and guests, and offering demonstrations of facility functions privides an unique perspective.
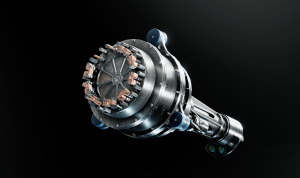
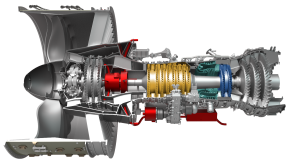
The GVIS Lab is developing an extended reality (XR) demonstration of a small engine test in the Aero-Acoustic Propulsion Laboratory (AAPL), a world-class facility for conducting aero-propulsion noise-reduction research. The demo is of the DGEN AeroPropulsion Research Turbofan, or DART, an experimental aeroacoustic and aero-performance test bed. This video showcases an interactive demonstration of the testbed, allowing users to manipulate microphones and the engine in order to achieve various audio outputs. Test demonstrations like these allow users to experience a facility without having to step foot into it.
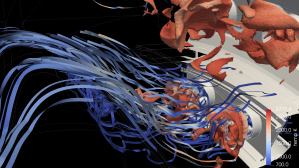
The above visualization is of the Adaptive Icing Tunnel (AIT), a vertical icing wind tunnel currently in development. This visualization demonstrates the future capabilities of the facility, which can produce air speeds up to 110 meters per second and can reach temperature as low as -20º C. As the facility is still in development, a visualization is useful for its engineers, future customers, and public for a greater understanding of the potential usefulness of the AIT.
Contact Us
Need to reach us? In need of a visualization? You can send an email directly to the GVIS Team (GRC-DL-GVIS@mail.nasa.gov).
About the Author
Amanda Fanale
Share
Details
Related Terms
Explore More


Powered by WPeMatico
Get The Details…
Amanda Fanale
