Últimos preparativos para la primera misión tripulada a la Luna con la campaña Artemis de la NASA
Read this article in English here.
Conforme la NASA se acerca al lanzamiento del vuelo de prueba Artemis II, la agencia pronto llevará por primera vez su cohete Sistema de Lanzamiento Espacial (SLS, por sus siglas en inglés) y la nave espacial Orion a la plataforma de lanzamiento en el Centro Espacial Kennedy de la agencia en Florida para comenzar la integración final, las pruebas y los ensayos para el lanzamiento.
La NASA tiene como objetivo comenzar desde el sábado 17 de enero su traslado desde el Edificio de Ensamblaje de Vehículos hasta la Plataforma de Lanzamientos 39B, lo que tardará varias horas. El viaje de casi 6,5 kilómetros (cuatro millas) en el vehículo transportador oruga 2 podría durar hasta 12 horas. Los equipos técnicos están trabajando día y noche para dar por terminadas todas las tareas antes del transporte del cohete. Sin embargo, esta fecha objetivo está sujeta a cambios si fuera necesario tiempo adicional para los preparativos técnicos o debido a las condiciones meteorológicas.
“Nos estamos acercando a la misión Artemis II, y tenemos su lanzamiento a la vuelta de la esquina”, dijo Lori Glaze, administradora asociada interina para la Dirección de Misiones de Desarrollo de Sistemas de Exploración de la NASA. “Nos quedan pasos importantes en nuestro camino hacia el lanzamiento, y la seguridad de la tripulación seguirá siendo nuestra principal prioridad en todo momento, a medida que nos acercamos al regreso de la humanidad a la Luna”.
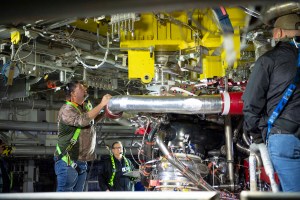
Al igual que con todos los nuevos desarrollos de sistemas complejos, los ingenieros han estado solucionando varios problemas en los últimos días y semanas. Durante las comprobaciones finales antes del traslado, los técnicos detectaron que un cable relacionado con el sistema de terminación de vuelo estaba doblado en contra de las especificaciones. El personal técnico lo está reemplazando y hará pruebas con el nuevo cable durante el fin de semana. Además, una válvula relacionada con la presurización de la escotilla de Orion presentó problemas que hicieron necesario llevar a cabo pruebas de demostración de la cuenta regresiva el 20 de diciembre pasado. El 5 de enero, el equipo reemplazó la válvula e hizo pruebas de su funcionamiento que resultaron exitosas. Los ingenieros también trabajaron para resolver fugas en el hardware de soporte en tierra que es necesario para cargar oxígeno gaseoso en Orion a fin de proporcionar aire respirable.
Traslado
Una vez que el cohete y la nave espacial integrados lleguen a la plataforma de lanzamiento, la NASA comenzará inmediatamente una larga lista de verificación para los preparativos en la plataforma de lanzamiento, incluyendo la conexión de equipos mecánicos de apoyo en tierra, como líneas eléctricas, conductos del sistema de control ambiental de combustible y tomas de surtido de combustible criogénico. Los equipos de personal técnico encenderán todos los sistemas integrados en la plataforma por primera vez para garantizar que los componentes del hardware de vuelo funcionen correctamente entre sí, con el lanzador móvil y con los sistemas de infraestructura terrestre.
Una vez que esté todo completado, los astronautas de Artemis II, Reid Wiseman, Victor Glover y Christina Koch de la NASA, y el astronauta de la CSA (Agencia Espacial Canadiense) Jeremy Hansen, llevarán a cabo una caminata final en la plataforma.
Ensayo general con circulación de combustible y llenado de tanques
A finales de enero, la NASA llevará a cabo un ensayo general con circulación de combustible, el cual es una prueba previa al lanzamiento para llenar los tanques de combustible en el cohete. Durante este ensayo general, el personal técnico hace una demostración de la capacidad de cargar más de 700.000 galones de combustible criogénico en el cohete, lleva a cabo una cuenta regresiva para el lanzamiento y practica la extracción segura del combustible del cohete sin tripulación presente en el sitio.
Durante el lanzamiento, el equipo de cierre, o de tareas finales, será responsable de asegurar a los astronautas en Orion y cerrar sus escotillas. El personal de cierre también utilizará este ensayo para practicar sus procedimientos de forma segura sin tener tripulación a bordo de la nave espacial.
El ensayo general con circulación de combustible incluirá varios “encendidos”, o pruebas de funcionamiento, para demostrar la capacidad del equipo de lanzamiento para detener, reanudar y reiniciar operaciones en varios momentos diferentes de los últimos 10 minutos de la cuenta regresiva, conocida como conteo terminal.
La ejecución del primer encendido comenzará aproximadamente en las 49 horas antes del lanzamiento, cuando los equipos encargados de lanzamiento son llamados a sus estaciones, hasta 1 minuto y 30 segundos antes del lanzamiento, seguido de una pausa planificada de tres minutos y luego la reanudación de la cuenta regresiva hasta 33 segundos antes del lanzamiento, el punto en el que el secuenciador de lanzamiento automático del cohete controlará los últimos segundos de la cuenta regresiva. Luego, los equipos técnicos volverán a reiniciar a T-10 minutos y detendrán el conteo, y luego reanudarán los procedimientos hasta 30 segundos antes del lanzamiento como parte de una segunda ejecución.
Si bien la NASA ha integrado las lecciones aprendidas con Artemis I en los procedimientos de la cuenta regresiva para el lanzamiento, la agencia hará una pausa para abordar cualquier problema durante la prueba o en cualquier otro momento si surgen retos técnicos. Los ingenieros vigilarán de cerca la carga de combustible de hidrógeno líquido y oxígeno líquido en el cohete, después de los desafíos que se encontraron con la carga de hidrógeno líquido durante los ensayos generales con circulación de combustible de Artemis I. Los equipos técnicos también prestarán mucha atención a la efectividad de los procedimientos recientemente actualizados para limitar la cantidad de nitrógeno gaseoso que se acumula en el espacio que está entre el módulo de tripulación de Orion y las escotillas del sistema de cancelación de lanzamiento, lo que podría representar un problema para el personal de cierre.
Es posible que se requieran ensayos generales con circulación de combustible adicionales para garantizar que el vehículo esté completamente revisado y apto para el vuelo.
De ser necesario, la NASA podría trasladar al cohete SLS y la nave Orion de vuelta al Edificio de Ensamblaje de Vehículos para realizar trabajos adicionales antes del lanzamiento después del ensayo general con circulación de combustible.
Próximos pasos para el lanzamiento
Después de un exitoso ensayo general con circulación de combustible, la NASA convocará una revisión de aptitud para el vuelo en la cual el equipo de gestión de la misión evaluará la aptitud de todos los sistemas, incluyendo el hardware de vuelo, la infraestructura y el personal de lanzamiento, vuelo y recuperación antes de comprometerse con una fecha de lanzamiento.
Aunque la ventana para el lanzamiento de Artemis II se podría iniciar tan pronto como el viernes 6 de febrero, el equipo de gestión de la misión evaluará la aptitud para el vuelo después del ensayo general con toda la nave espacial, la infraestructura de lanzamiento, y la tripulación y el personal de operaciones antes de seleccionar una fecha para el lanzamiento.
A fin de determinar las posibles fechas de lanzamiento, los ingenieros identificaron las restricciones clave necesarias para cumplir la misión y mantener a salvo a la tripulación dentro de Orion. Los períodos de lanzamiento resultantes son los días o las semanas en los que la nave espacial y el cohete pueden cumplir los objetivos de la misión. Estos períodos de lanzamiento explican la compleja mecánica orbital relacionada con el lanzamiento en una trayectoria precisa hacia la Luna mientras la Tierra rota sobre su eje y la Luna orbita la Tierra cada mes en su ciclo lunar. Esto da como resultado un patrón de alrededor de una semana de oportunidades de lanzamiento, seguido de tres semanas sin oportunidades de lanzamiento.
Existen varios parámetros principales que establecen la disponibilidad del lanzamiento dentro de estos períodos. Debido a su trayectoria única en relación con las misiones de alunizaje posteriores, estas limitaciones clave son exclusivas del vuelo de prueba de la misión Artemis II.
- El día y la hora de lanzamiento deben permitir que SLS pueda llevar a Orion a una órbita terrestre alta, donde la tripulación y los equipos técnicos en tierra evaluarán los sistemas de soporte vital de la nave espacial antes de que la tripulación emprenda su viaje con rumbo a la Luna.
- Orion también debe estar en la alineación adecuada con la Tierra y la Luna en el momento del encendido de motores con inyección translunar. El encendido de motores con inyección translunar de Artemis II pone a Orion en rumbo de sobrevolar la Luna, y también lo pone en una trayectoria de retorno libre, en la cual la nave espacial utiliza la gravedad de la Luna para enviar la nave espacial de regreso a la Tierra sin maniobras adicionales importantes de propulsión.
- La trayectoria para un día determinado debe garantizar que Orion no esté en la oscuridad durante más de 90 minutos a la vez para que las alas de los paneles solares puedan recibir y convertir la luz solar en electricidad, y la nave espacial pueda mantener un rango de temperatura óptimo. Los planificadores de la misión eliminan las posibles fechas de lanzamiento que llevarían a Orion a eclipses prolongados durante el vuelo.
- La fecha de lanzamiento debe sustentar una trayectoria que permita el perfil de entrada adecuado planificado durante el regreso de Orion a la Tierra.
Los períodos a continuación muestran la disponibilidad de llevar a cabo el lanzamiento hasta abril de 2026. Los planificadores de la misión mejoran estos períodos en función de un análisis actualizado más o menos dos meses antes de que estos comiencen, y ellos están sujetos a cambios.
Período de lanzamiento del 31 de enero al 14 de febrero
- Oportunidades de lanzamiento los días 6, 7, 8, 10 y 11 de febrero
Período de lanzamiento del 28 de febrero al 13 de marzo
- Oportunidades de lanzamiento los días 6, 7, 8, 9, 11 de marzo
Período de lanzamiento del 27 de marzo al 10 de abril
- Oportunidades de lanzamiento los días 1, 3, 4, 5, 6 de abril
Además de las oportunidades de lanzamiento basadas en la mecánica orbital y los requisitos de desempeño, también existen restricciones sobre qué días dentro de un período de lanzamiento pueden ser viables en función de la reposición de productos básicos, las condiciones meteorológicas y las operaciones de otros usuarios en el cronograma del Área Este. Como regla general, se pueden hacer hasta cuatro intentos de lanzamiento dentro de la semana aproximada de oportunidades que existen dentro de un período de lanzamiento.
Mientras la agencia se prepara para su primera misión tripulada más allá de la órbita terrestre en más de 50 años, la NASA espera aprender durante los procesos, tanto en tierra como en vuelo, y dejará que la aptitud y el desempeño de sus sistemas indiquen el momento en que la agencia está lista para el lanzamiento.
Como parte de una edad de oro de innovación y exploración, el vuelo de prueba de Artemis II, el cual tendrá una duración aproximada de 10 días, es el primer vuelo tripulado para la campaña Artemis de la NASA. Este es otro paso hacia nuevas misiones tripuladas de Estados Unidos en la superficie de la Luna, lo que llevará a una presencia sostenida en la Luna que ayudará a la agencia a prepararse para enviar a los primeros astronautas estadounidenses a Marte.
Encuentra más información sobre la campaña Artemis de la NASA en el siguiente sitio web (en inglés):
https://www.nasa.gov/artemis
Powered by WPeMatico
Get The Details…
Tiernan P. Doyle